Key Takeaways
- After more than a decade of growth dominance, international value stocks have staged a comeback since 2020, driven by inflation, rising interest rates and sector rotation toward financials and cyclicals.
- The MSCI EAFE Value Index’s over-weight in Financials and under-weight in Tech positions it to benefit from a “higher for longer” global interest rate environment, especially if Japanese banks continue to re-rate.
- While Tech and Health Care still dominate MSCI EAFE Growth, a renewed pivot to long-duration assets could reignite growth leadership—especially if central banks turn dovish again in response to slowing inflation or rising recession risks.
Investors often debate the merits of value versus growth investing, but when it comes to developed international equities, the conversation isn't static; it moves in cycles. The performance of the MSCI EAFE Value and MSCI EAFE Growth Indexes reveals a clear regime-based rhythm: multi-year periods where value leads are followed by extended stretches of growth dominance, only to see value rise again. These aren't random fluctuations—they're structural shifts.
From the late 1990s through 2007, EAFE Value dominated. Then, for more than a decade, starting in 2007, growth took the reins. Since 2020, value has once again asserted itself. These inflection points reflect more than just market sentiment—they're underpinned by the sectoral DNA of the two styles.
MSCI EAFE Value is deeply rooted in Financials, Energy and Utilities—sectors that tend to benefit from rising interest rates, inflationary trends and mean reversion. Financials alone make up more than one-third of the Index.1 In contrast, MSCI EAFE Growth leans heavily on Industrials, Health Care and Technology, sectors that often thrive on innovation, long-duration earnings expectations and low-rate environments. Information Technology alone represents more than 15% of the Growth Index2 but less than 2% of Value.
This sector composition helps explain the style rotation dynamics. When the macro environment favors capital-intensive, rate-sensitive sectors—like in the post-COVID-19 recovery—value shines. When growth is scarce, and innovation is prized, growth takes over.
Understanding these style regimes is not just an academic exercise—it's critical to international portfolio construction. As markets rotate again in 2025 and beyond, investors must ask: Are we still in the early innings of a value renaissance or nearing another pivot back to growth?
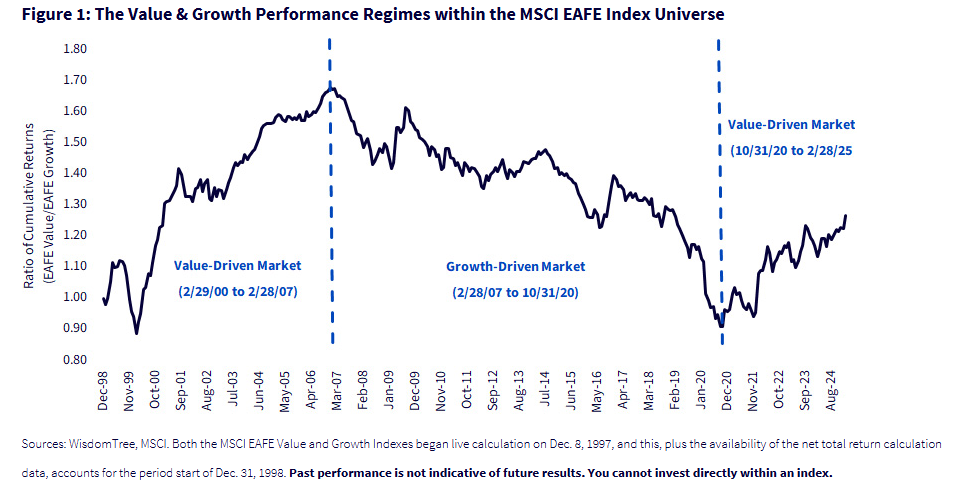
Three Distinct Regimes: Value vs. Growth Across Time
The chart below shows the ratio of cumulative returns between the MSCI EAFE Value and MSCI EAFE Growth Indexes.3 It is a simple yet powerful visual that maps the ebb and flow of style leadership in international developed markets. Three distinct regimes emerge:
1. Value-Led Regime (Late 1998–March 2007)4
This period captures the aftermath of the tech bubble's inflation and eventual collapse. In the late 1990s, global equity markets—especially in the U.S., but with ripple effects internationally—became heavily concentrated in Technology and Telecommunications. As the bubble burst in 2000, growth-heavy names sharply corrected, while more traditionally valued sectors like Financials, Energy and Industrials held firm or even rallied.
The EAFE Value Index, with its over-weight in Financials and under-weight in Tech, outperformed decisively after this bursting. Financials were seen as the backbone of global capital formation and economic expansion, and international banks, particularly in Europe and Japan, still commanded significant market confidence. This regime culminated in early 2007 with the relative peak in the value/growth return ratio, which we see in figure 1.
2. Growth-Led Regime (March 2007–November 2020)5
The global financial crisis of 2008–09 fundamentally altered investor preferences. Banks—especially in Europe—suffered reputational and balance sheet damage from which they've taken more than a decade to recover. Meanwhile, global interest rates plummeted, and monetary policy regimes turned persistently dovish, favoring long-duration assets.
Growth sectors such as Health Care, Technology and Consumer Discretionary, which feature prominently in the MSCI EAFE Growth Index, outperformed in this low-rate, disinflationary environment. The underperformance of value wasn't just cyclical—it became structural, with Financials and Energy lagging amid regulatory overhangs and weak demand growth.
3. Return of Value? (Post-November 2020–Present)6
The post-COVID-19 recovery sparked a dramatic rotation. Vaccine-driven reopenings, supply-side inflation and aggressive fiscal stimulus reawakened inflation expectations. Central banks began hiking rates after a decade-plus of suppression. This shift in macro regime—characterized by tighter monetary policy, steeper yield curves and a stronger bid for cyclical recovery—favored value-oriented sectors.
Notably, international Financials, particularly outside the U.S., have rebounded sharply. The relative return ratio in figure 1 began rising again after bottoming in late 2020, suggesting we may be in the early stages of a new value regime.

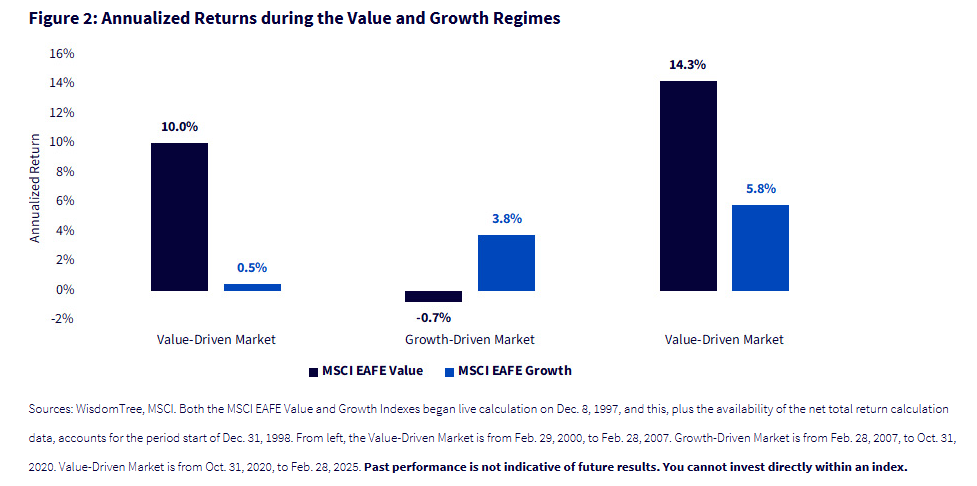
Here, in figure 2, we see the difference in annualized returns across these regimes.
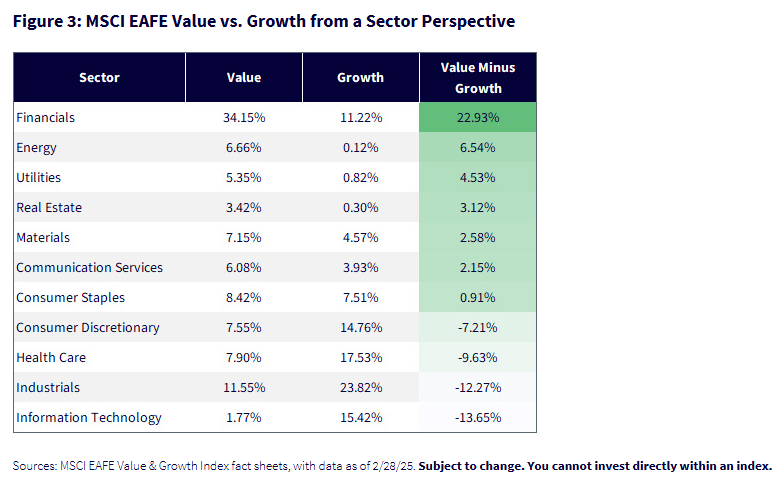
Style Exposure by Sector: Looking Forward through the Lens of Composition
The table in figure 3 provides a striking view of the sector composition split between the MSCI EAFE Value and Growth Indexes. The divergences are consequential. Sector tilts will likely be the primary drivers of relative performance in the next phase of this style cycle.
Bullish Case for Value: Anchored in Financials and Cyclicals
- Financials (34.15% of EAFE Value vs. 11.22% of Growth):
This is the critical swing sector for the value style. Non-U.S. banks, especially in Japan and parts of Europe, are finally benefiting from steepening yield curves and rising net interest margins.7 Japan's nascent exit from yield curve control and negative rates is especially significant—this could represent the beginning of a structural re-rating in Japanese bank equities.
If inflation proves sticky and monetary policy normalization continues outside the U.S., this tailwind likely persists.
Modest allocations in EAFE Value but important contextually. If geopolitical instability (e.g., Red Sea disruptions, OPEC+ policy rigidity) sustains elevated energy prices, the value tilt benefits disproportionately. Utilities also tend to do well in inflationary environments if pricing power is maintained.
- Materials and Industrials:
While Industrials are technically growth-weighted in this index structure, the cyclical nature of these sectors means they could benefit from global infrastructure stimulus (e.g., EU green transition spending, Japanese reindustrialization). A broad capex cycle, especially one driven by reshoring or defense, could blur the value/growth divide here but tilt toward value due to valuation gaps.
Conclusion: If global central banks maintain higher-for-longer policies, or we see renewed inflationary or cyclical economic impulses—particularly outside the U.S.—then the sector composition argues strongly in favor of continued value outperformance.
Bullish Case for Growth: Innovation and Earnings Momentum in Tech and Health Care
- Information Technology (15.42% of EAFE Growth vs. 1.77% in Value):
Traditionally a U.S.-dominated theme, but EAFE Tech is evolving. The MSCI EAFE Growth Index increasingly captures advanced automation, precision manufacturing, semiconductors and industrial software—key enablers of digitization and artificial intelligence (AI) diffusion in global supply chains.
If investor sentiment rotates back to long-duration growth assets or earnings momentum continues to concentrate in these innovation-driven firms, growth could regain traction—even amid higher rates.
- Health Care (17.53% in Growth vs. 7.90% in Value):
A secular compounder with strong defensive qualities, Health Care has benefited from demographic tailwinds, biotech innovation and high-margin models. While stretched valuations may limit upside, it remains a ballast in downturns and could outperform if growth becomes scarce or geopolitical risk rises.
Conclusion: If inflation cools more rapidly than expected or recession risks rise, central banks may pivot dovish again. Under such a scenario—combined with continued earnings dominance in Tech and Health Care—the case for growth leadership strengthens.
Conclusion: Historical Rhythms Can Help in Setting Future Expectations
While we can never know ahead of time what returns will be, a keen understanding of historical track records can always provide helpful context. Here, we can understand different regimes of MSCI EAFE Value and Growth outperformance and underperformance. In a second piece, we will relate this to dividend-paying stocks, where you can also group companies on the basis of higher dividend yields (more value-oriented) and stronger growth and quality characteristics (more growth-oriented).
1 Source: MSCI EAFE Value Index fact sheet, with data as of 2/28/25.
2 Source: MSCI EAFE Growth Index fact sheet, with data as of 2/28/25.
3 Both the MSCI EAFE Value and Growth Indexes began live calculation on December 8, 1997, which accounts for the periods shown in subsequent figures.
4 Specific dates: 2/29/00–2/28/07.
5 Specific dates: 2/28/07–10/31/20.
6 Specific dates: 10/31/20–2/28/25.
7 Sources: Anton Bridge, "Japan's megabanks set for record FY (fiscal year) profit after strong Q3," Reuters, 2/4/25; Nicolas Charnay and Karim Kroll, "European Banks Will Pull Multiple Levers to Protect Operating Performance In 2025–2026."
U.S. investors only: Click here to obtain a WisdomTree ETF prospectus which contains investment objectives, risks, charges, expenses, and other information; read and consider carefully before investing.
There are risks involved with investing, including possible loss of principal. Foreign investing involves currency, political and economic risk. Funds focusing on a single country, sector and/or funds that emphasize investments in smaller companies may experience greater price volatility. Investments in emerging markets, currency, fixed income and alternative investments include additional risks. Please see prospectus for discussion of risks.
Past performance is not indicative of future results. This material contains the opinions of the author, which are subject to change, and should not to be considered or interpreted as a recommendation to participate in any particular trading strategy, or deemed to be an offer or sale of any investment product and it should not be relied on as such. There is no guarantee that any strategies discussed will work under all market conditions. This material represents an assessment of the market environment at a specific time and is not intended to be a forecast of future events or a guarantee of future results. This material should not be relied upon as research or investment advice regarding any security in particular. The user of this information assumes the entire risk of any use made of the information provided herein. Neither WisdomTree nor its affiliates, nor Foreside Fund Services, LLC, or its affiliates provide tax or legal advice. Investors seeking tax or legal advice should consult their tax or legal advisor. Unless expressly stated otherwise the opinions, interpretations or findings expressed herein do not necessarily represent the views of WisdomTree or any of its affiliates.
The MSCI information may only be used for your internal use, may not be reproduced or re-disseminated in any form and may not be used as a basis for or component of any financial instruments or products or indexes. None of the MSCI information is intended to constitute investment advice or a recommendation to make (or refrain from making) any kind of investment decision and may not be relied on as such. Historical data and analysis should not be taken as an indication or guarantee of any future performance analysis, forecast or prediction. The MSCI information is provided on an “as is” basis and the user of this information assumes the entire risk of any use made of this information. MSCI, each of its affiliates and each entity involved in compiling, computing or creating any MSCI information (collectively, the “MSCI Parties”) expressly disclaims all warranties. With respect to this information, in no event shall any MSCI Party have any liability for any direct, indirect, special, incidental, punitive, consequential (including loss profits) or any other damages (www.msci.com)
Jonathan Steinberg, Jeremy Schwartz, Rick Harper, Christopher Gannatti, Bradley Krom, Kevin Flanagan, Brendan Loftus, Joseph Tenaglia, Jeff Weniger, Matt Wagner, Alejandro Saltiel, Ryan Krystopowicz, Brian Manby, and Scott Welch are registered representatives of Foreside Fund Services, LLC.
WisdomTree Funds are distributed by Foreside Fund Services, LLC, in the U.S. only.
You cannot invest directly in an index.
A message from Advisor Perspectives and VettaFi: To learn more about this and other topics, check out some of our webcasts.
© WisdomTree, Inc.
Read more commentaries by WisdomTree, Inc.