Non-U.S. Investing In a Fragmenting World
Membership required
Membership is now required to use this feature. To learn more:
View Membership BenefitsOur strategy work and quantitative insights suggest the conditions behind more than a decade of U.S. equity outperformance are starting to shift. We see three drivers: (1) tariffs are weighing on U.S. household income and may curb consumption; (2) fiscal and economic policy abroad is becoming more proactive; and (3) macro conditions are reshaping relative growth prospects. As growth differentials narrow, we see more compelling valuations—and potential capital flows—outside the United States.
Three Pillars of Non-U.S. Investing Revisited
Five years ago, in “Three Pillars of International Investing,” we explained why we think investors should consider allocating to non-U.S. equities. The crux of our argument was threefold.
First, company-specific factors, including what we call Sustainable Value Creation (which is essentially strong corporate performance), are increasingly more important than country-specific factors, and as we look across our opportunity set of global equities, we find that more companies that deliver strong Sustainable Value Creation are found outside the United States.
Second, expectations for earnings growth and return on invested capital (ROIC) have become more favorable outside the United States—and our outlook for growth in key industries suggests accelerating demand and emerging business models abroad.
Third, the regulatory environment outside the United States is more conducive to the proliferation of disruptive business models.
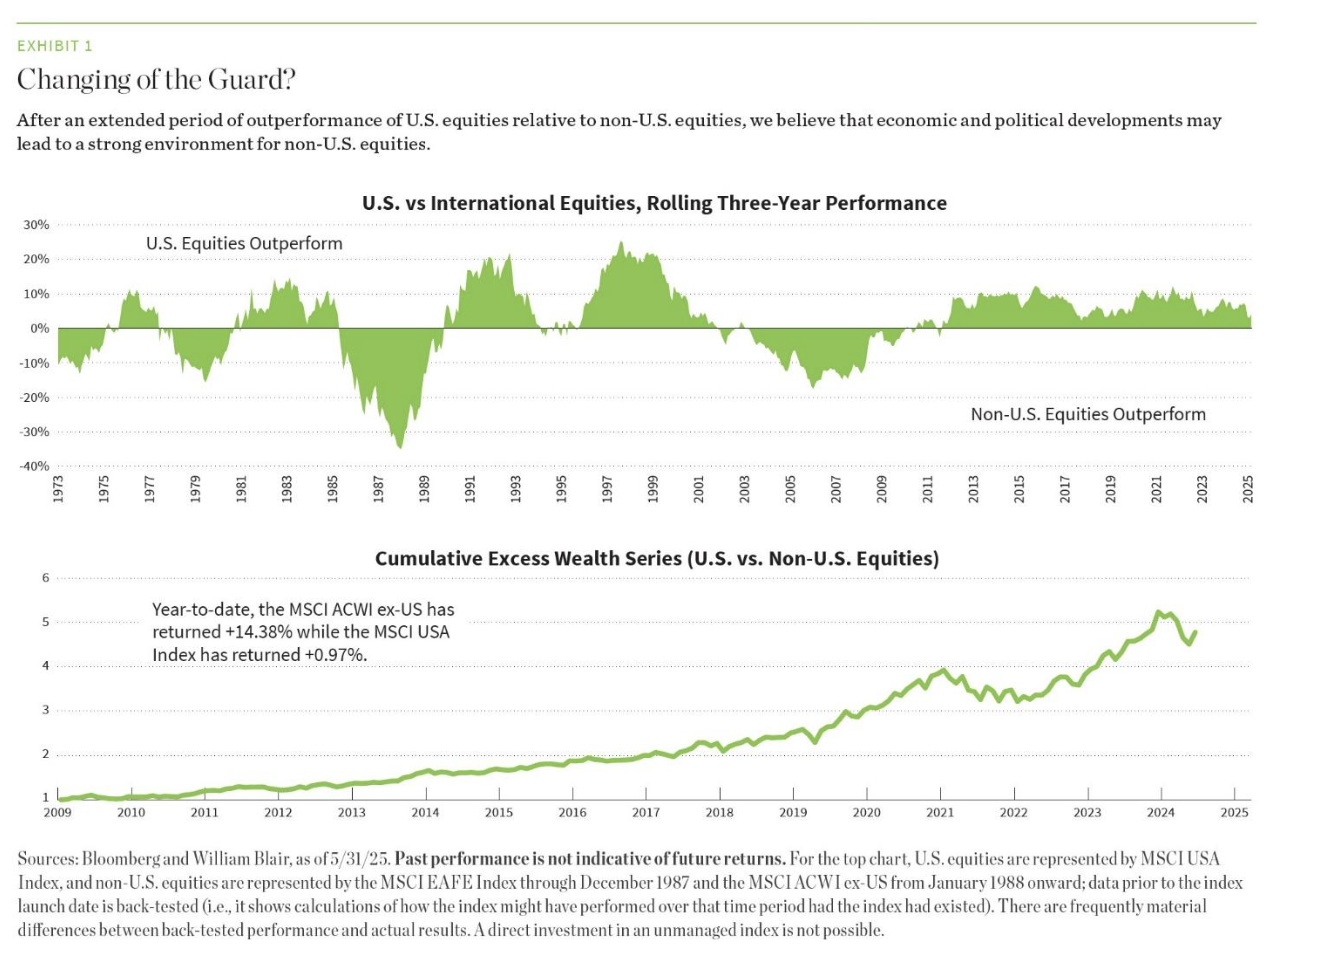
While each of these pillars remains a relevant argument as to why we believe investors should allocate to non- U.S. equities, we find that new forces are emerging that underpin why the year-to-date outperformance of non-U.S. is a movement—not just a moment. Exhibits 1 illustrates.
Time for a Refresh?
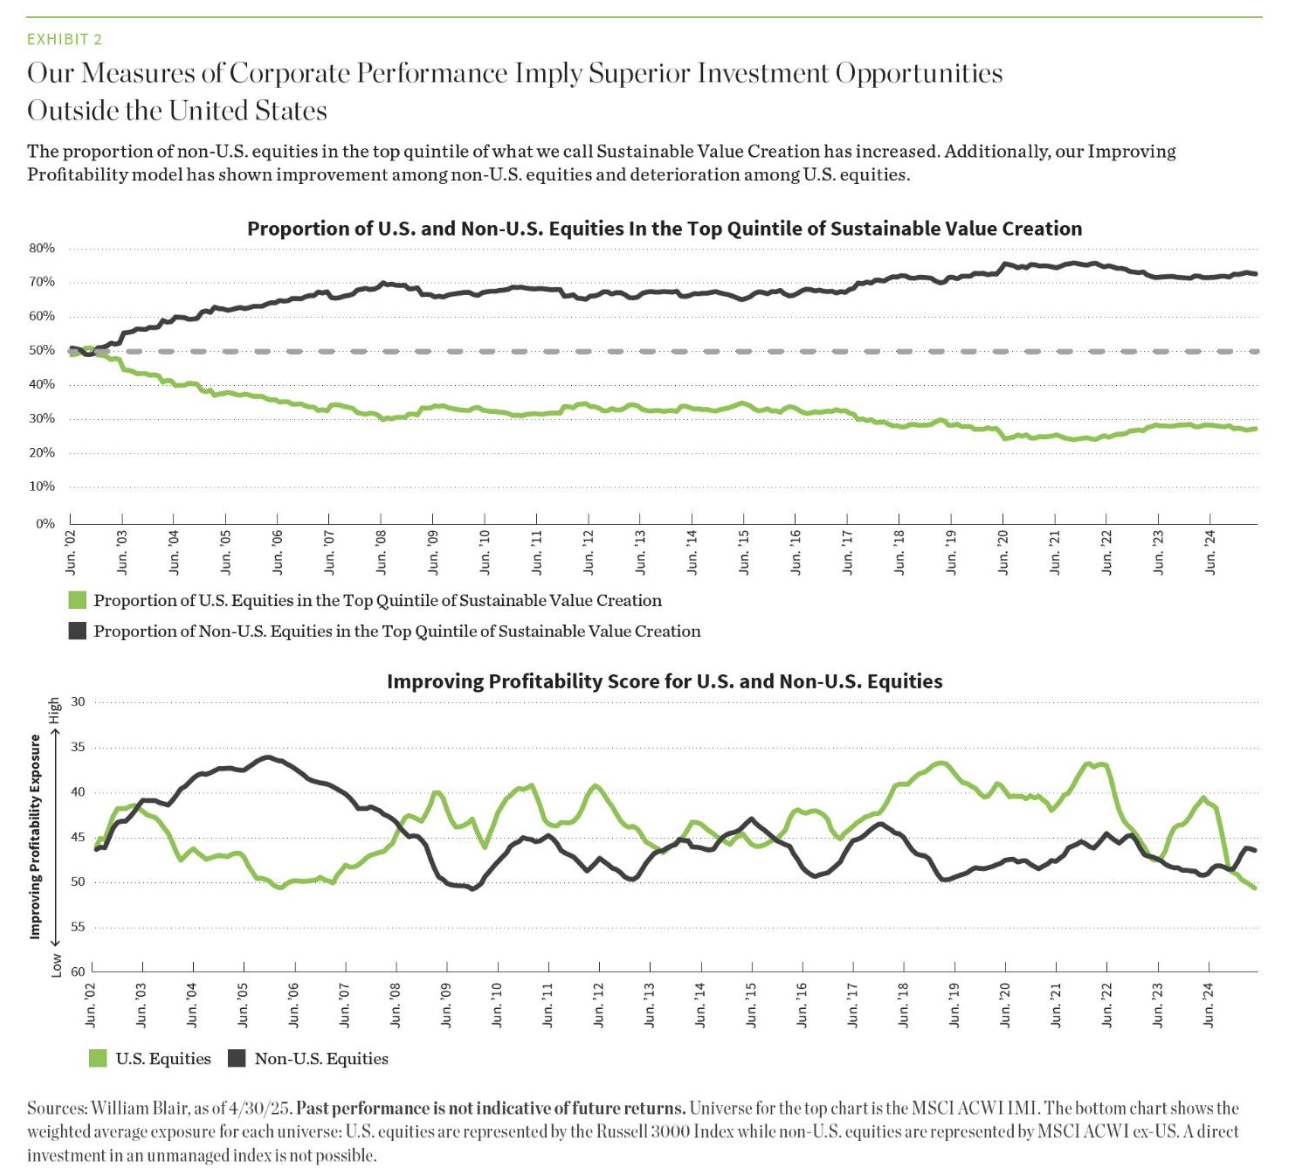
For more than two decades, the fishing pond of high-quality growth investments has been expanding such that the opportunity set outside the United States is now larger than inside the United States, as exhibit 2 illustrates. This is likely non-controversial given that the percent of nominal global gross domestic product (GDP) outside the United States has grown from 68% in 2011 to over 73% currently.
In addition, our quantitative indicators such as Improving Profitability—which tracks directional shifts in corporate profitability—are turning positive outside the United States while showing greater volatility and deterioration within the United States, as shown in exhibit 2.
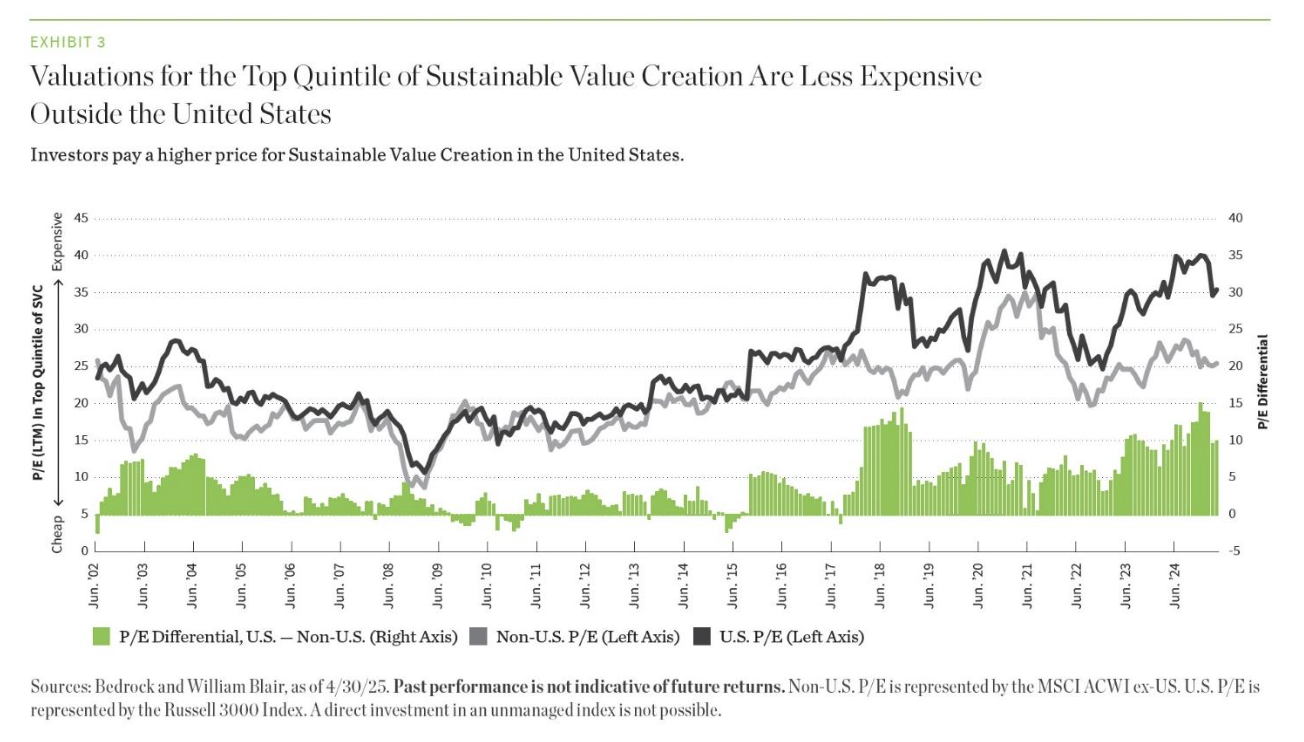
As institutional investor interest in developed non-U.S. and emerging markets (EM) equities has grown, companies in these jurisdictions have professionalized their operations and implemented a shareholder return focus that has resulted in a higher-quality investment opportunity set. In addition to boasting a burgeoning universe of high-quality growth candidates, valuations outside the United States have been lower than those in the United States for some time while fundamentals have held up quite well, as exhibit 3 illustrates.
As we entered 2025, the gap between the United States and the rest of the world—in economic growth, corporate profit margins, and relatedly, equity valuations—was at or near a historic high. While the performance gap between U.S. and non-U.S. equities has historically been cyclical, the latest divergence was underpinned by a distinct combination in the United States of economic dynamism, leadership in technology innovation, and strong institutions.
Today, however, shifts in policy direction under the current U.S. administration, combined with the ambitions and commitments of a galvanized European Union (EU), suggest we may be on the precipice of change.
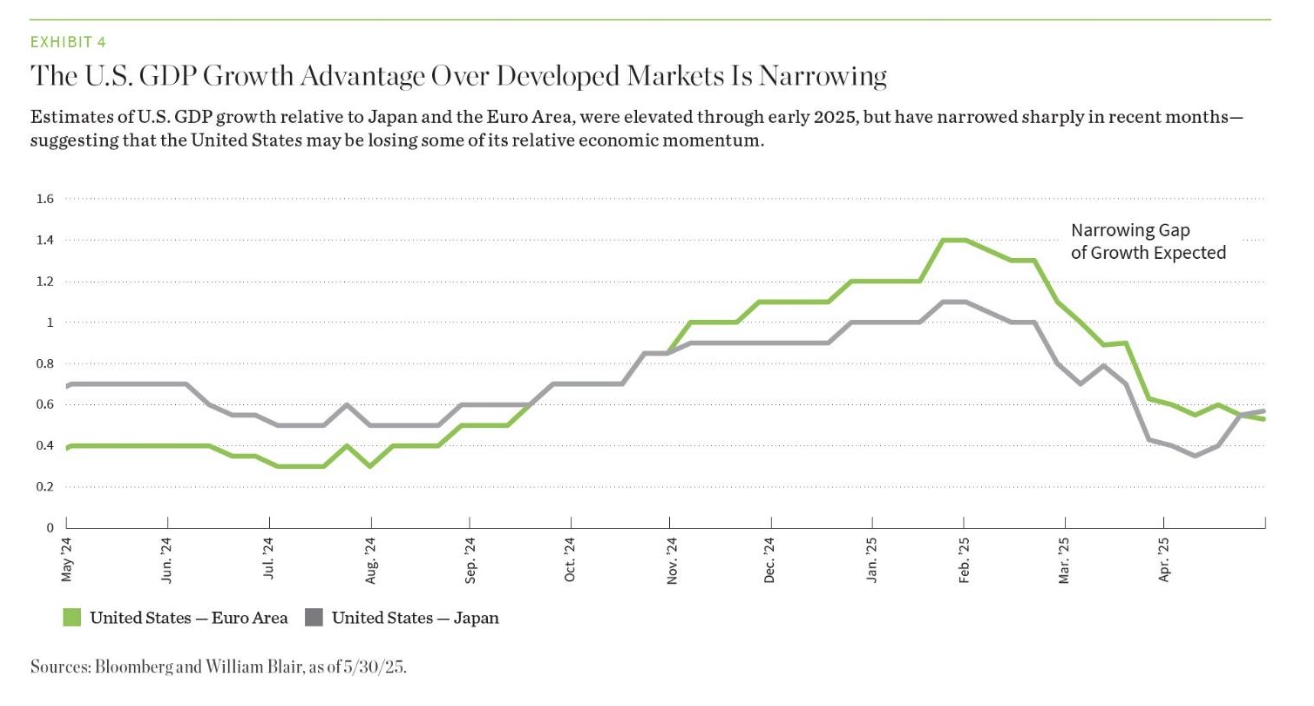
What’s different now is that the growth differential between the United States and the rest of the world is narrowing, as shown in exhibit 4. In a low-growth environment, we have observed that investors have been willing to pay a premium for U.S. earnings growth, which has consistently outpaced non-U.S. markets since the global financial crisis. But that premium may no longer be justified.
We believe several forces—tariffs that weigh on U.S. household disposable income, shifts in fiscal and economic policy abroad, and evolving macroeconomic conditions— could compress growth differentials between the United States, Europe, Japan, and China. As a result, the valuation per unit of growth equation looks increasingly favorable for markets outside the United States, potentially supporting greater capital flows into non-U.S. equities.
Force No. 1: Tariffs
We expect U.S. households to absorb the bulk of price increases resulting from tariffs, and higher prices should erode purchasing power and curb consumption by U.S. consumers.
Broadening tariffs to progressively more products will likely hit U.S. consumers harder than consumers abroad, leading to a contraction in domestic demand. Although reduced U.S. consumption may affect the revenues of non-U.S. exporters, many non-U.S. jurisdictions are benefiting from tailwinds, making us believe now is an exciting time to invest outside the United States.
For example, the U.S. tariffs announced on “Liberation Day,” though delayed, have moved the effective U.S. tariff rate to about 20%, a level last seen in the early 1900s. Even with a 90-day pause on the reciprocal tariffs, the increase leaves the effective rate at a nearly 100-year high. The likely outcomes include slower U.S. growth, higher U.S. inflation, slower-than-anticipated interest-rate cuts (but lower long-term interest rates), and a weaker U.S. dollar.
In addition to direct retaliation, other countries are expected to increase trade barriers to prevent the dumping of goods originally destinated for the United States, reinforcing a global shift toward “country-first” policies globally and accelerating fragmentation in global trade.
Force No. 2: Shifts in Fiscal and Economic Policy Abroad
Amid shifting global dynamics, both Europe and China are redefining their approaches to growth. In Europe, sluggish economic performance is increasingly viewed as a national security risk, prompting a shift toward investment-driven, demand-oriented policy. Meanwhile, China is moving to reverse fiscal drag and double down on industrial self-sufficiency, with early signs of recovery visible in earnings and return metrics. While the drivers differ, both regions are signaling a renewed commitment to growth—offering potential opportunities for globally diversified investors.
Europe’s Growth Mandate
European policymakers have increasingly framed the region’s weak growth as a national security concern. The absence of a unified growth and competitiveness strategy has hindered the EU’s ability to invest meaningfully in its own defense (in an increasingly unstable geopolitical environment), enhance economic resilience in the face of trade wars, and address issues of climate change and the ongoing energy transition.
Over the past year, however, we have seen growing momentum—and concrete steps—across EU member states to address these issues. For example, Germany’s recent election and the suspension of its debt brake mark a significant shift toward more pro-growth policymaking in the region. More broadly, Europe appears to be moving away from its traditional export-led model toward one focused on attracting capital and stimulating domestic demand.
Since the global financial crisis, Europe has experienced sustained capital outflows—most notably from Germany, where companies have invested €1.7 trillion abroad since 2010, often shifting operations to more dynamic economies such as China.
Now, Europe may be reconsidering that trend. Could Chinese firms be allowed to take over idle European auto plants or enter joint ventures on European soil? Such a shift would help keep capital within the region and redirect excess manufacturing capacity from China into Europe—potentially easing inflationary pressures in the process.
Meanwhile, the recent decline in the U.S. dollar versus the euro has amplified losses for European investors with U.S. exposure, increasing the likelihood of capital being repatriated to Europe.
As a result of these changes, European GDP growth is accelerating on the back of increased investment, narrowing the growth wedge between Europe and the United States.
China’s Growth Mandate
Beijing has announced a series of policy measures to reverse China’s fiscal drag on a more sustainable basis. The announced policies fall into four broad categories: local government support in writing off hidden debt; recapitalization of large state-owned banks; limited property-support measures; and income support for the most vulnerable. Eliminating fiscal contraction is likely to boost GDP growth in 2025.
Furthermore, Chinese leadership took the United States’ 2016 pivot in foreign policy quite seriously, embarking on a path of self-sustainability and wholesale industrial upgrading. The story of auto exports, particularly electric vehicles (EVs), is well known, but the industrial upgrading is far broader. An increasing number of Chinese smartphone makers are now eyeing European markets, and China’s domestic output of semiconductors has more than doubled in the last four years to an annual rate of 400 billion chips.
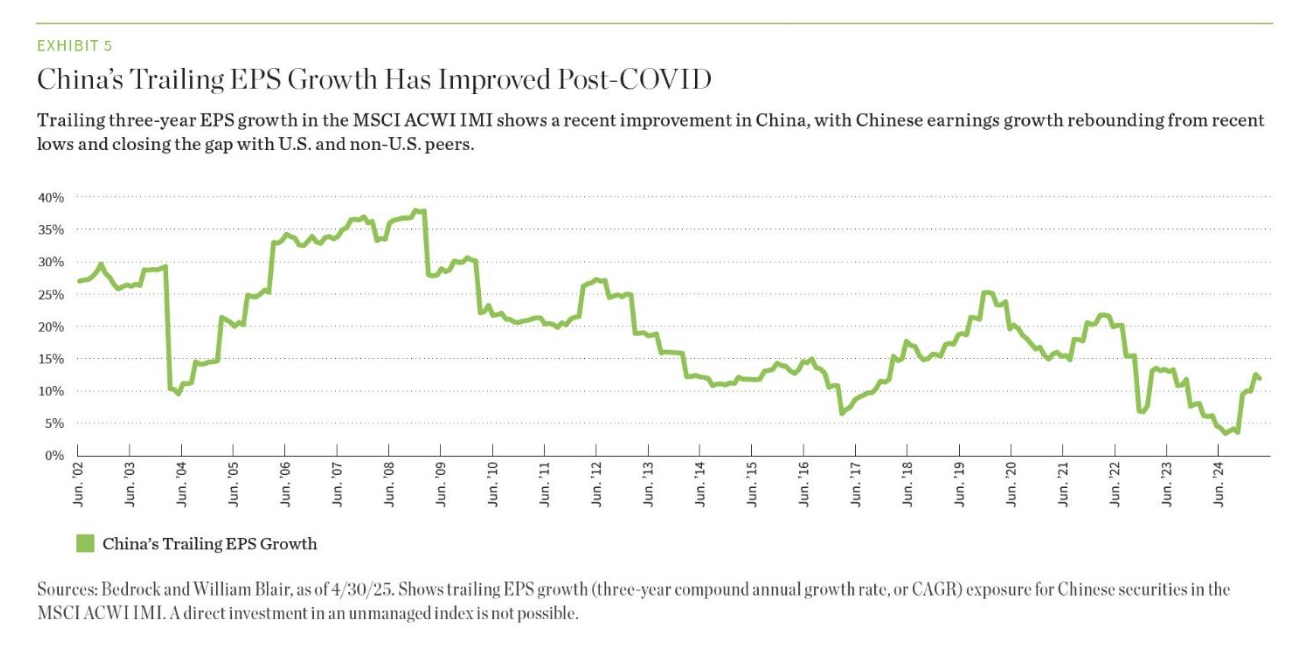
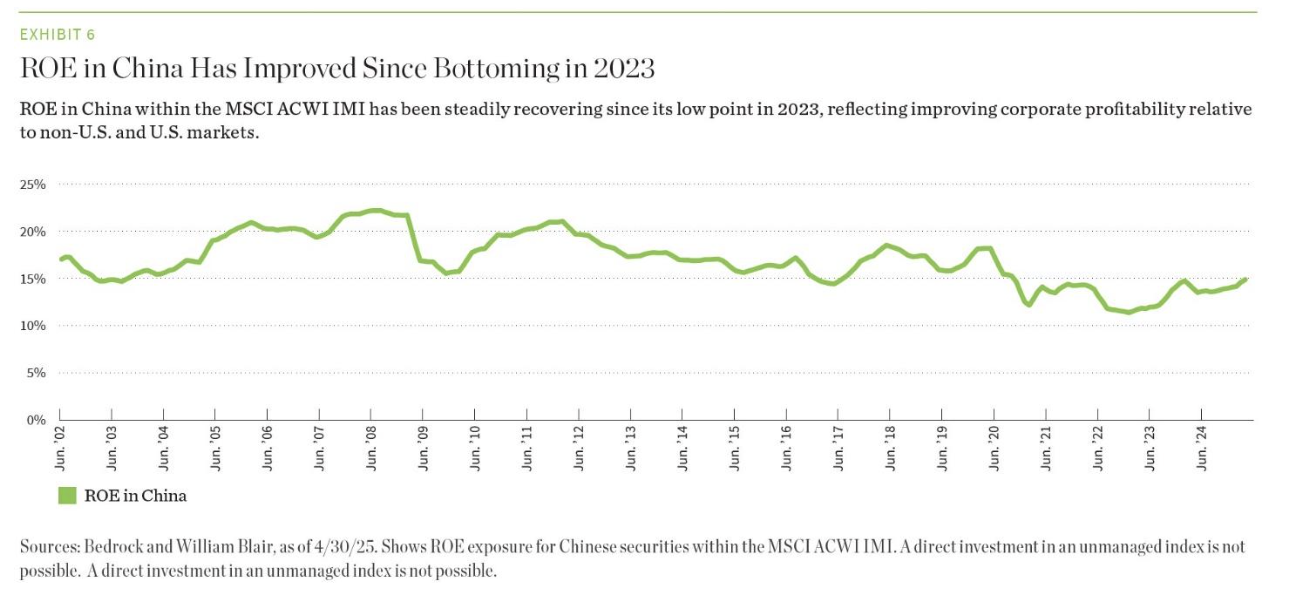
To the extent that the incoming administration wishes to re-industrialize the U.S. Rust Belt, it is conceivable that many Chinese companies would be welcome to set up production facilities in the United States. Far from becoming a drag on growth, a U.S. policy tilt may prove a boon for China Inc. Our quantitative indicators are signaling a material improvement in Chinese earnings per share (EPS) growth, as shown in exhibit 5. We also observe that Chinese return on equity (ROE) has improved markedly since bottoming in 2023, as shown in exhibit 6.
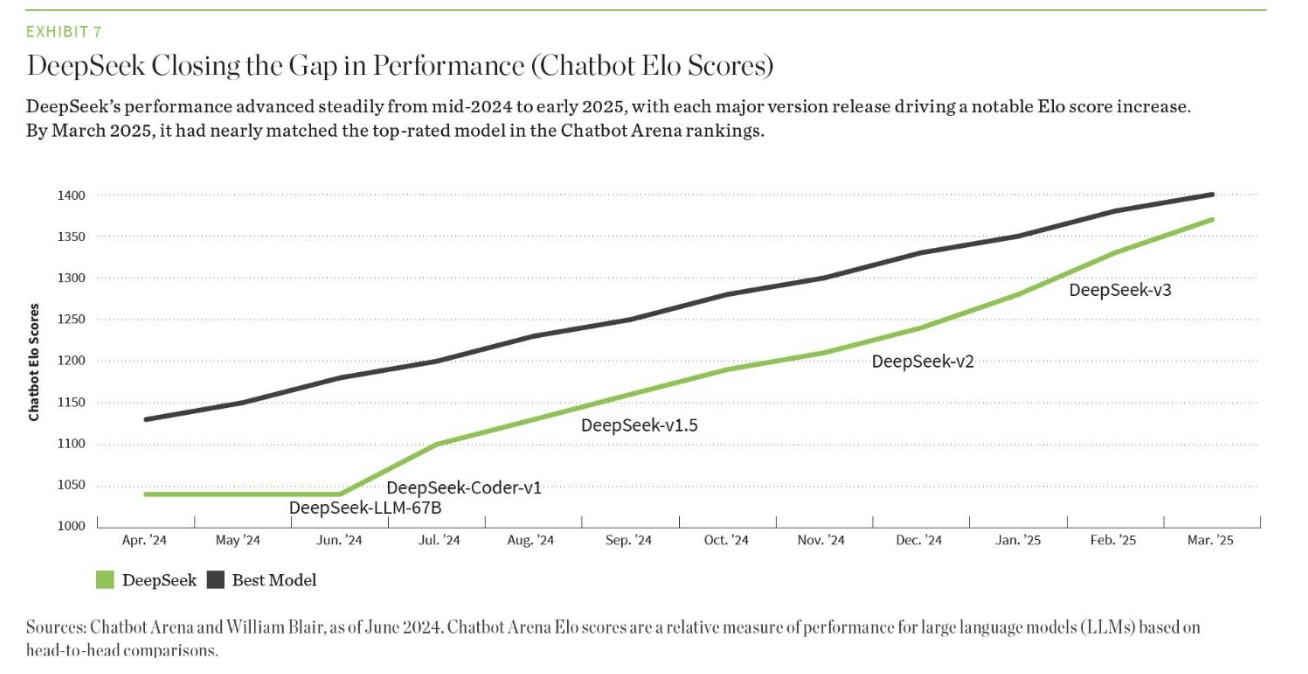
Moreover, China’s IT leadership is expanding. Chinese AI company DeepSeek’s revelation that it had developed AI technology at a fraction of the cost identified by Magnificent Seven tech leaders is another sea change. The open-source AI assistant launch has fueled optimism for AI innovation, challenging the dominance of U.S. tech giants that rely on massive investments in chips, data centers, and energy, as shown in exhibit 7.
News of DeepSeek catalyzed a steep derating across global semiconductors and hyperscaler stocks. But China’s advancements in innovation and technology are not limited to AI. According to the Australian Strategic Policy Institute:
China has strengthened its global research lead in the past year and is currently leading in 57 of 64 critical technologies. This is an increase from 52 technologies last year, and a leap from the 2003-2007 period, when it was leading in just three technologies. Over the past 21 years, China’s rise from a mid-tier position in global research in the late 2000s to mid-2010s into a research and science powerhouse today has been gradual but consistent. It’s been able to convert its research lead into manufacturing in some fields such as electric batteries though there are other areas in which China has been slower to convert its strong research performance into actual technology capability.
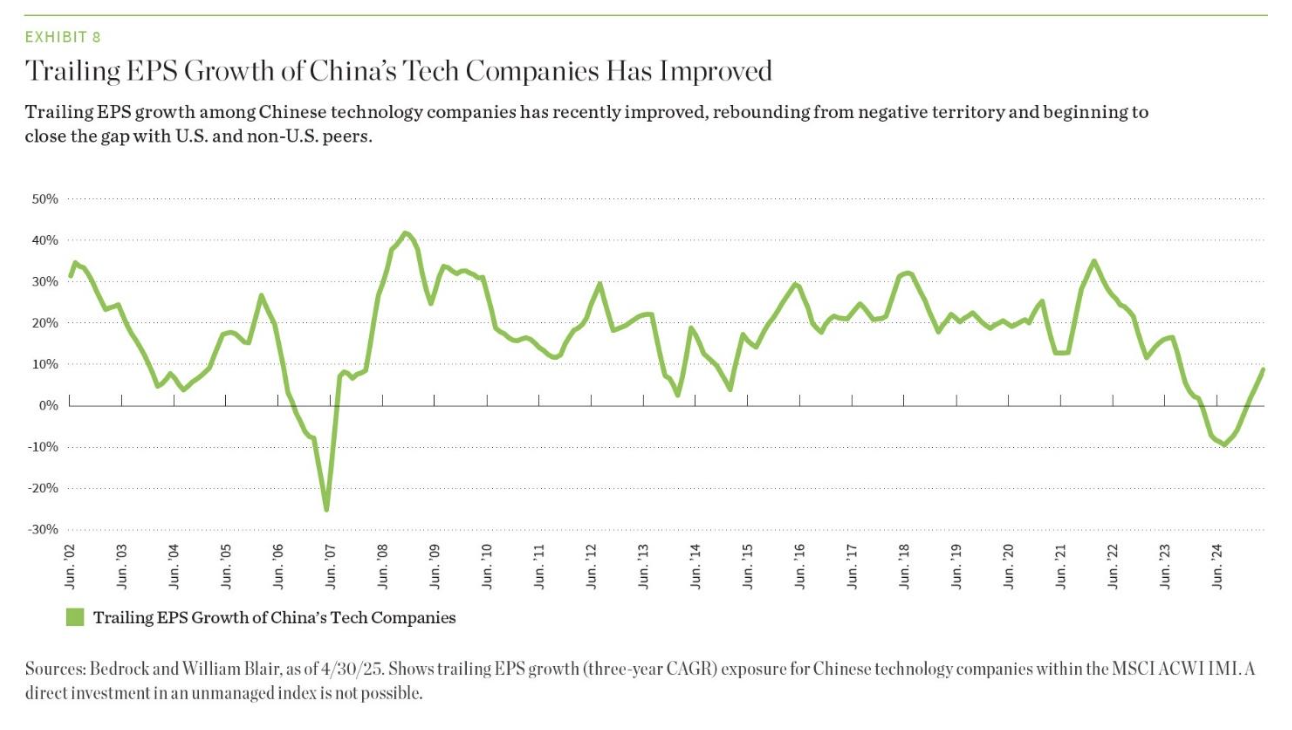
We expect the concentration of tech leadership that we have seen out of the United States to become more dispersed as research spending and technological advancement initiatives of other jurisdictions bear fruit. In fact, our quantitative indicators have signaled a marked improvement in EPS growth among Chinese tech companies after bottoming in 2024, as exhibit 8 shows.
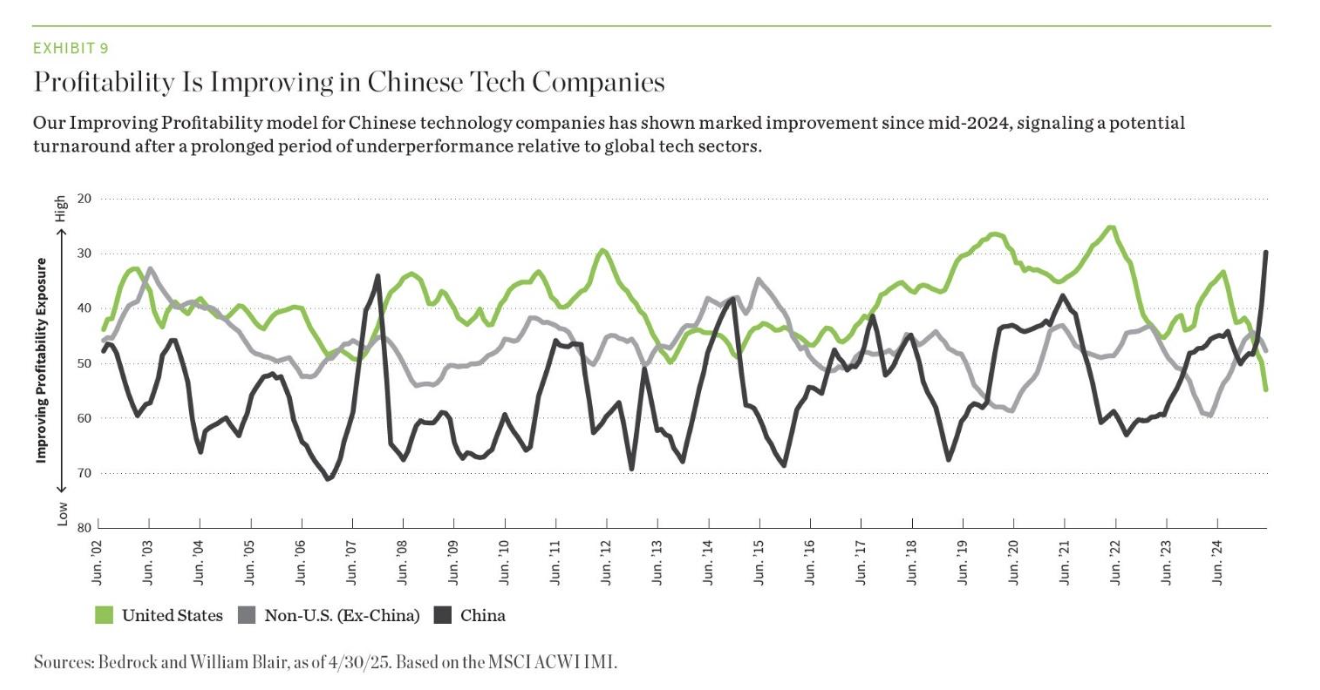
We also find the signal from our Improving Profitability score encouraging with respect to persistence of earnings quality in China’s tech sector, as exhibit 9 shows. Our Improving Profitability model captures the change, as opposed to level, in various factors, including cash flow return on invested capital (CFROIC), ROE, free cash flow margin, research and development (R&D) intensity, and capital expenditures (capex) to identify stocks that we believe are most likely to show improvement/deterioration in their profitability. The Improving Profitability score within Chinese tech has improved dramatically since 2023 while the score in U.S. tech has deteriorated over the same period.
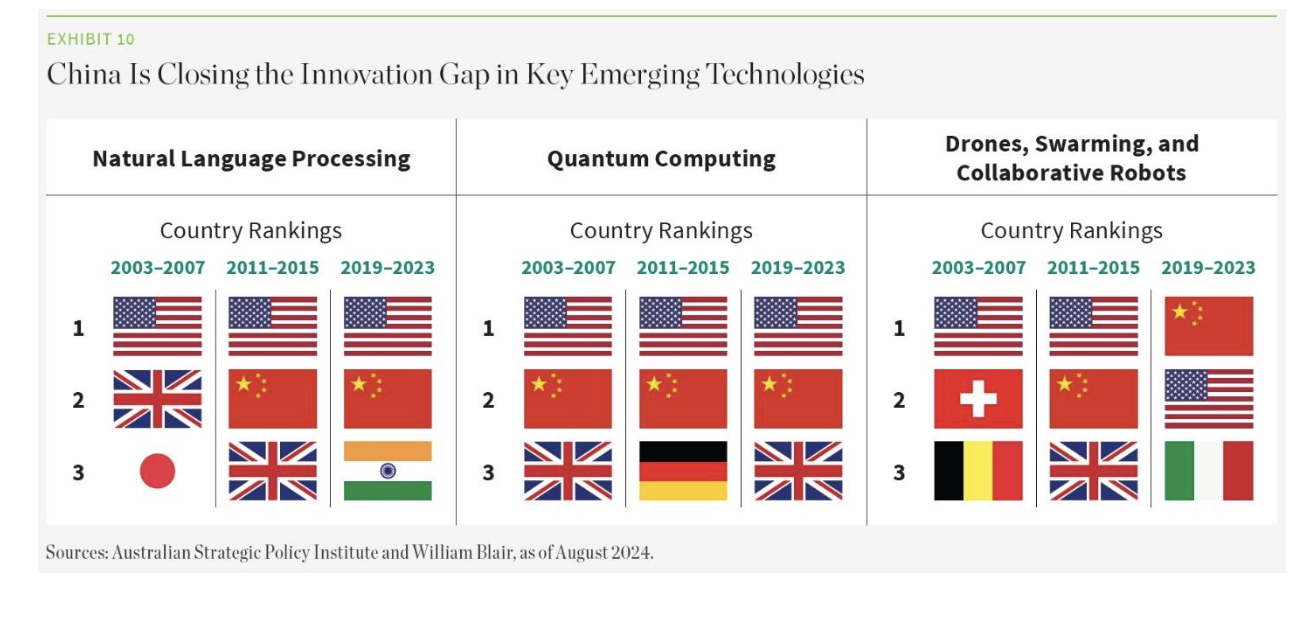
SIDEBAR: China Rises in Global Innovation Rankings
The global innovation landscape is shifting, as shown by changes in country rankings across key emerging technologies. In natural language processing, the United States has maintained its lead, but China has steadily climbed into the top tier alongside India and South Korea. In quantum computing, China has overtaken the United States in recent years. And in drones, swarming, and collaborative robotics, China has clearly emerged as the dominant force, displacing several long-standing leaders in Europe and North America. These trends underscore China’s growing influence in critical research domains once led by Western institutions.
Force No. 3: Evolving Macroeconomic Conditions
Fiscal slippage in the United States, shifting demand for U.S. Treasurys, a weakening U.S. dollar, and diverging inflation trajectories in the United States and Europe are changing the relative attractiveness of U.S. versus non-U.S. assets.
U.S. Deficit Concerns Weigh on U.S Equity Investors
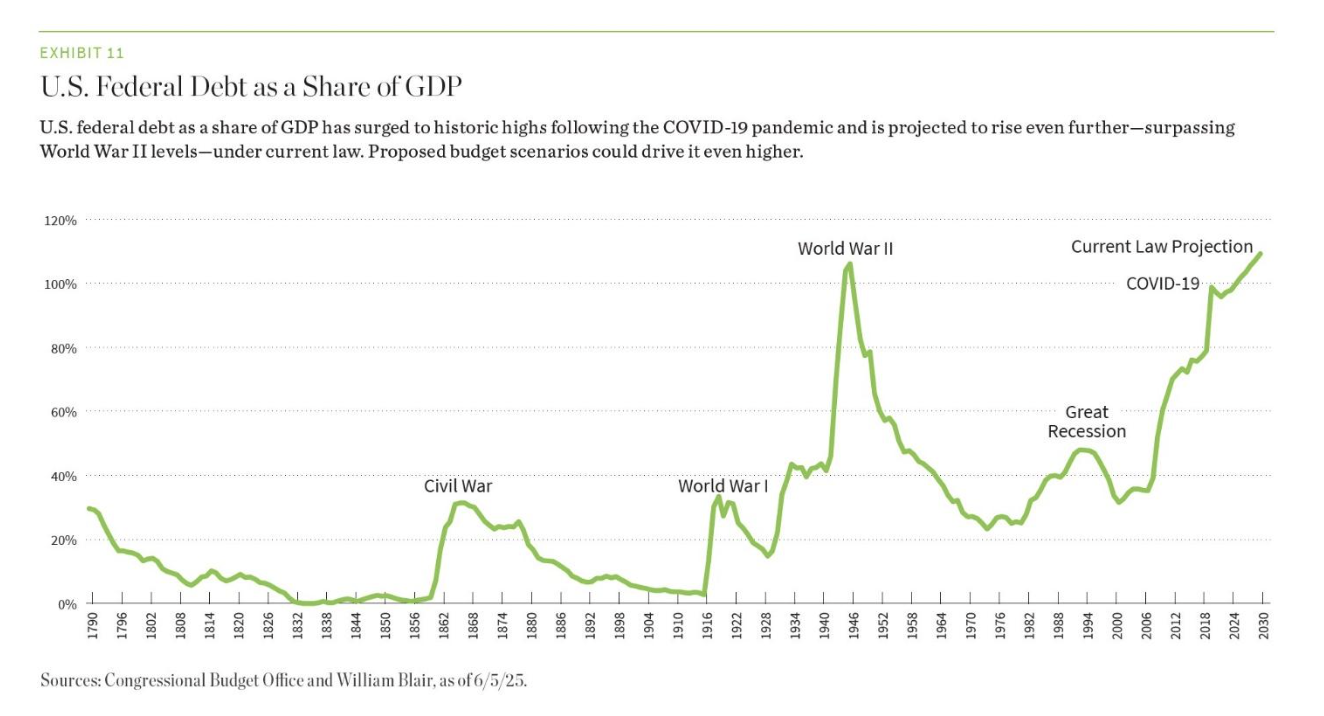
Despite generating revenue from tariffs, the U.S. budget currently under debate is likely to significantly increase the country’s deficit. Combined with softening U.S. growth, this deteriorating fiscal outlook has eroded foreign investor confidence in U.S. assets. That loss of confidence is increasingly visible in the behavior of U.S. Treasurys and the U.S. dollar, reflecting growing concern about the sustainability of the country’s fiscal path. As shown in exhibit 11, federal debt as a share of GDP is already at historic highs and is projected to climb further—surpassing World War II levels.
U.S. Treasury’s: Safe Haven No More?
The steepening U.S. yield curve has been driven by fiscal concerns, waning global demand for long-dated U.S. Treasury’s, and the recent Moody’s downgrade. These developments suggest an erosion of Treasury's traditional safe-haven status and a weakening of the belief that Treasury's will always find buyers in risk-off environments. Given the United States’ heavy reliance on foreign purchases of U.S. Treasury's, the probability of higher borrowing costs is increasing.
Dollar Under Pressure as Global Confidence Wanes
America’s extreme post-COVID fiscal deterioration—combined with the current administration’s unpredictable trade policies—leads us to believe that the U.S. dollar may have peaked.
The growing fiscal deficit is placing upward pressure on U.S. Treasury yield, while a rising share of global trade is being settled in non-dollar terms. This, alongside what in our opinion appears to be a deliberate weakening of the U.S. dollar by the current administration, has raised questions about the long-term desirability of the U.S. as a reserve currency.
Meanwhile, U.S. growth exceptionalism is fading, and overweight U.S. equity allocations by global investors are being rebalanced, also contributing to downward pressure on the dollar. According to Goldman Sachs, foreign investors, led by European institutions, have sold about $60 billion of U.S. equities since March 2025.
For U.S. investors, a weaker dollar could provide a meaningful tailwind to non-U.S. equity returns.
Inflation—Sticky or Subsiding?
The eurozone experienced a sharp power price shock in 2023, but energy costs began to subside in 2024 alongside softening global growth and declining prices for major commodities. As a net energy importer, the region has benefited from both lower input costs and a strengthening euro, which has helped drive inflation lower.
In contrast, U.S. inflation appears sticky and will likely be exacerbated in the short term by tariffs, which puts the U.S. Federal Reserve in a difficult situation in terms of policy setting.
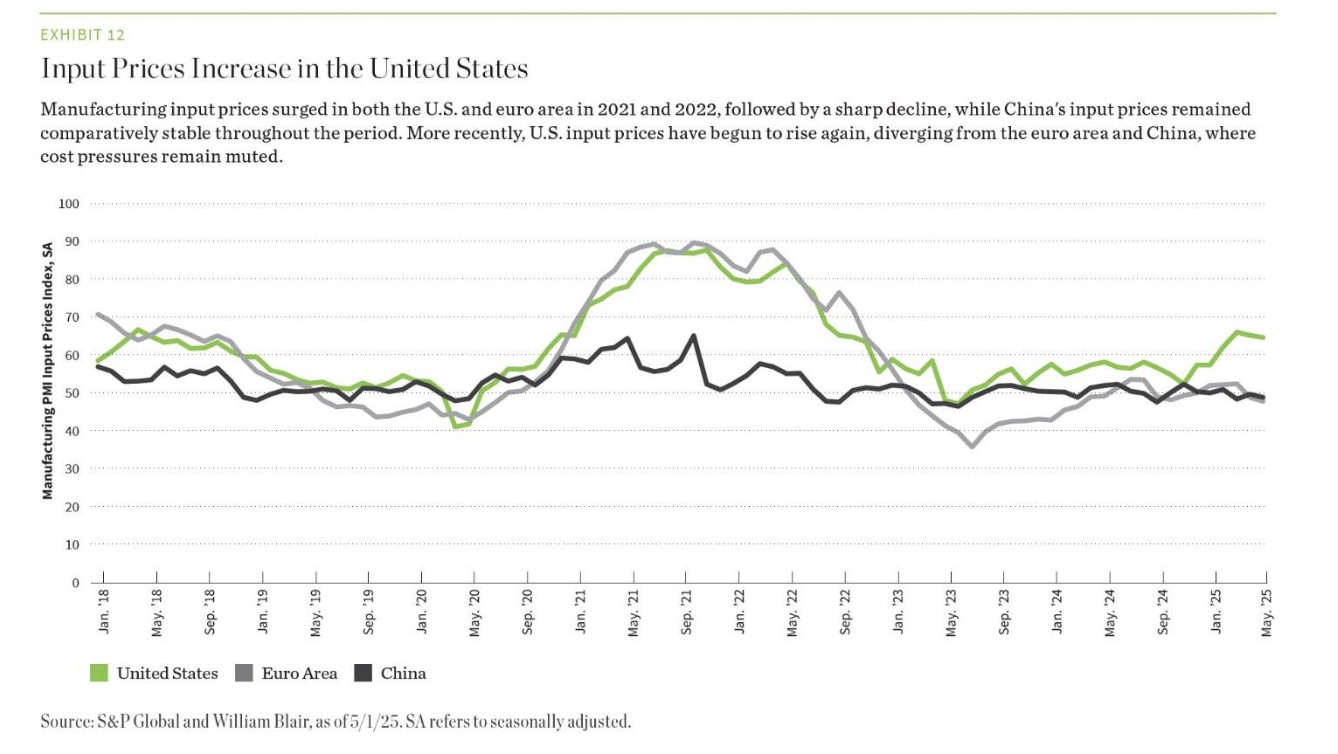
This divergence in inflation dynamics suggests that monetary policy in the EU is likely to be more accommodative than in the United States, creating a supportive environment for euro-area investment. Our analysis of manufacturing purchasing manager index (PMI) input prices, shown in exhibit 12, indicates that while euro-area prices declined sharply after the 2021-2022 shocks and have remained subdued, U.S. input prices have been steadily increasing since late 2024.
SIDEBAR: Emerging Markets: Diverging Paths Amid Policy Shifts and Global Rebalancing
Emerging markets (EMs) are navigating a complex macro environment shaped by higher U.S. interest rates, a weaker U.S. dollar, and muted commodity prices. While some countries face headwinds, others are benefiting from structural tailwinds and geopolitical realignments that could create pockets of resilience and opportunity.
China
Despite ongoing challenges from property-market weakness and weakened consumer confidence, the Chinese government has demonstrated a commitment and ability to support the economy via monetary, fiscal, and policy measures.
While the escalation of the U.S.-China trade conflict has raised concerns about China’s growth, China’s exports have shifted meaningfully: They are increasingly diversified and now focus on other EMs, with nearly half going to the southern hemisphere. This diversification will help buffer the Chinese economy from U.S. tariffs.
In addition, China’s reprioritization of domestic consumption and innovation—partly in response to U.S. trade pressure—could prove highly beneficial for economic growth. Furthermore, the position maintained by the Chinese government in light of the U.S. trade war escalation—namely, the relatively muted fiscal stimulus deployed so far—suggests that China has been maintaining dry powder to respond to the Trump administration and is confident in its ability to offset any potential impact of tariffs.
India
India continues to benefit from secular growth drivers, including favorable demographics, a growing middle class, and improved affordability. Though growth has moderated recently, it remains one of the fastest-growing economies in EMs, thanks to several tailwinds. In particular, more accommodative monetary and fiscal policy coupled with lower oil prices and a weaker U.S. dollar should fuel growth. Furthermore, India’s relatively insulated position with regard to the escalating trade war and focus on increasing manufacturing scale could prove a tailwind for growth if India’s tariffs remain low relative to the rest of the world.
Eastern Europe
Eastern Europe was already growing at a faster rate than Europe broadly, and now seems well positioned to benefit from a reacceleration of European growth stemming from increased fiscal spending—with potential upside from any future peace dividend.
Brazil
Brazil stands to gain export share in agricultural and commodity products as global buyers reduce exposure on the United States due to tariffs or geopolitical concerns. Expectations of lower interest rates after the current hiking cycle ends could also boost growth.
The Case for Non-U.S. Equities
We believe the current environment presents a compelling case for increasing exposure to non-U.S. equities.
Now that the growth differential between U.S. and non-U.S. markets has narrowed—and we believe is likely to continue narrowing—the non-U.S. equity universe offers a broad set of high-quality, attractively valued opportunities. After a 15-year stretch of U.S. equity outperformance, we may be entering a period of regime change in which non-U.S. markets take the lead.
Our quantitative signals support this view. Indicators such as Improving Profitability—which, as mentioned, tracks directional shifts in corporate profitability—are turning positive outside the United States while showing greater volatility and deterioration within the United States.
These trends, combined with a more favorable macro backdrop abroad, point to a potential inflection. Old adages about the benefits of diversification to non-U.S. equities have been challenged over the past decade. During this time, investors have not been rewarded for non-U.S. allocations—despite our quantitative insights pointing to a larger pool of high-quality growth candidates trading at attractive valuations outside the United States.
Today, a confluence of tailwinds is building for non-U.S. equity investors—chief among them, the narrowing growth differential between U.S. and non-U.S. markets. One reason diversification hasn’t paid off in recent years may be that globalization pushed correlations between U.S. and non-U.S. equities higher, diluting the benefits of non-U.S. allocation. But as deglobalization gains momentum, those correlations could decline, restoring the value of geographic diversification. At the same time, tariffs, shifting policy regimes, and broader macroeconomic realignments are compressing the growth gap and setting the stage for non- U.S. equities to reassert their relevance in global portfolios.
About William Blair
William Blair is committed to building enduring relationships with our clients. We work closely with private and public pension funds, insurance companies, endowments, foundations, and sovereign wealth funds, as well as financial advisors. We are 100% active-employee-owned with broad-based ownership. Our investment teams are solely focused on active management and employ disciplined, analytical research processes across a wide range of strategies, including U.S. equity, non-U.S. equity, and emerging markets debt. William Blair is based in Chicago with global resources providing expertise and solutions to meet our clients’ evolving needs.
Important Disclosures
This material is provided for information purposes only and is not intended as investment advice, offer, or a recommendation to buy or sell any particular security or product.
This material is not intended to substitute a professional advice on investment in financial products and any investment or strategy mentioned herein may not be appropriate for every investor. Before entering into any transaction each investor should consider the suitability of a transaction to his own situation and, the need be, obtain independent professional advice as to risks and consequences of any investment. William Blair will accept no liability for any direct or consequential loss, damages, costs or prejudices whatsoever arising from the use of this document or its contents.
Any discussion of particular topics is not meant to be complete, accurate, comprehensive, or up-to-date and may be subject to change. Data shown does not represent and is not linked to the performance or characteristics of any William Blair product or strategy. Factual information has been taken from sources we believe to be reliable, but its accuracy, completeness or interpretation cannot be guaranteed. Information and opinions expressed are those of the author and may not reflect the opinions of other investment teams within William Blair. Information is current as of the date appearing in this material only and subject to change without notice. This material may include estimates, outlooks, projections and other forward-looking statements. Due to a variety of factors, actual events may differ significantly from those presented.
Past performance is not indicative of future results. Investing involves risks, including the possible loss of principal. Equity securities may decline in value due to both real and perceived general market, economic, and industry conditions. Investing in foreign denominated and/or domiciled securities may involve heightened risk due to currency fluctuations, and economic and political risks. These risks may be enhanced in emerging markets. References to specific securities and their issuers are for illustrative purposes only and are not intended as recommendations to purchase or sell such securities. William Blair may or may not own any securities of the issuers referenced and, if such securities are owned, no representation is being made that such securities will continue to be held. It should not be assumed that any investment in the securities referenced was or will be profitable.
The MSCI ACWI ex-USA Index offers exposure to both developed and emerging markets globally, excluding the United States, and includes large- and mid-cap stocks. The MSCI ACWI IMI Index provides comprehensive global coverage by incorporating large-, mid-, and small-cap stocks across developed and emerging markets. The MSCI EAFE Index captures large- and mid-cap stocks in developed markets outside of the United States and Canada, specifically focusing on Europe, Australasia, and the Far East. The MSCI USA Index represents the performance of large- and mid-cap U.S. equities across all sectors. The Russell 3000 Index tracks the 3,000 largest publicly traded U.S. companies, representing approximately 98% of the investable U.S. equity market.
This material is distributed in the United Kingdom by William Blair International, Ltd., authorized and regulated by the Financial Conduct Authority (FCA), and is only directed at and is only made available to persons falling within articles 19, 38, 47, and 49 of the Financial Services and Markets Act of 2000 (Financial Promotion) Order 2005 (all such persons being referred to as “relevant persons”). This material is distributed in the European Economic Area (EEA) by William Blair B.V., authorized and supervised by the Dutch Authority for the Financial Markets (AFM) under license number 14006134 and also supervised by the Dutch Central Bank (DNB), registered at the Dutch Chamber of Commerce under number 82375682 and has its statutory seat in Amsterdam, the Netherlands. This material is only intended for eligible counterparties and professional clients. This document is distributed in Australia by William Blair Investment Management, LLC (“William Blair”), which is exempt from the requirement to hold an Australian financial services license under Australia’s Corporations Act 2001 (Cth). William Blair is registered as an investment advisor with the U.S. Securities and Exchange Commission (“SEC”) and regulated by the SEC under the U.S. Investment Advisers Act of 1940, which differs from Australian laws. This document is distributed only to wholesale clients as that term is defined under Australia’s Corporations Act 2001 (Cth). This material is distributed in Singapore by William Blair International (Singapore) Pte. Ltd. (Registration Number 201943312R), which is regulated by the Monetary Authority of Singapore under a Capital Markets Services License to conduct fund management activities. This material is intended only for institutional investors and may not be distributed to retail investors.
This material is not intended for distribution, publication, or use in any jurisdiction where such distribution or publication would be unlawful. This document is the property of William Blair and is not intended for distribution or dissemination, directly or indirectly, to any other persons than those to which it has been addressed exclusively for their personal use. It is being supplied to you solely for your information and may not be reproduced, modified, forwarded to any other person or published, in whole or in part, for any purpose without the prior written consent of William Blair.
Copyright ©2025 William Blair. “William Blair” refers to William Blair & Company, L.L.C., William Blair Investment Management, LLC, and affiliates. William Blair is a registered trademark of William Blair & Company, L.L.C.
4563456 (06/25)
A message from Advisor Perspectives and VettaFi: To learn more about this and other topics, check out some of our webcasts.
Membership required
Membership is now required to use this feature. To learn more:
View Membership BenefitsSponsored Content
Upcoming Virtual Events View All