Big Beautiful Bill: Debt and Deficits as Far as the Eye Can See
Membership required
Membership is now required to use this feature. To learn more:
View Membership BenefitsOBBBA: Separating fact from fiction
Signed into law the first week of July, the OBBBA extends expiring provisions from 2017’s Tax Cut and Jobs Act (TCJA), introduces a few tax proposals from the campaign trail and partially offsets the cost with spending reductions, primarily by limiting Medicaid eligibility and Inflation Reduction Act (IRA) tax credits.
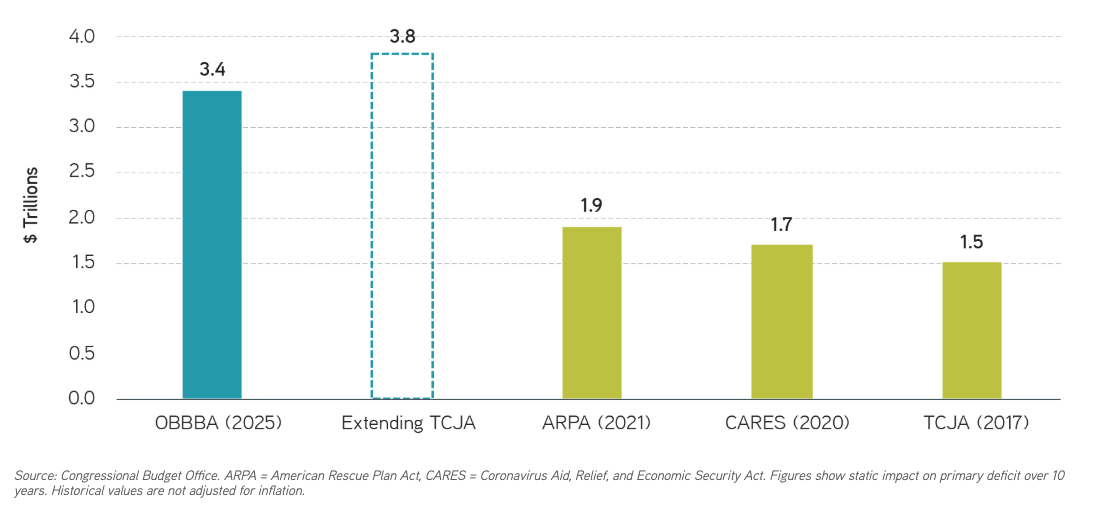
The Congressional Budget Office (CBO) scored the final version of the bill with an estimated cost of $3.4 trillion over 10 years, before including interest or dynamic growth impacts. That’s similar to the estimated cost of $3.8 trillion just to extend the TCJA provisions. Again, as with the TCJA, the OBBBA’s single largest cost is extending individual tax rates, which carry an estimated impact of $2.1 trillion over 10 years. When over half of the net cost comes from extending current individual tax rates,1 we’re skeptical of politicians claiming a significant fiscal impulse from the bill.
10 year cost of recent legislation
Where we view the legislation as having a stronger economic rationale is in provisions allowing for 100% bonus depreciation and reinstating research and development expensing. Over the past 20+ years, 50% bonus depreciation for qualified property was introduced under President Bush from 2002 to 2006 and under President Obama from 2008 to 2015. Evidence from those periods suggests that the tax benefit may boost investment, thus growing the capital base and supporting economic growth.2
In our view, some provisions from the campaign trail may make more political than economic sense. We would argue that tax policy shouldn’t be capricious—benefiting one industry, demographic or form of work over another—unless designed to incentivize behavior. No tax on tips and overtime, the tax credit on social security and interest deductibility on auto loans all appear to fail that test.
Similarly, the expanded state and local tax (SALT) cap of $40,000 benefits a narrow segment of the population with a relatively high level of income and a low marginal propensity to consume—limiting the economic effect. While these provisions are scheduled to expire within five years, the cost is still significant, and the political motivation behind them seems apparent.
To limit the net cost of the bill, Congress curbed Medicaid eligibility and energy tax credits from the Inflation Reduction Act (IRA). Repealing electric vehicle tax credits, phasing out energy investment incentives and other IRA credits are estimated to save over $500 billion. Changing Medicaid eligibility, adding new work requirements and eliminating the Affordable Care Act (ACA) premium tax credit, among other changes, provide estimated healthcare savings of approximately $900 billion.
Net of spending increases primarily for Defense and Homeland Security, government spending could decline $1.1 trillion over 10 years relative to the baseline. That would take the OBBBA cost to $3.4 trillion after $4.5 trillion in total tax cuts—but before interest, which is estimated to grow $700 billion over 10 years.
More concerning may be the procedural maneuvers that allowed the bill to make it through the Senate. The $3.8 trillion cost of extending the TCJA was included in the “current policy baseline,” effectively zeroing it out for budget reconciliation purposes. For a Congress that has shown little fiscal discipline and an inclination to enact expiring legislation to mask the long-term cost, we see this as a disappointing new threshold.
Treasury supply: Manageable in the near term
Fortunately for the Treasury supply outlook, T bills may bear the brunt of new issuance, and tariff revenues may limit incremental borrowing needs. Since the start of 2025, total Treasury debt has remained at $36.1 trillion—the level of the debt limit reinstated in January. While the Treasury has continued issuing coupon securities at regular intervals this year, the net supply of T bills has declined, with balances in the Treasury General Account dwindling to levels that would sustain spending needs for only one or two months.
In addition to changes in tax and spending, the OBBBA raised the debt limit by $5 trillion. Given issuance trends this year, new supply in the near term could be skewed toward short duration T bills—potentially limiting the short-run impact to interest rates.
Depending on where tariff rates ultimately land, the net change in borrowing needs in 2026 may not even require an increase in coupon supply from current levels. While the OBBBA’s primary deficit impact of $3.4 trillion over 10 years is front loaded, thanks to expiring provisions, tariff revenues continue to increase monthly, with net customs receipts topping $26 billion in June—up from $7 billion at the start of the year. In June, the CBO estimated that tariffs in place could reduce primary deficits by $2.5 trillion over 10 years.3
The bottom line
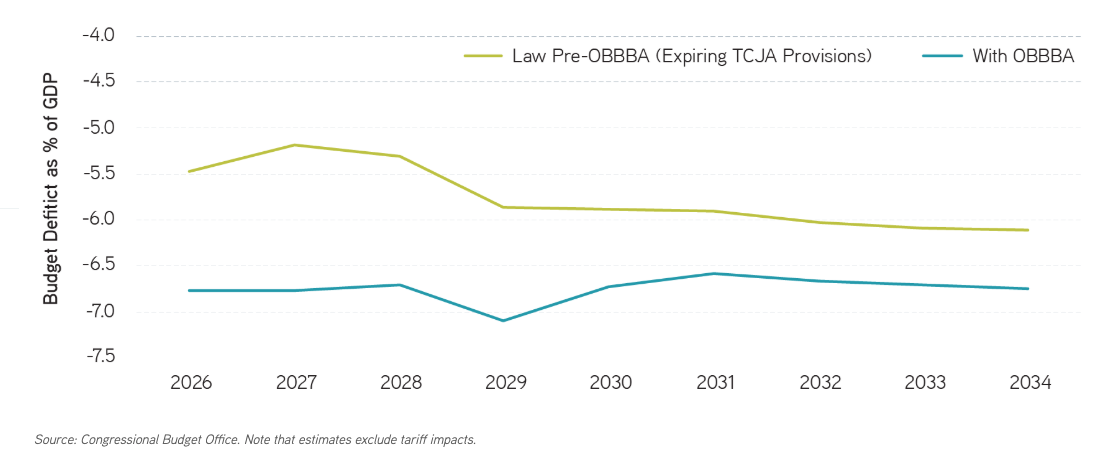
While that may seem well and good, the anticipated net fiscal change is relative to an estimated 6.2% budget deficit in 2025. If the OBBBA hadn’t happened, and all expiring provisions in TCJA had been permitted to expire, budget deficits would still have averaged close to 6% annually over the next 10 years—taking government debt to GDP to levels near 120%, according to the CBO.4
Deficit projections

The OBBBA may have been a political win for the majority party, but in our view, Congress missed a once-in-a-decade opportunity to alter our fiscal trajectory—instead leaving those challenges for the next generation.
1 Congressional Budget Office. Information Concerning the Budgetary Effects of H.R. 1, as Passed by the Senate on July 1, 2025.
2 Congressional Research Service. Section 179 and Section 168(k) Expensing Allowances: Current Law, Economic Effects, and Selected Policy Issues, February 2024.
3 Congressional Budget Office. Budgetary and Economic Effects of Increases in Tariffs Implemented Between January 6 and May 13, 2025.
4 Congressional Budget Office. 10 Year Budget Forecast, January 2025.
A message from Advisor Perspectives and VettaFi: To learn more about this and other topics, check out some of our webcasts.
The views expressed in these posts are those of the authors and are current only through the date stated. These views are subject to change at any time based upon market or other conditions, and Parametric and its affiliates disclaim any responsibility to update such views. These views may not be relied upon as investment advice and, because investment decisions for Parametric are based on many factors, may not be relied upon as an indication of trading intent on behalf of any Parametric strategy. The discussion herein is general in nature and is provided for informational purposes only. There is no guarantee as to its accuracy or completeness. Past performance is no guarantee of future results. All investments are subject to the risk of loss. Prospective investors should consult with a tax or legal advisor before making any investment decision. Please refer to the Disclosure page on our website for important information about investments and risks.
08.11.2026 | RO 4724388
Investment advisory services offered through Parametric Portfolio Associates LLC ("Parametric"), an investment advisor registered with the US Securities and Exchange Commission (CRD #114310). Parametric is also registered as a portfolio manager with the securities regulatory authorities in certain provinces of Canada (National Registration Database No. 42850) with regard to specific products and strategies. Parametric provides advisory services directly to institutional investors and indirectly to individual investors through financial intermediaries. The information on this website does not constitute an offer to sell, or a solicitation of an offer to purchase, securities in any jurisdiction to any person to whom it is not lawful to make such an offer. Investing entails risks, and there can be no assurance that Parametric (and its affiliates) will achieve profits or avoid incurring losses. All investments are subject to potential loss of principal. Parametric does not provide tax or legal advice. Prospective investors should consult with a tax or legal advisor before making any investment decision. Please refer to the disclosure page for important information about investments and risks.
S&P Dow Jones Indices are a product of S&P Dow Jones Indices LLC (“S&P DJI”) and have been licensed for use. S&P® indexes are registered trademarks of S&P DJI; Dow Jones® is a registered trademark of Dow Jones Trademark Holdings LLC (“Dow Jones”); S&P DJI, Dow Jones, and their respective affiliates do not sponsor, endorse, sell, or promote Parametric and its strategies, will not have any liability with respect thereto, and do not have any liability for any errors, omissions, or interruptions of the S&P Dow Jones Indices.
©2025 Parametric Portfolio Associates LLC. All rights reserved. 800 Fifth Avenue, Suite 2800, Seattle, WA 98104.
NOT FDIC INSURED. OFFER NOT A BANK GUARANTEE. MAY LOSE VALUE. NOT INSURED BY ANY FEDERAL GOVERNMENT AGENCY. NOT A DEPOSIT.
Membership required
Membership is now required to use this feature. To learn more:
View Membership BenefitsSponsored Content
Upcoming Virtual Events View All


