The Bubble Term
Membership required
Membership is now required to use this feature. To learn more:
View Membership Benefits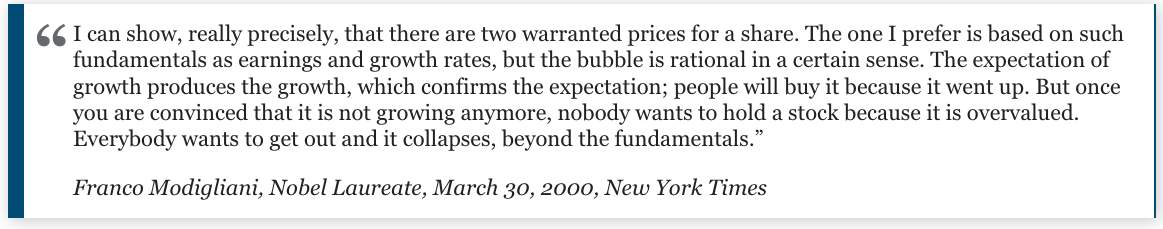
Across more than four decades of navigating market cycles, sharing weekly or monthly market commentaries the entire time, I’ve had multiple opportunities to write about speculative bubbles and their subsequent collapse, in real time.
Neither the market collapse that followed the peak of the tech bubble in 2000, nor the crisis that followed the mortgage bubble in 2007, were particularly unusual in terms of the losses that followed those extremes. The notable thing, from the standpoint of our investment discipline, is that both were obedient. History has rarely afforded bubbles a life span of more than a decade, and neither the tech bubble nor the mortgage bubble that followed it were exceptions. People who dismiss everything I say with “permabear” don’t seem to realize that the reputation earned by navigating decades of full cycles well – prior to the current bubble – is the reason investors know my name in the first place.
In that context, it’s nice that despite maintaining a clearly negative market outlook here, our discipline is behaving as intended. Even amid an advance in the S&P 500, we’ve done just fine since we adopted our September 2024 hedging implementation. We’ve had regular opportunities to vary the intensity of our investment stance even amid the most extreme market conditions, leaving us much less reliant on market direction. For more on that hedging implementation, see Asking a Better Question, Subsets and Sensibility, and the section titled “The Martian” in The Turtle and the Pendulum.
We do prefer a certain amount of market fluctuation to a diagonal advance in a hypervalued bubble, as we’ve seen in recent months. Yet even as I discuss what I view as the third great speculative bubble in U.S. history – beyond both 1929 and 2000 – it’s important to recognize that nothing in our investment discipline relies on a market collapse, a reversion to historically normal valuations, an erosion of profit margins, a narrowing of fiscal deficits, an end to reckless Fed interventions, or even any particular forecast or scenario. I absolutely expect this bubble to end in tears. But if it doesn’t: We. Don’t. Care. Because nothing in our discipline forces us to care.
A bubble is a mathematical object

The word “bubble” gets tossed around quite a bit. Usually, it comes in the form of verbal arguments about whether prices have advanced to a point that’s “too high” in some sense.
We can do much better than that. A bubble is a mathematical object.
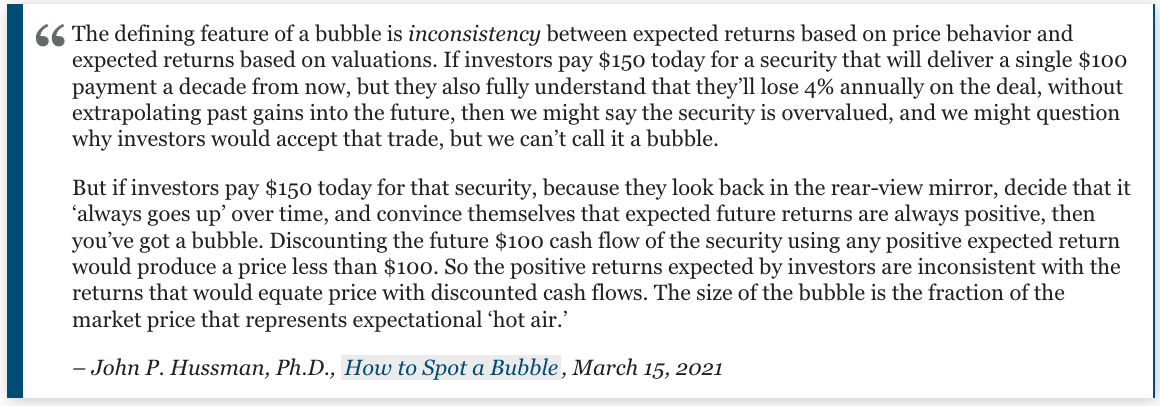
As I’ve observed before, bubbles are generated when investors drive valuations higher without simultaneously adjusting their expectations for future returns lower. That is, investors extrapolate past returns based on price behavior, even though the resulting expectations about future returns are inconsistent with the returns that would equate price with discounted cash flows.
Suppose you buy a stock and hold it for one year, expecting to earn some return, call it k%. Over the year, you also receive a “cash flow” – in this case a dividend, or buyout proceeds, or whatever the security throws off, and the price is of course reduced by that amount on the date the stock goes ex-dividend.
In your head, you expect the price to obey an equation that looks something like:
Price = (1+k) x Last Price – Cash Flow
But here’s the thing. Mathy people may recognize that the solution to an equation like this actually has two pieces. One is called a “particular solution,” and in this case, we can write it as a “fundamental value”:
F = All future cash flows, discounted to present value at the expected long-term return k
The other part is what’s called a “homogeneous solution,” and we can write it as a “bubble term” that looks something like:
B = (1+k) Last B
So what we actually get is:
Price = Fundamental Value + Bubble Term
That’s what Modigliani meant when he wrote “I can show, really precisely, that there are two warranted prices for a share.”
Now, economists typically assume that investors are wise enough to rule out infinite bubbles (technically, called a “transversality condition”). When investors fail to do that, bad things happen. At the March 2000 peak, Modigliani’s mathy discussion beautifully foreshadowed what was about to happen in the real world: “once you are convinced that it is not growing anymore, nobody wants to hold a stock because it is overvalued. Everybody wants to get out and it collapses, beyond the fundamentals.” That, in a nutshell, is how the Nasdaq 100 could go on to lose 83% of its value by October 2002.
See, the problem is this. Unless the Bubble Term is able to become exponentially larger forever – it shows up as a growing gap between the long-term return that investors expect in their heads, and the long-term return that investors can actually expect based on the future cash flows that will ultimately be delivered into their hands.
In my April 2000 discussion of this problem, I wrote, “The only question is how long it takes for the gap between price and fundamentals to become intolerably wide. As we’ve seen, it can take a long time. But once the bubble psychology breaks, that gap can close with sickeningly great speed. As we noted last month, the plunge in the Nasdaq may be muted from 83% to just 65% or so, given several years for revenues to catch up.”
As it turned out, the tech-heavy Nasdaq 100 went on to lose an implausibly precise 83% by October 2002.
Gauging the Bubble Term
The chart below shows our most reliable gauge of market valuations in data since 1928: the ratio of nonfinancial market capitalization to gross value-added (MarketCap/GVA). Gross value-added is the sum of corporate revenues generated incrementally at each stage of production, so MarketCap/GVA might be reasonably be viewed as an economy-wide, apples-to-apples price/revenue multiple for U.S. nonfinancial corporations.
The current level of valuations is the highest in U.S. history, easily exceeding both the 1929 and 2000 extremes. While the S&P 500 has advanced just over 5% since February, when the previous record was set, we’ve done just fine. Again, we definitely prefer market fluctuation to a diagonal, hypervalued advance, but nothing in our discipline relies on a collapse.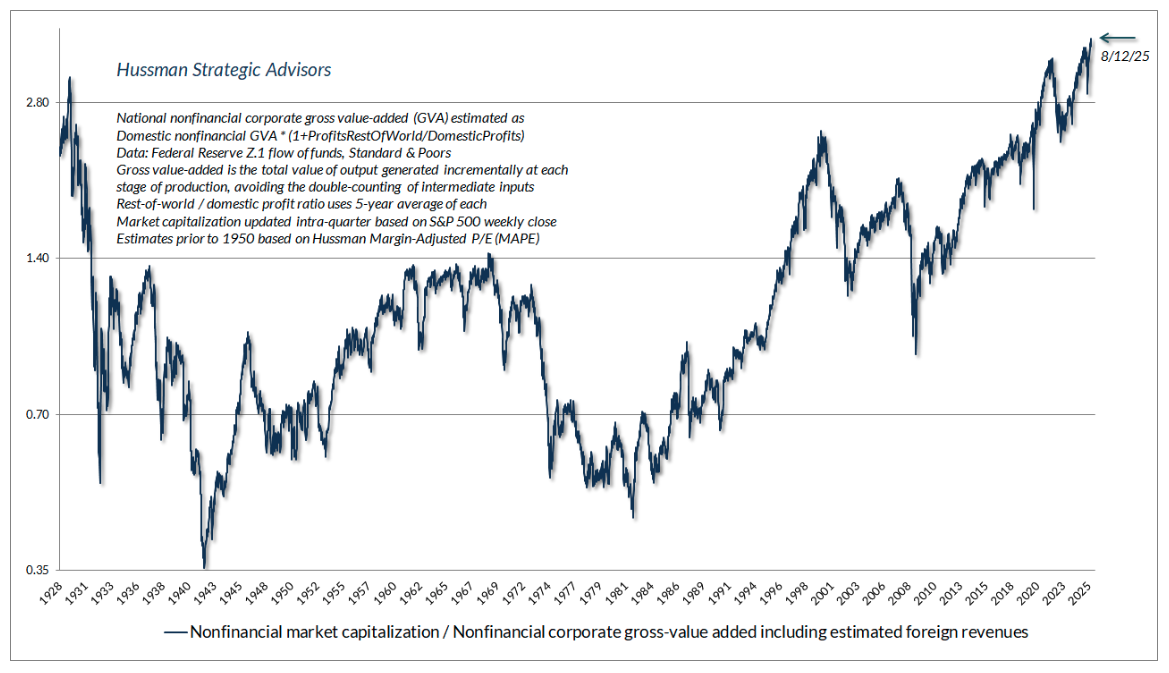
Now, one might argue that profit margins are at record highs, and that we’re now in a “new era” economy where these elevated profit margins will be permanent. In the next section, I’ll discuss why that argument may not be wise, but for true believers, it’s enough to note that even if we assume that current record profit margins are permanent, valuations still rival the most extreme levels in history.
You can see this in the chart below. The red line shows the ratio of the S&P 500 to analyst estimates of year-ahead “forward operating earnings.” This “forward P/E” is often preferred by Wall Street because it ignores bad stuff like “nonrecurring” losses and isn’t even defined under Generally Accepted Accounting Principles (GAAP), and because it only came into use in the 1980’s, there’s no history for forward operating earnings before that time.
Fortunately, it turns out that we can easily proxy the S&P 500 forward P/E with the Shiller cyclically-adjusted P/E (CAPE). The relationship isn’t one-to-one, since the forward multiple is generally far lower than the CAPE, which is based on trailing 10-year earnings. But the current level of the CAPE does capture the elevated profit margins of the past decade. So if you believe that profit margins will remain at record levels forever, this is the valuation measure that you may want to use. That’s fine. We don’t rely on this choice either.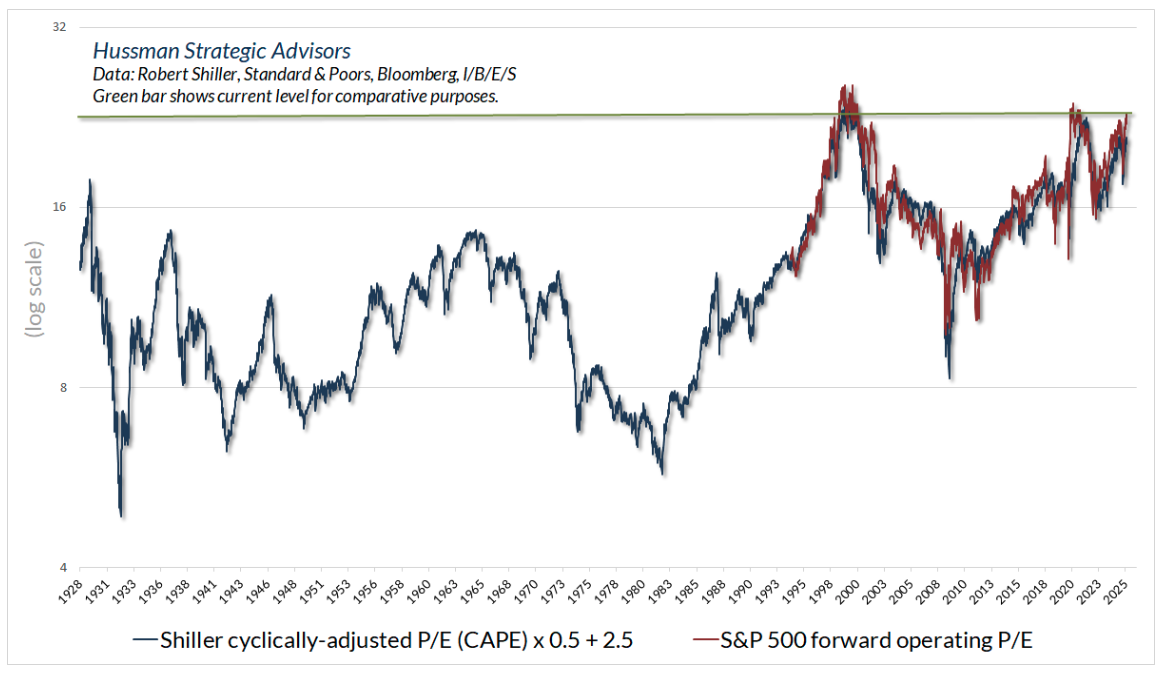
As for GAAP earnings, the S&P 500 currently trades at 29 times record trailing earnings. At the 2000 peak, that multiple reached 32. So again, extreme valuations aren’t an artifact of using any single measure. Some are more reliable than others, because their denominators tend to be more representative of subsequent cash flows (which is why we prefer MarketCap/GVA), but even if one assumes that current extreme profit margins will be permanent, the current situation rivals the most hypervalued extremes in history.
A reliable valuation gauge is nothing but shorthand for a proper discounted cash flow analysis. As I’ve detailed across decades of market commentaries, the valuation gauges we use are faithful to that requirement. So, valuations offer beautiful intuition about the growing gap between the future returns in investors heads, and the future returns that one would project based on discounted cash flows.
What returns do investors have in their heads here? Based on the 2025 Natixis Survey of investors with more than $100,000 in assets, investors expect returns of “10.7% above inflation over the long term.” And while financial advisers suggest that investors should temper their expectations about after-inflation returns, these same advisers “suggest that a more attainable target would be around 8.3%.” That’s even more disturbing than the returns that investors expect. Assuming a 2% inflation rate, it means that even financial advisers, who presumably should know better, are assuming normal, average, historically run-of-the-mill future returns of just over 10% annually, despite the highest valuations in history. They aren’t making any adjustment at all.
Now recall how a speculative bubble works: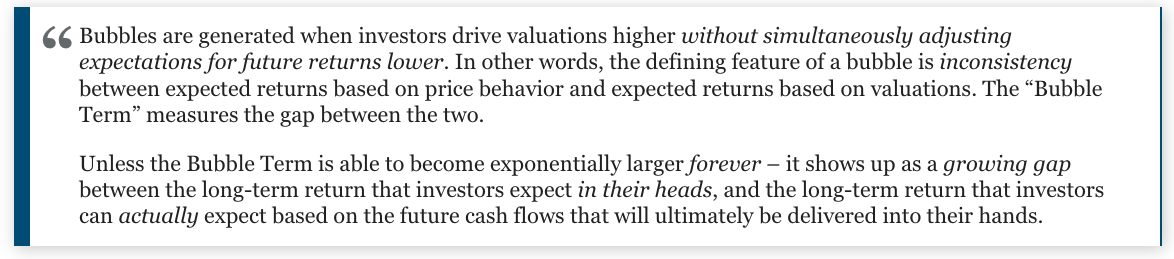
The chart below shows precisely what this looks like in real-world data. The blue line chart below shows the estimated 12-year S&P 500 total return that we project based on our most reliable valuation gauge – MarketCap/GVA. We get somewhat less extreme loss projections from less reliable measures, but the overall profile is much the same. The red line shows actual subsequent 12-year S&P 500 average annual nominal returns across a century of market cycles.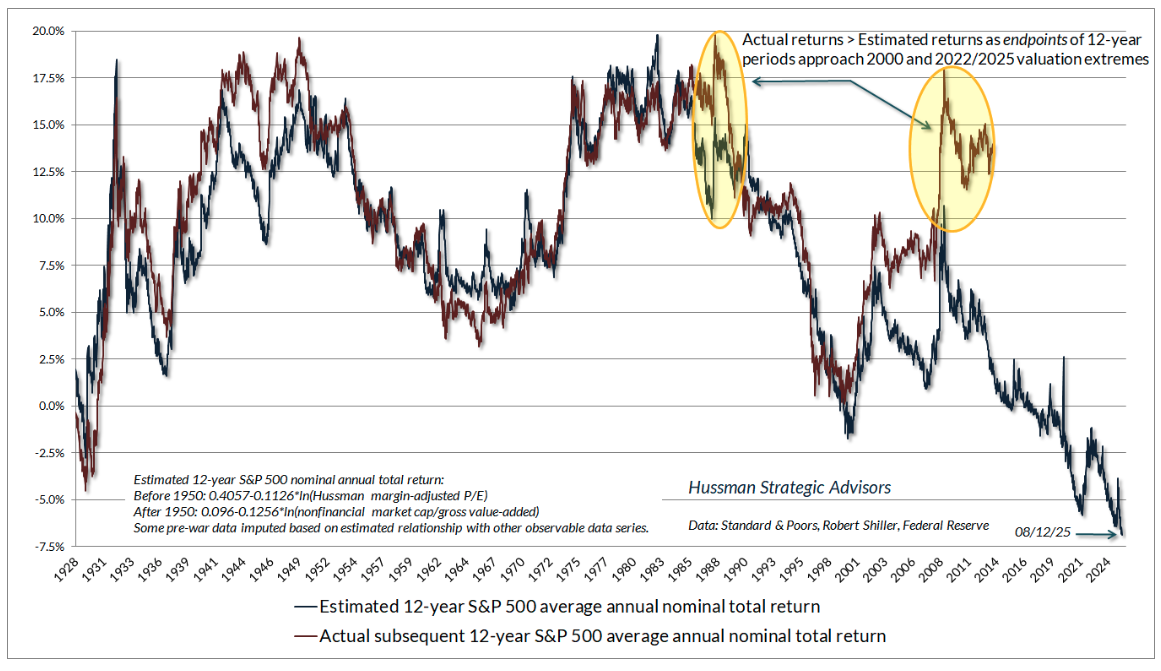
Notice, as usual that anytime the end of the 12-year horizon ends at bubble valuations (as the 1998-2000 horizon did, and recent 12-year horizons have), actual returns over those periods will be substantially above the returns that one would have estimated at the beginning of those horizons.
That’s just arithmetic. The actual total return of the S&P 500 for any given holding period has three pieces: the annual growth in fundamentals F, the annualized change in valuations (Price/F) during the holding period, and the average dividend yield during that period.
Over the past 10, 20 and 30 years, nominal GDP, S&P 500 revenues, and corporate gross value added have grown by only about 4.5% annually. Suppose that growth continues. The current S&P 500 dividend yield is only about 1.2%. So if valuations can remain at current extremes forever, the expected return arithmetic says 4.5% + 1.2% = 5.7% nominal.
If valuations decline to some lower level, the effect is to reduce expected returns by (future V / current V)^(1/T)-1 where T is the number of years. For example, a decline in MarketCap/GVA from the current extreme of 3.7 to a level no lower than the 2000 peak of 2.5, would lower 10-year total returns by (2.5/3.7)^(1/10)-1 = -3.8%. The resulting 10-year nominal total return estimate then becomes 5.7%-3.8% = 1.9% annually, and even less if inflation is positive. That’s not a theory, it’s just arithmetic. The only issue is whether investors assume the bubble will be permanent.
What’s taken so long?
There are two factors that have conspired to extend this bubble even beyond those that ended in 1929 and 2000. They’ve gone hand in hand, in to some extent have been self-reinforcing.
First, it’s clear that years of zero-interest policy from the Federal Reserve fueled psychology among investors that “there is no alternative” (TINA) but to speculate. As the Fed took interest-bearing Treasury securities out of the market and onto its own balance sheet, it replaced those securities with zero-interest Fed liabilities (currency, bank reserves, and funds on reverse-repo) that someone had to hold at every moment in time. Since 1950, the amount of Fed liabilities had never exceeded 10% of GDP. From 2008 to 2022, the Fed took that percentage from just under 6% of GDP to a wild-eyed, deranged 32% of GDP by early 2022. The Fed has gradually tapered that back to about 22% today.
Someone in the economy is holding those Fed liabilities (mainly banks and money market funds), though at the moment the Fed is paying 4.4% on them rather than zero. This is the stuff that talking heads on TV call “cash on the sidelines,” imagining that at any moment, some buyer will somehow put it “into” the stock market without a seller taking it right back “out.” They believe this because nobody has explained to them how equilibrium works. That “cash” will, and must, continue to be held by someone, as cash, until and unless the Fed retires it by shrinking its balance sheet, at which time investors, in aggregate, will hold Treasury securities instead.
So one of the factors that extended this particular bubble was zero-interest policy. It did two things. First, it encouraged investors to drive stock prices higher (implicitly driving future long-term stock market returns lower, to levels better aligned with the near-zero returns on bonds). But given that the total debt of U.S. nonfinancial corporations is nearly the size of their annual revenues (we prefer gross-value added), every 1% drop in corporate interest rates reduced debt servicing costs, and propped up profit margins by that same 1%. Moreover, corporations were able to refinance that debt at the interest rate lows of 2020 and 2021, which is only now just beginning to be refinanced at higher rates.
So zero-interest rate policies boosted both corporate profits, and the multiples that investors were willing to pay for those profits.
Now look at fiscal policy. As I’ve noted before – equilibrium again – anytime one sector runs a deficit (consumption and net investment over-and-above income), some other sector must run a surplus (income over-and-above consumption and net investment). That’s not a theory. It’s just an accounting identity. That accounting identity has played out in real time in ways that investors don’t seem to fully recognize.
Specifically, as government deficits exploded in recent years – particularly resulting from a combination of tax cuts and pandemic spending – corporate free cash flows also exploded. They had to. This wasn’t because of some new-era productivity boom. It was because of equilibrium. It’s just an accounting identity. But it creates a situation where perpetually extreme corporate earnings now rely on perpetually extreme government deficits. They are mirror images of each other.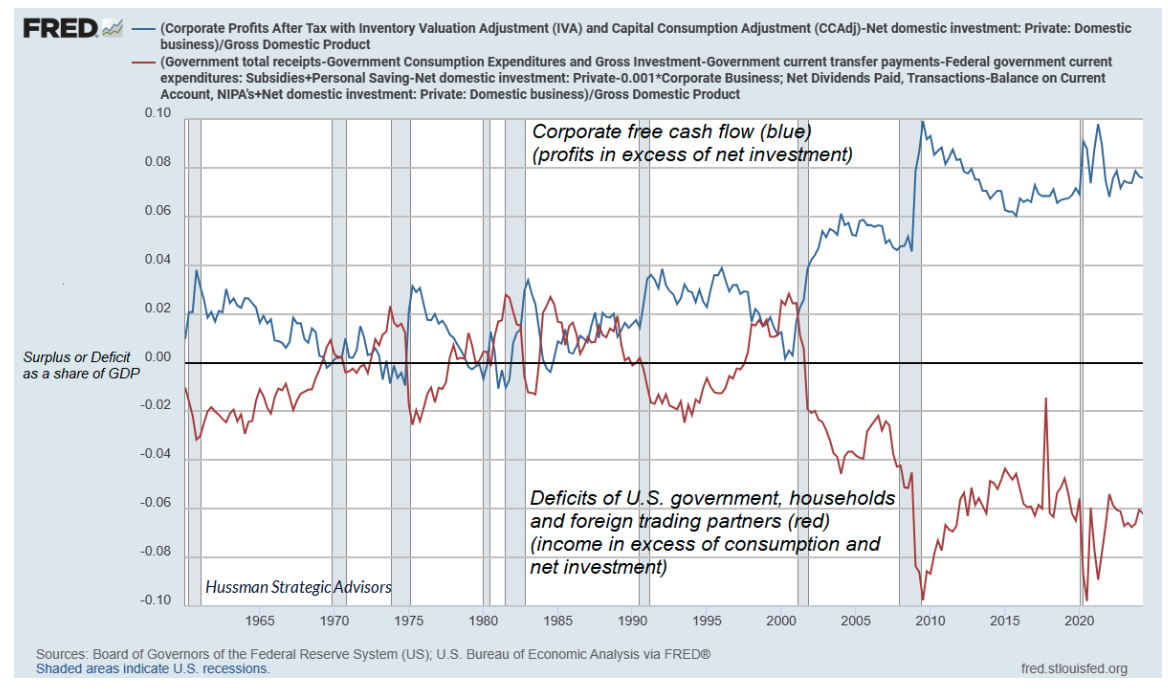
Put simply, investors now rely on an ever-expanding Bubble Term that was driven by “free money” monetary and fiscal policies that will not only have to persist – but will have to expand without limit in order to keep up with that Bubble Term.
It’s important to constantly emphasize that nothing in our discipline requires a market collapse, mean-reversion in valuations, a retreat in profit margins, or an end to deranged monetary interventions or fiscal free-for-alls. Our discipline is to align our investment stance in response to measurable, observable market conditions – primarily valuations and market internals – as they change over time. Our September 2024 hedging implementation added a fresh degree of freedom, allowing us to vary our investment stance even amid the most extreme market conditions. We do benefit from market fluctuation, but in my view, little beyond that is necessary. No forecasts or scenarios are required.
Still, from the standpoint of valuations, a century of market history, the economics of equilibrium, and just plain arithmetic, my own take is simple: I expect this bubble to end in tears.
Thank you for your interest in the Hussman Funds.
A message from Advisor Perspectives and VettaFi: To learn more about this and other topics, check out some of our webcasts.
The foregoing comments represent the general investment analysis and economic views of the Advisor, and are provided solely for the purpose of information, instruction and discourse.
Prospectuses for the Hussman Strategic Market Cycle Fund, the Hussman Strategic Total Return Fund, and the Hussman Strategic Allocation Fund, as well as Fund reports and other information, are available by clicking Prospectus & Reports under “The Funds” menu button on any page of this website.
The S&P 500 Index is a commonly recognized, capitalization-weighted index of 500 widely-held equity securities, designed to measure broad U.S. equity performance. The Bloomberg U.S. Aggregate Bond Index is made up of the Bloomberg U.S. Government/Corporate Bond Index, Mortgage-Backed Securities Index, and Asset-Backed Securities Index, including securities that are of investment grade quality or better, have at least one year to maturity, and have an outstanding par value of at least $100 million. The Bloomberg US EQ:FI 60:40 Index is designed to measure cross-asset market performance in the U.S. The index rebalances monthly to 60% equities and 40% fixed income. The equity and fixed income allocation is represented by Bloomberg U.S. Large Cap Index and Bloomberg U.S. Aggregate Index. You cannot invest directly in an index.
Estimates of prospective return and risk for equities, bonds, and other financial markets are forward-looking statements based the analysis and reasonable beliefs of Hussman Strategic Advisors. They are not a guarantee of future performance, and are not indicative of the prospective returns of any of the Hussman Funds. Actual returns may differ substantially from the estimates provided. Estimates of prospective long-term returns for the S&P 500 reflect our standard valuation methodology, focusing on the relationship between current market prices and earnings, dividends and other fundamentals, adjusted for variability over the economic cycle. Further details relating to MarketCap/GVA (the ratio of nonfinancial market capitalization to gross-value added, including estimated foreign revenues) and our Margin-Adjusted P/E (MAPE) can be found in the Market Comment Archive under the Knowledge Center tab of this website. MarketCap/GVA: Hussman 05/18/15. MAPE: Hussman 05/05/14, Hussman 09/04/17.
Performance data quoted represents past performance. Past performance does not guarantee future results. Investment return and principal value of an investment will fluctuate so that an investor's shares, when redeemed, may be worth more or less than their original cost. Current performance may be lower or higher than performance data quoted. More current performance data through the most recent month-end are available at the Fund's website www.hussmanfunds.com or by calling 1-800-487-7626.
Investors should consider the investment objectives, risks, and charges and expenses of the Funds carefully before investing. For this and other information, please obtain a Prospectus and read it carefully.
The Hussman Funds have the ability to vary their exposure to market fluctuations depending on overall market conditions, and they may not track movements in the overall stock and bond markets, particularly over the short-term. While the intent of this strategy is long-term capital appreciation, total return, and protection of capital, the investment return and principal value of each Fund may fluctuate or deviate from overall market returns to a greater degree than other funds that do not employ these strategies. For example, if a Fund has taken a defensive posture and the market advances, the return to investors will be lower than if the portfolio had not been defensive. Alternatively, if a Fund has taken an aggressive posture, a market decline will magnify the Fund’s investment losses. The Distributor of the Hussman Funds is Ultimus Fund Distributors, LLC., 225 Pictoria Drive, Suite 450, Cincinnati, OH, 45246.
The Hussman Strategic Market Cycle Fund has the ability to hedge market risk by selling short major market indices in an amount up to, but not exceeding, the value of its stock holdings. However, the Fund may experience a loss even when the entire value of its stock portfolio is hedged if the returns of the stocks held by the Fund do not exceed the returns of the securities and financial instruments used to hedge, or if the exercise prices of the Fund's call and put options differ, so that the combined loss on these options during a market advance exceeds the gain on the underlying index. The Fund also has the ability to leverage the amount of stock it controls to as much as 1 1/2 times the value of net assets, by investing a limited percentage of assets in call options.
The Hussman Strategic Allocation Fund invests primarily in common stocks, bonds, and cash equivalents (such as U.S. Treasury bills and shares of money market mutual funds, aligning its allocations to these asset classes based on prevailing valuations and estimated expected returns in these markets. The investment strategy adds emphasis on risk-management to adjust the Fund’s exposure in market conditions that suggest risk-aversion or speculation among market participants. The Fund may use options and futures on stock indices and Treasury bonds to adjust its relative investment exposures to the stock and bond markets, or to reduce the exposure of the Fund’s portfolio to the impact of general market fluctuations when market conditions are unfavorable in the view of the investment adviser.
The Hussman Strategic Total Return Fund has the ability to hedge the interest rate risk of its portfolio in an amount up to, but not exceeding, the value of its fixed income holdings. The Fund also has the ability to increase the interest rate exposure of its portfolio through limited purchases of Treasury zero-coupon securities and STRIPS. The Fund may also invest up to 30% of assets in alternatives to the U.S. fixed income market, including foreign government bonds, utility stocks, convertible bonds, real-estate investment trusts, and precious metals shares.
The Prospectus of each Fund contains further information on investment objectives, strategies, risks and expenses. Please read the Prospectus carefully before investing.
The Market Climate is not a formula but a method of analysis. The term "Market Climate" and the graphics used to represent it are service marks of Hussman Strategic Advisors (formerly known as Hussman Econometrics Advisors). The Fund Manager has sole discretion in the measurement and interpretation of market conditions. Information relating to the investment strategy of each Fund is described in its Prospectus and Statement of Additional Information. A schedule of investment positions for each Fund is presented in the annual and semi-annual reports. Except for articles specifically citing investment positions held by the Funds, general market commentary does not necessarily reflect the investment position of the Funds.
Membership required
Membership is now required to use this feature. To learn more:
View Membership Benefits