Key Takeaways
- Following July’s softer jobs report, markets now widely anticipate a September Fed rate cut, with additional easing priced in through 2026.
- Despite losing their inversion, the 3-month/10-year and 2-year/10-year Treasury yield curves remain historically flat, reflecting the Fed’s inaction amid shifting expectations.
- With short-term yields poised to fall faster than long-term rates, investors should prepare for a likely steepening of the yield curve when the Fed resumes cutting rates.
Following the softer-than-expected July jobs report, the money and bond markets have fully embraced the narrative that a Fed rate cut will be coming at the September FOMC meeting. On top of that, additional rate cuts are also being priced in for the rest of this year and for 2026. As far as the market is concerned, it is now not a question of “if” but “when” the Fed cuts rates again. Against this potential monetary policy backdrop, I’ve been asked questions about my thoughts on the Treasury (UST) yield curve and where it may be headed in the months ahead.
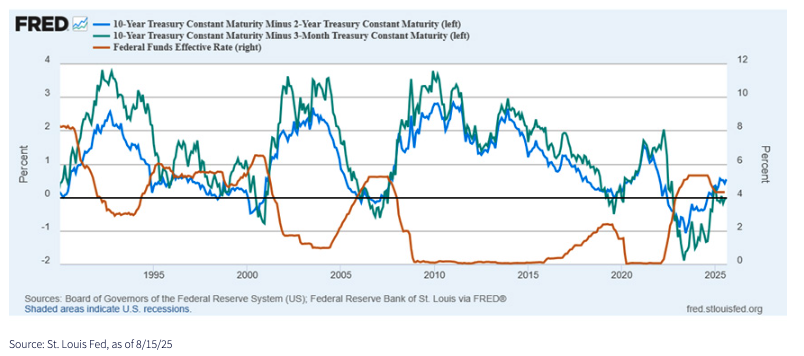
First up, it is important to point out that there are a variety of different yield curves one could follow. However, in bond-land, the two constructs that tend to be the most widely scrutinized are the 3-month/10-year and 2-year/10-year curves. Since the UST 3-Month t-bill yield essentially trades on “top” of the Fed Funds Rate, for the most part, one could use the 3mo/10yr curve as a proxy for the differential for overnight money versus the UST 10-Year yield.

As of this writing, both of the aforementioned yield constructs are no longer inverted. However, they remain historically flat at +9 basis points (bps) and +56 bps, respectively. Interestingly, the 3mo/10yr curve has actually flattened year-to-date, and has at times gone back into negative territory, while the 2yr/10yr curve has steepened by about 25 bps. This is a function not only of changing market expectations for Fed rate cuts, but more importantly, is due to the fact that the policy makers haven’t actually lowered rates this year. Remember, the UST 3-month t-bill is directly correlated to the actual Fed Funds Rate, while the UST 2-Year yield is also impacted by market expectations for where Fed Funds may be going in the months ahead.
The graph above highlights an unmistakable trend…the Treasury yield curves outlined in this blog post have steepened, at one point or another, during each Fed rate cut cycle over the last 35 years. Upon further review, this should not come as a surprise. It really is just math, if you think about it. A declining Fed Funds Rate from Fed rate cuts pushes ultra-short- and short-term UST yields lower than what transpires at the back-end of the curve, namely UST 10-Year yields. In fact, you can even have what is known as a “bull steepener” where both short- and long-term yields fall, but the decline at the front-end of the curve is more than what transpires in longer-dated maturities.
Conclusion
In my opinion, the expected resumption of the current rate cut cycle should follow historical trends, resulting in steeper yield curves for both the 3mo/10yr and 2yr/10yr constructs. For this go-round, our base case is for the U.S. economy to avoid an outright recession, but it will only produce a slow growth setting. In addition, inflation is expected to remain above the Fed’s preferred 2% target. In this scenario, short-term rates will move lower right along with Fed Funds, but the UST 10-Year yield could be trapped in a 4%–4.75% trading range.
A message from Advisor Perspectives and VettaFi: To learn more about this and other topics, check out some of our webcasts.
U.S. investors only: Click here to obtain a WisdomTree ETF prospectus which contains investment objectives, risks, charges, expenses, and other information; read and consider carefully before investing.
There are risks involved with investing, including possible loss of principal. Foreign investing involves currency, political and economic risk. Funds focusing on a single country, sector and/or funds that emphasize investments in smaller companies may experience greater price volatility. Investments in emerging markets, currency, fixed income and alternative investments include additional risks. Please see prospectus for discussion of risks.
Past performance is not indicative of future results. This material contains the opinions of the author, which are subject to change, and should not to be considered or interpreted as a recommendation to participate in any particular trading strategy, or deemed to be an offer or sale of any investment product and it should not be relied on as such. There is no guarantee that any strategies discussed will work under all market conditions. This material represents an assessment of the market environment at a specific time and is not intended to be a forecast of future events or a guarantee of future results. This material should not be relied upon as research or investment advice regarding any security in particular. The user of this information assumes the entire risk of any use made of the information provided herein. Neither WisdomTree nor its affiliates, nor Foreside Fund Services, LLC, or its affiliates provide tax or legal advice. Investors seeking tax or legal advice should consult their tax or legal advisor. Unless expressly stated otherwise the opinions, interpretations or findings expressed herein do not necessarily represent the views of WisdomTree or any of its affiliates.
The MSCI information may only be used for your internal use, may not be reproduced or re-disseminated in any form and may not be used as a basis for or component of any financial instruments or products or indexes. None of the MSCI information is intended to constitute investment advice or a recommendation to make (or refrain from making) any kind of investment decision and may not be relied on as such. Historical data and analysis should not be taken as an indication or guarantee of any future performance analysis, forecast or prediction. The MSCI information is provided on an “as is” basis and the user of this information assumes the entire risk of any use made of this information. MSCI, each of its affiliates and each entity involved in compiling, computing or creating any MSCI information (collectively, the “MSCI Parties”) expressly disclaims all warranties. With respect to this information, in no event shall any MSCI Party have any liability for any direct, indirect, special, incidental, punitive, consequential (including loss profits) or any other damages (www.msci.com)
© WisdomTree, Inc.
Read more commentaries by WisdomTree, Inc.