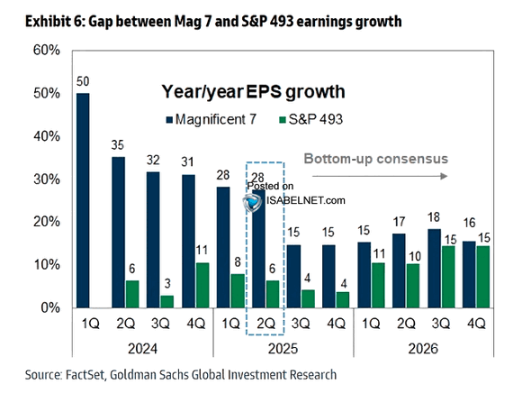
Lately, there’s been a growing sense of confidence among investors that the U.S. economy has dodged the proverbial bullet. Despite a historic rate-hiking cycle by the Federal Reserve, two years of stubborn inflation, and signs of strain in global trade, the dominant Wall Street narrative is now a curious mix of “soft landing,” “no landing,” and even “re-acceleration.” For example, look at forward earnings estimates for the companies most susceptible to economic growth: small and mid-capitalization stocks. Over the last two years, earnings growth was meager when the economy was “booming” due to massive fiscal and monetary stimulus flows. However, as we head into 2026, Wall Street expects corporate earnings to increase sharply, which can only occur if the economy reaccelerates.

While the market is betting on an economic revival to support current valuation levels, the real economy is suggesting things are slowing down. Notably, the evidence isn’t coming from obscure corners. It’s showing up in the indicators designed to give us a heads-up before a storm arrives.
Unlike data points like GDP or headline payroll numbers that lag, indicators that lead economic changes are meant to flag when momentum is shifting. Historically, these indicators have done an excellent job of predicting economic changes from growth to slowdowns. However, after 2020, with the massive stimulus interventions, the leading indicators have been “missing in action.” Because of that, very few people are paying attention to what these indicators are warning about, and the current optimism feels eerily similar to the late stages of every economic cycle. When markets are up, investors ignore risk, and consider fundamentals irrelevant. But if you know where to look, the warnings are there, and you must be willing to step outside the bullish echo chamber.
There’s a familiar rhythm to economic slowdowns, and we’re hearing it again: first, the data softens quietly; then the revisions come in negative; credit starts tightening; consumer behavior grows cautious; and eventually, the labor market breaks. When everyone finally admits what’s happening, markets have already priced in the damage. That’s why it’s critical to understand what the signals are saying now and not after the fact.
So, let’s take a closer look at the economic dashboard. From my perspective, the economy is not accelerating but slowing down.
Economic Signals
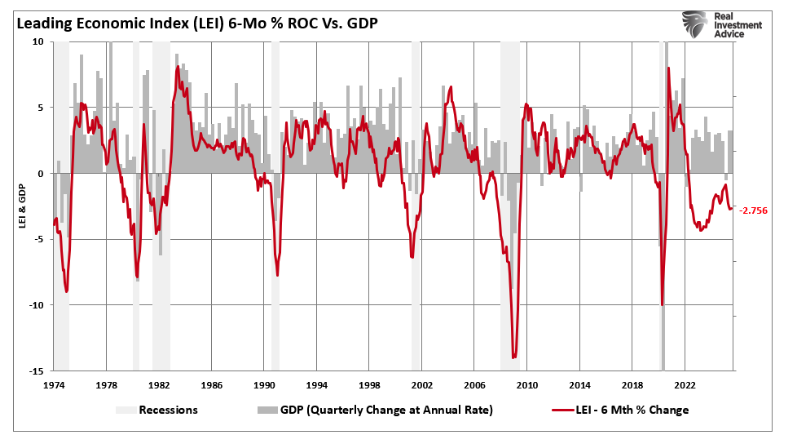
The clearest sign of economic deceleration is the Conference Board’s Leading Economic Index (LEI), which has declined for 17 consecutive months. That’s not a rounding error; that’s the longest losing streak since the 2008 financial crisis. The LEI includes forward-looking components like new orders, jobless claims, building permits, and consumer expectations. Historically, when the index falls this far for this long, a recession isn’t a matter of “if,” but “when.” Even the Conference Board has publicly projected a contraction in late 2024 or early 2025, but that didn’t happen because of all the fiscal stimulus circulating through the economy. However, that stimulus has ended. The LEI has turned lower again, signaling a pickup in economic weakness. While the market largely ignores this flashing red light because the S&P keeps rising, it is a dangerous divergence that investors should consider.
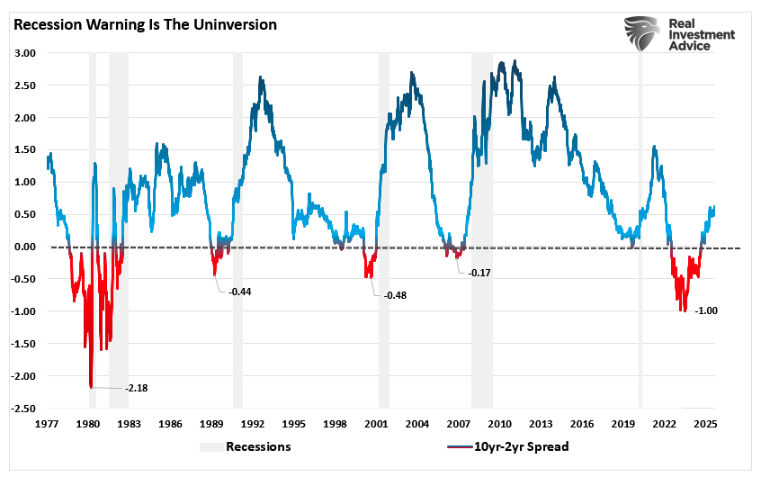
The bond market is also warning us. The yield curve, specifically the spread between 2-year and 10-year Treasury yields, was inverted for over a year. However, it isn’t the inversion that indicates a recessionary onset; it is the UN-inversion. Every post-war recession has been preceded by an inversion, and a UN-inversion of the yield curve. Most people miss the fact that the inversion itself isn’t the recession, it’s the warning. The real trouble begins when the curve steepens again. Often, this is because the Fed is forced to cut rates in a panic. And guess what? As of this writing, markets are pricing at least 50 basis points of cuts by year-end. That doesn’t happen in a “re-accelerating” economy.
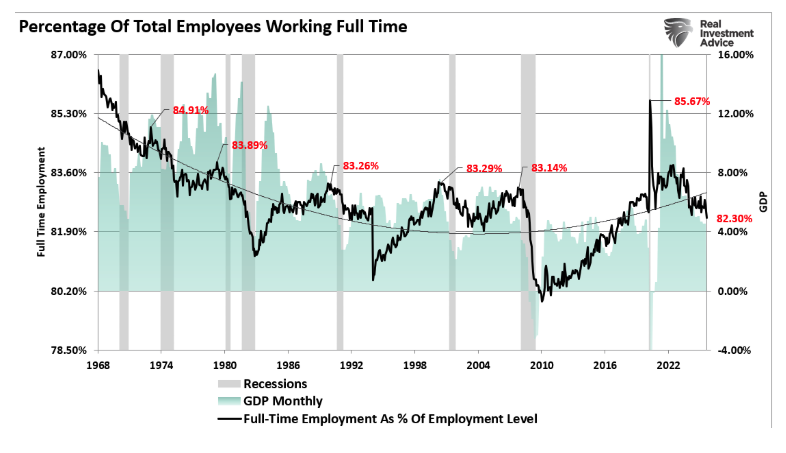
Then there’s the labor market. On the surface, it still looks healthy. But dig deeper, and the cracks are widening. The Bureau of Labor Statistics recently revised previous job gains by over 911,000. Temporary help services continue to decline, and job openings are down roughly 30% from their peak. However, the real number to watch is the percentage of full-time employment. Since full-time employment supports economic growth, it is unsurprising that there is a decent correlation between that measure and GDP. These are not random data points; they are classic early signs that job growth has peaked.
Credit markets are tightening across the board. The Fed’s Senior Loan Officer Survey shows that banks are making it harder to get consumer and commercial loans. Notably, credit is the oxygen of economic growth, and when it gets harder to borrow, businesses delay hiring and capital expenditures as consumers pull back. In addition, there are rising delinquency rates on credit cards and auto loans, particularly among lower-income households, as the post-COVID stimulus buffer runs out.
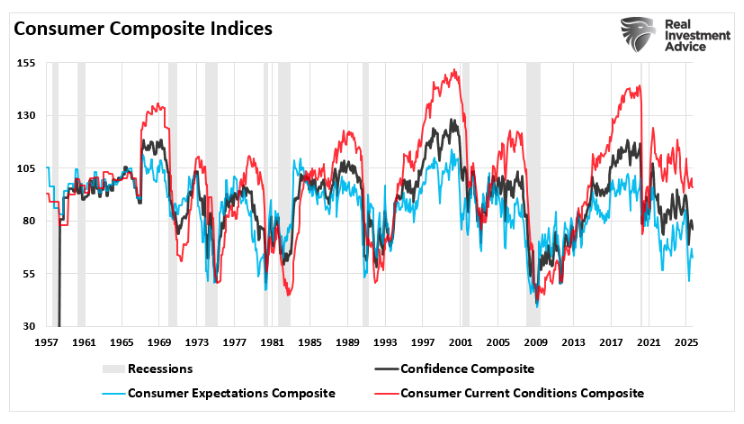
Consumer sentiment also continues to deteriorate. The University of Michigan’s latest survey shows a renewed drop in optimism, especially among lower-income groups who are being squeezed by higher prices, student loan repayments, and rising rents. Yes, spending has not collapsed, but that is mainly because consumers are running up credit balances while drawing down what’s left of their savings. This divergence between weak sentiment and sustained spending is not sustainable; eventually, the math breaks.
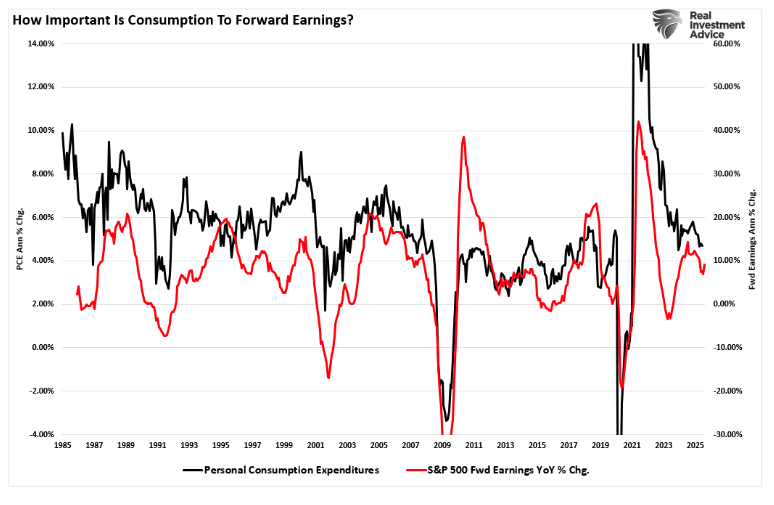
Given that consumption drives earnings, the slowdown in personal consumption expenditures (PCE) should serve as a warning to more bullish analysts’ forecasts.
Investing When There Are Slowdown Signals
Taken in isolation, each of these signals might be dismissed as noise. But taken together, they paint a consistent picture that the U.S. economy is slowing, and the risk of a traditional, cyclical recession is rising steadily. The trouble is, investors have been lulled into complacency by short-term resilience in the stock market and the memory of pandemic-era policy responses. However, those policy levers may not be as easy to pull now.
The combination of a weakening LEI, an inverted yield curve, tighter credit conditions, softening labor data, falling consumer confidence, and narrowing corporate profit margins doesn’t suggest a soft landing; it indicates the landing zone is shrinking quickly and the Federal Reserve is likely already behind the curve. Crucially, we must not forget that leading indicators, by their nature, flash warnings before the damage is visible. It’s often too late to adjust when these trends show up in GDP or official recession declarations.
One of investors’ biggest mistakes at this cycle stage is anchoring to outdated narratives. They point to low unemployment and solid consumer spending and argue that the worst is behind us. However, those are lagging data points. Unemployment always stays low, right up until it spikes. Spending always looks fine, right up until credit dries up. The market will have already moved if we wait for the headlines to confirm the slowdown.
For investors, the path forward is less about panic and more about preparation. Risk is best managed before it becomes obvious, and currently, that means reassessing portfolio positioning with a greater focus on quality, liquidity, and resilience.
-
Shift toward higher-quality equities—companies with strong balance sheets, positive cash flow, and stable earnings. In late-cycle environments, businesses that can defend margins and avoid excessive leverage tend to outperform. Defensive sectors like healthcare, utilities, and consumer staples historically perform well in economic slowdowns. These aren’t the exciting momentum plays, but they often hold up better when growth stalls.
-
Cash is no longer a drag. With money market funds and Treasury bills yielding north of 5%, holding cash offers income and flexibility. In a market that’s likely to become more volatile, the ability to act without selling at a loss becomes a competitive advantage. Don’t let the fear of “missing out” cause you to miss what may be the opportunity to buy later at better prices.
-
Consider hedging. If you’ve enjoyed substantial gains in the past year, now is the time to protect some of those profits. This could mean trimming back riskier holdings, using inverse ETFs to hedge sector exposure, or selecting options to reduce downside risk. The goal isn’t to go all-in or all-out; it’s to manage exposure with a clear eye on growing macro uncertainty.
-
Reduce exposure to highly cyclical sectors. Industries tied to discretionary spending, real estate, or manufacturing tend to underperform during economic contractions. If the slowdown intensifies, these areas will likely see earnings revisions and price multiple compression.
-
Stay tactical. This isn’t the environment for set-it-and-forget-it strategies. Flexibility becomes critical in periods of transition. Markets are forward-looking, and asset prices will have already adjusted by the time the recession shows up in the data. Use this time to tighten your process, raise select cash, and rotate toward areas that can weather a macro storm.
The fiscal and monetary buffers that helped cushion previous slowdowns may not be available now. The federal government is already running massive deficits, and interest payments on the debt are now the fastest-growing budget item. On the monetary side, the Fed is caught between two mandates: inflation isn’t fully tamed, but growth is slowing. Cutting rates too soon risks reigniting price pressures; waiting too long deepens a downturn.
So while the S&P may continue to climb for now, and sentiment might stay upbeat, the forward-looking data suggests that caution may be a more prudent approach.
Lance Roberts is a Chief Portfolio Strategist/Economist for RIA Advisors. He is also the host of “The Lance Roberts Podcast” and Chief Editor of the “Real Investment Advice” website and author of “Real Investment Daily” blog and “Real Investment Report“. Follow Lance on Facebook, Twitter, Linked-In and YouTube Customer Relationship Summary (Form CRS)
Join RIA Advisors and elevate your career within a deeply experienced team focused on innovation. Our collaborative environment is built on a foundation of advanced technology and effective investment models, designed to enhance your ability to serve clients and grow your practice. Benefit from a supportive culture that encourages professional development and fosters a forward-thinking approach. By joining our team, you’ll be part of a group dedicated to excellence and continuous improvement, empowering you to focus on building meaningful client relationships and pursuing your business ambitions. Discover the advantages of working with our accomplished advisory team by starting your conversation today.
A message from Advisor Perspectives and VettaFi: Stay ahead of market changes with our daily updates on key market and economic indicators. Visit the AP Charts and Analysis site for our expert insights.
© Real Investment Advice
Read more commentaries by Real Investment Advice