Summary
- With MLP yields currently elevated near 8%, it is timely to look at distribution guidance and track records by company.
- Among companies with distribution guidance, low or mid-single-digit percentage growth tends to be common, with two names targeting more significant growth.
- Distribution growth is a key tailwind for MLPs and is expected to continue as companies largely generate free cash flow.
Many investors have turned to MLPs over the years for their income, which makes the outlook for distributions a perennial focus for investors. With MLP yields currently elevated relative to long-term averages and a flattish near-term outlook for U.S. energy production, the distribution outlook is particularly topical.
Distribution growth enhances already generous MLP yields
Distribution growth has been an important tailwind for MLPs coming out of the pandemic and has coincided with widespread free cash flow generation (read more). Indeed, there has not been a cut to a regular distribution for a constituent of the Alerian MLP Infrastructure Index (AMZI) since July 2021. Approximately 89.2% of the index by weighting has grown its distribution within the last year as of September 30 (read more).
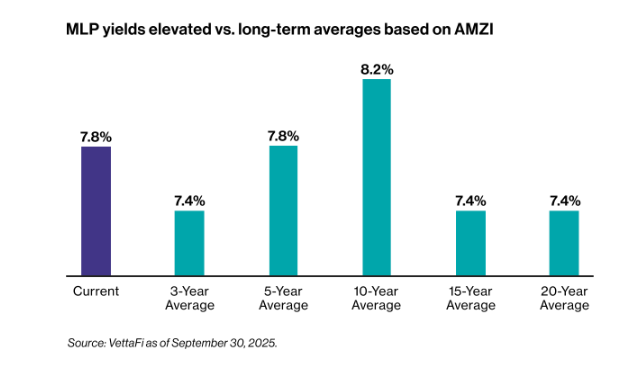
Ongoing distribution growth enhances already compelling yields, with AMZI yielding 7.8% as of September 30. As shown below, AMZI’s current yield is above the three-year average and long-term averages. Keep in mind, the 10-year average is skewed higher by lofty yields in the first half of 2020 as the pandemic roiled equities.
While the track record for distribution growth among AMZI constituents has largely been restored after some painful cuts in 2020, the future of payouts remains in focus. Importantly, multiple MLPs are providing guidance for distribution growth with an emphasis on sustainability. We believe clear capital allocation plans and distribution growth targets are helpful for investors. We expect AMZI constituents to continue to see a strong bias towards distribution increases based on company outlooks.

Breaking down distribution outlooks by company
A handful of AMZI constituents have given clear guidance around their distribution growth plans. Others have strong track records for growth but do not give a forward projection. A few have maintained their payouts at the current level for years. Companies are grouped below according to how they approach their distribution.
There are two AMZI constituents with distribution growth targets at or near double-digit percentages, and both have weights above 12% in AMZI as of September 30.
-
MPLX (MPLX) has been pointing to 12.5% distribution growth on earnings calls, consistent with the increase seen last year. In recent years, MPLX has raised its distribution with the November payout.
-
Plains All American (PAA) has guided to $0.15/unit annual growth for 2026+ until distribution coverage falls to 160%. For context, the company expects ~175% distribution coverage for 2025. A $0.15/unit increase to the current annual payout would represent almost 10% growth. Plains expects future potential increases to be implemented with the distribution paid in the first quarter. (Of note, PAA has discussed a potential special distribution of $0.35/unit to help offset the tax impact of the sale of its Canadian natural gas liquids business for its unitholders.)
Other AMZI constituents with distribution growth guidance are expecting mid-single-digit percentage growth or thereabouts.
A few names have consistently grown their payouts but do not provide forward guidance. Annualized distribution growth has generally been under 5% for these names.
The remaining names in AMZI have largely maintained their payouts or have unclear plans for future increases. Each of the companies below has a weight in AMZI of less than 5% as of September 30.
While distribution plans certainly vary, larger constituents by weighting tend to have clearer plans for distribution growth or a very strong track record for growth in the case of EPD.
Why the distribution outlook matters
Distribution trends and forward expectations for growth add important context to MLP yields, which are currently elevated. With lower interest rates, more investors may be turning to MLPs to help enhance their income portfolios. Additionally, MLPs have historically performed well when distributions are growing (read more). Distribution growth is expected to remain a tailwind for MLPs, as they continue to generate free cash flow. Some MLPs will also use excess cash for equity repurchases (read more).
Looking for midstream insights in your inbox? Subscribe here to keep a pulse on midstream investing through our weekly updates.
AMZI is the underlying index for the Alerian MLP ETF (AMLP) and the ETRACS Alerian MLP Infrastructure Index ETN Series B (MLPB).
Related research:
Midstream/MLP Buybacks Jumped in 2Q25
2Q25 MLP/Midstream Dividend Recap: MLPs Deliver Growth
Midstream/MLP Free Cash Flow Yields Still Strong
Charting Annual MLP Distribution Changes and Performance
For more news, information, and analysis, visit the Energy Infrastructure Content Hub.
Originally published on ETF Trends
Vettafi.com is owned by VettaFi LLC (“VettaFi”). VettaFi is the index provider for AMLP and MLPB, for which it receives an index licensing fee. However, AMLP and MLPB are not issued, sponsored, endorsed or sold by VettaFi, and VettaFi has no obligation or liability in connection with the issuance, administration, marketing or trading of AMLP and MLPB.
A message from Advisor Perspectives and VettaFi: Discover something new! Click here to register for our upcoming webcasts.
Read more commentaries by VettaFi