Key takeaways
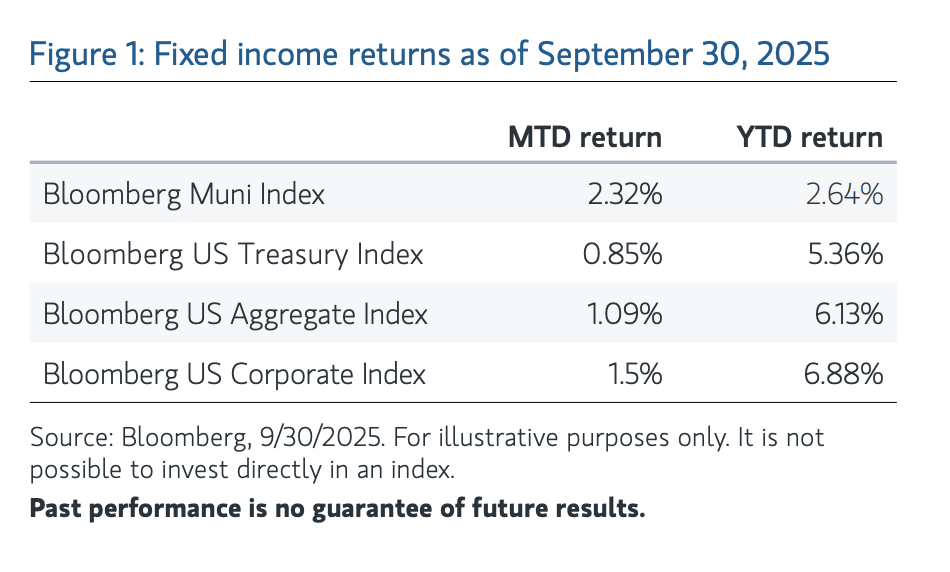
- Muni total return is now up 2.6% year to date (YTD).
- September’s price performance was the strongest monthly showing in 16 years.
- Intermediate and long yields remain compelling and still offer attractive value.
- Year-round tax-loss harvesting has again proved prescient thus far, but the year’s not over.
General market update
As our title suggests, September saw positive performance in fixed income markets but a great and overdue catch-up for municipal bonds. As we discussed in last month’s insight, your starting point matters greatly, and it was and remains “an excellent opportunity to build high-quality portfolios at bargain prices.” Recapping the broad events of September and the opening days of October, on the heels of a much weakerthan-expected August Payroll Situation Report, the Fed fulfilled market expectations by cutting the overnight fed funds rate 25 basis points (bps) at the September Federal Open Markets Committee (FOMC) meeting and signaled that additional cuts were in the offing by the end of this calendar year. For the month, the Bloomberg US Treasury Index returned 0.85%, while the Bloomberg US Corporate Index gained 1.5% on tightening credit spreads. Municipals, enjoying a mild respite from formerly relentless supply, posted an impressive 2.32% to register their strongest month in 16 years (JP Morgan, 10/2/2025). YTD through September 30, the US Treasury Index is up 5.36%, the Corporate Index is up 6.88% and the Muni Index is finally on the scoreboard at 2.64%, and the prospects for further gains look promising.

Supply
As we’ve been discussing for much of this year, supply has been a major muni market factor during 2025. Simply stated, there has been an overabundance of new-issue bonds coming to market. Although the tax-exempt market has successfully digested the outsized weekly calendars in an orderly fashion, that market saturation came at the price of performance. Our viewpoint has consistently been that this supply will ebb enough to enable stronger performance during the second half of the year. With the shot clock ticking loudly as we head deeper into October, it’s heartening to see that year-over-year (YoY) supply was actually down by 10.5% in September, which follows a negative 4.8% print in August, and the muni market has certainly responded with pricing gains. We believe there’s more ground to cover. We’ll cover that thought process in a moment.
Though a mildly lighter supply environment has indeed arrived, as evidenced by the two consecutive monthly YoY declines and even spot shortages of bonds in certain “specialty” high-tax states, it doesn’t feel like there has been a material slowdown. After supply-fatigued trading and underwriting desks worked through the muni summer that wasn’t (supply typically slows but didn’t this year), the September experience was jarring, given the saw-toothed issuance pattern that transpired. Looking at the scheduled sales by week according to Ipreo, we see this on-and-off dynamic that featured $7.5 billion, $11 billion, $5 billion, $15 billion and $7 billion into the first week of October. On average, that’s about $9 billion per week, which is a healthy clip, but the lighter interim weeks left no time for market pundits to catch their collective breath. In fact, as we pen this note, next week’s calendar is scheduled to bring a healthy $13 billion to market, so the saw-toothed action continues.
Market opportunity
After highlighting outsized muni price performance in September, the natural next question appears to be, “Is the window of opportunity now closed?” We don’t believe it is. A number of factors lead us to that conclusion. These include elevated muni relative value compared with Treasurys, absolute yields that remain historically compelling, a muni yield curve that is much steeper than that of Treasurys and the fact that we expect supply to ebb further in November and December. Generally positive muni mutual fund flows are also a contributing factor.
Before delving into those potential drivers of further positive performance, let’s spend a moment on what the YTD positive performance means for tax-efficient muni investing— specifically, tax-loss harvesting. In prior insights we’ve discussed the need for professional year-round tax-loss harvesting despite many investors still approaching the process as a pre-Thanksgiving tradition. As we’ve seen time and time again, market losses can occur at any point during the year. Obviously, many of those losses have since been recouped, but with that recovery comes fewer opportunities to take losses as an asset that may be able to enhance after-tax returns. These losses can be used to potentially offset gains or taxable income in the current year or could be carried forward indefinitely, while resetting book yields higher. Third-party research has shown that tax management can add 1% to 2% in after-tax excess returns for equity—known as tax alpha—and as much as 30 bps for fixed income.
In recent years we’ve seen a number of examples when it paid to harvest tax losses systematically whenever the opportunity presented itself, For example, in 2023 chair Powell indicated that the Fed was done raising interest rates, and the market never looked back and rallied sharply through year-end. As a market leader in tax-efficient investing, Parametric has already sold more than $13 billion in market value YTD through September 30 to realize $330 million in net losses, delivering a potential tax benefit of more than $119 million for our Parametric fixed income SMA investors. A recent Cerulli report highlighted tax management as one of the most valuable priorities in investing for high-net-worth clients.
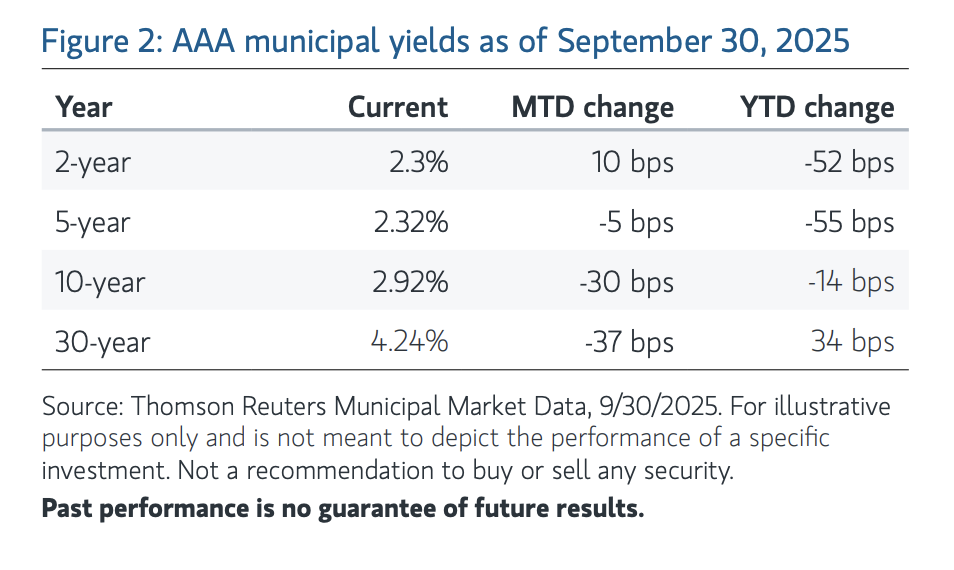
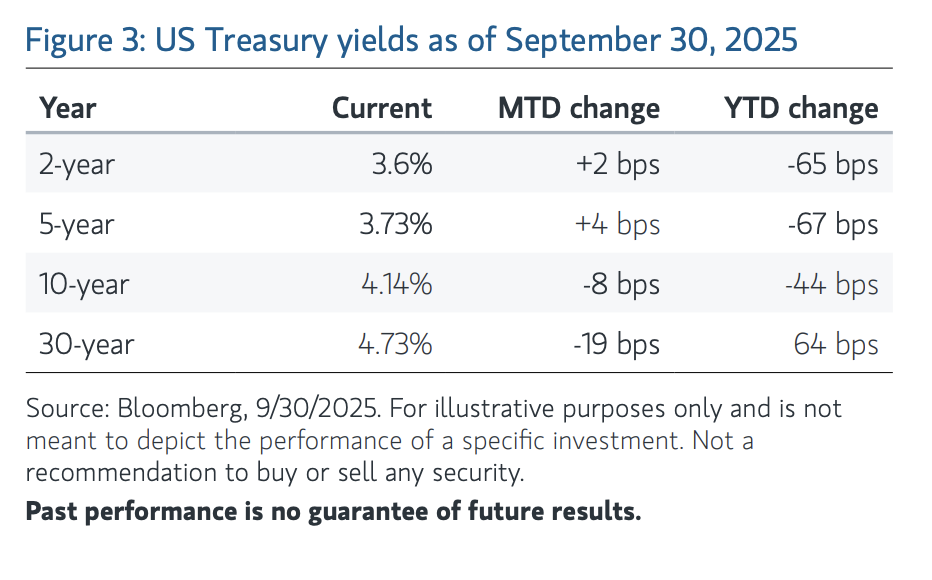
There is also a noticeable difference between the shapes of muni and Treasury yield curves. The muni curve is much steeper beyond the 10-year maturity. In fact, the slope of the muni yield curve between 10- and 30-year maturities (132 bps on October 2) is more than twice that of the 60-bp pickup offered by Treasurys. This means that investors may be rewarded significantly more for extending out on the curve in munis than in Treasurys if yields trend lower.
Finally, we now have a Fed that is back in easing mode after cutting in September, which could provide an additional and considerable performance tailwind if Fed signaling and market expectations are proved correct with two more 25-bp cuts by year-end, which we’ll discuss in a moment.
Worth noting also is the importance of muni mutual fund flows, which tend to be pro-cyclical, meaning there are often inflows when yields are declining and outflows when yields are rising. This dynamic is counterintuitive to long-term muni buyer psychology and can provide attractive entry points during outflow episodes. Inflows have dominated in recent months, with only three outflow weeks out of the last 22 weeks. This metric bears watching given a more balanced supply/demand muni market, as we report in our latest weekly fixed income insights.
Economic outlook
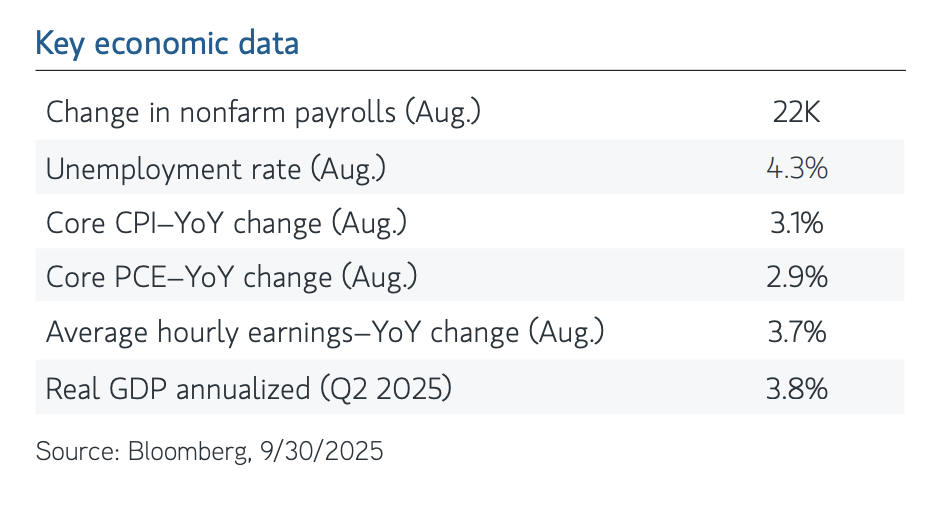
Looking forward, a very recent addition to the challenge of market forecasting is the absence of certain economic data— for example, payrolls, CPI and PPI—because of the government shutdown. While we’re hopeful the delay in reporting will be temporary, it does have impacts on both market sentiment and economic activity, as it heightens sensitivity to what is available. Each week of closure is also estimated to trim approximately 0.1% from US GDP growth. Thankfully, GDP growth was holding up well going into the shutdown, despite some cracks on the labor front, having been recently revised upward to 3.8% annualized.
The “old” August Payroll Situation Report came in at a materially lower 22,000 jobs created, compared with the 75,000 expected, featured an unchanged unemployment rate of 4.3% and raised expectations for a 25 bp rate cut at the September FOMC meeting, which was later fulfilled. Two weeks later the Fed lowered the target range to 4% to 4.25%, and a new Summary of Economic Projections (the “dot plot”) signaled two more cuts this year, while upgrading its outlook for growth in 2026 and forecasting modestly higher inflation next year. The fed funds futures market currently indicates a 97% probability for a cut at the October 29 FOMC meeting and 87% odds for a cut at the December meeting (Bloomberg, 10/3/2025).
ABOUT
Parametric Portfolio Associates® LLC (“Parametric”), headquartered in Seattle, is registered as an investment advisor with the US Securities and Exchange Commission under the Investment Advisers Act of 1940. Parametric is a leading global asset management firm, providing investment strategies and customized exposure management directly to institutional investors and indirectly to individual investors through financial intermediaries. Parametric offers a variety of rules-based investment strategies, including alpha-seeking equity, fixed income, alternative and options strategies. Parametric also offers implementation services, including customized equity, traditional overlay and centralized portfolio management. Parametric is part of Morgan Stanley Investment Management, the asset management division of Morgan Stanley, and offers these capabilities through offices located in Seattle, Boston, Minneapolis, New York and Westport, Connecticut.
A message from Advisor Perspectives and VettaFi: Transitioning your financial advisory business? Read our latest articles for guidance on launching an RIA, switching firms, or specializing.
DISCLOSURES
This material may not be reproduced, in whole or in part, without the written consent of Parametric. Parametric and its affiliates are not responsible for its use by other parties.
This information is intended solely to report on investment strategies and opportunities identified by Parametric. Opinions and estimates offered constitute our judgment and are subject to change without notice, as are statements of financial market trends, which are based on current market conditions. We believe the information provided here is reliable but do not warrant its accuracy or completeness. This material is not intended as an offer or solicitation for the purchase or sale of any financial instrument. Past performance is not indicative of future results. The views and strategies described may not be suitable for all investors. Investing entails risks, and there can be no assurance that Parametric will achieve profits or avoid incurring losses. Parametric and Morgan Stanley do not provide legal, tax or accounting advice or services. Clients should consult with their own tax or legal advisor prior to entering into any transaction or strategy described herein.
Charts, graphs and other visual presentations and text information were derived from internal, proprietary or service vendor technology sources or may have been extracted from other firm databases. As a result, the tabulation of certain reports may not precisely match other published data. Data may have originated from various sources, including, but not limited to, Bloomberg, MSCI/Barra, FactSet or other systems and programs. Parametric makes no representation or endorsement concerning the accuracy or propriety of information received from any third party.
The views expressed in this report are those of the authors and are current only through the date stated at the top of this page. These views are subject to change at any time based on market or other conditions, and Parametric disclaims any responsibility to update such views. These views may not be relied on as investment advice and, because investment decisions are based on many factors, may not be relied on as an indication of trading intent on behalf of any Parametric strategy. This commentary may contain statements that are not historical facts, referred to as “forward-looking statements.” The strategy’s actual future results may differ significantly from those stated in any forward‑looking statement, depending on factors such as changes in securities or financial markets or general economic conditions.
References to specific securities and their issuers are for illustrative purposes only and are not intended to be, and should not be interpreted as, a recommendation to purchase or sell such securities. There is no guarantee as to its accuracy or completeness. Past performance is no guarantee of future results. All investments are subject to the risk of loss. Prospective investors should consult with a tax or legal advisor before making any investment decision.
The index data referenced herein is the property of ICE Data Indices, LLC (“ICE”), its affiliates and its third-party suppliers. ICE, its affiliates and its third-party suppliers accept no liability in connection with its use.
An imbalance in supply and demand in the income market may result in valuation uncertainties and greater volatility, less liquidity, widening credit spreads and a lack of price transparency in the market. As interest rates rise, the value of certain income investments is likely to decline. Investments in income securities may be affected by changes in the creditworthiness of the issuer and are subject to the risk of nonpayment of principal and interest. The value of income securities also may decline because of real or perceived concerns about the issuer’s ability to make principal and interest payments. While certain US government–sponsored agencies may be chartered or sponsored by acts of Congress, their securities are neither issued nor guaranteed by the US Treasury. Mortgage- and asset-backed securities are subject to credit, interest rate, prepayment and extension risk. Derivative instruments can be used to take both long and short positions, be highly volatile, result in economic leverage (which can magnify losses) and involve risks in addition to the risks of the underlying instrument on which the derivative is based, such as counterparty, correlation and liquidity risk. Diversification does not guarantee profit or eliminate the risk of loss.
All contents ©2025 Parametric Portfolio Associates® LLC. All rights reserved.
Parametric Portfolio Associates® and Parametric® are trademarks registered with the US Patent and Trademark Office and certain foreign jurisdictions. Parametric is headquartered at 800 Fifth Avenue, Suite 2800, Seattle, WA 98104. For more information regarding Parametric and its investment strategies, or to request a copy of Parametric’s Form ADV or a list of composites, contact us at 206 694 5500 or visit www.parametricportfolio.com.
NOT FDIC INSURED | NO BANK GUARANTEE | MAY LOSE VALUE | NOT INSURED BY ANY FEDERAL GOVERNMENT AGENCY | NOT A DEPOSIT
© Parametric
Read more commentaries by Parametric