SUMMARY
- Yield curve has not been impacted by the Fed cutting rates.
- Credit spreads remain tight with limited room for additional tightening, in our view.
- Our portfolios remain short duration as yields have limited room to fall, in our opinion.
We Do Not Foresee Materially Lower Bond Yields
It has been a month since the Fed cut interest rates by 25 basis points and brought the effective fed funds rate down to 4.11%. Prior to the meeting economists and financial analysts speculated that the ‘yield curve’ – a graphic representation of the difference in yields of Treasuries with maturities between two and thirty years – would steepen. A steepening of the yield curve would mean that as the Fed cut interest rates, those Treasuries with shorter maturities would have their yields fall more than the yields of the longer maturity Treasuries. The logic behind the analysis lies with the thought that the front-end of the curve is closely tied to the fed funds rate itself, while the long end of the curve is more driven by growth and inflation expectations.
Currently, financial markets are pricing in two more rate cuts from the Fed before year-end. However, after reviewing post-September comments from voting members of the Federal Open Market Committee (FOMC), the market may be over-extrapolating the Fed’s intentions. Eight out of twelve voting FOMC members have given speeches, and thus far they have been split regarding the appropriate monetary policy response moving forward, in line with the September 17th meeting minutes. Hence, we believe that it is not a forgone conclusion that the Fed will cut rates twice more, but Powell has opened the door for a cut at its October 29th meeting.
To analyze the impact of the Fed’s rate cut on the bond market, we are going to look at the impact of Treasuries maturing between 2 and 10 years and Treasuries maturing between 10 and 30 years. We will explore the month prior to the Fed’s September meeting and the month after, in order to understand the full impact of the Fed’s decision to cut rates. Additionally, we will look at credit ‘spreads’ – the yield differential between corporate bonds and risk-free Treasury bonds with similar maturities to see how they have reacted in the aftermath of interest rate cuts.
Treasury Yield Curve: Unlikely to Move Much Without Further Cuts
The Fed meeting on September 17th lowered interest rates. However, the stage was set for lower rates earlier on August 22nd, when Fed Chairman Jerome Powell telegraphed the FOMC pivot in his Jackson Hole Symposium speech when he stated, “the risks to inflation are titled to the upside and the risks to employment are tilted to the downside”, possibly warranting a change in the Fed’s policy. The week leading into this speech, the difference in yields between the 2 to 10-year Treasuries averaged 55 basis points but reached a high a few days later of 62 basis points. However, since the early days of the market expecting a change in Fed monetary policy, there has been a muted reaction. The yield differential between the 2 to 10-year part of the yield curve is virtually unchanged.
We now turn our attention to the long end of the curve using the same framework. During the week leading up to the Jackson Hole speech, the yield differential between the 10-year and 30-year Treasuries averaged 60 basis points. The following week the yield differential reached its peak of roughly 70 basis points and then declined back to around 60 basis points on September 17th, the day the Fed cut interest rates.
Since the Fed cut rates, the yield differential between the 10-year and 30-year Treasuries has been rangebound between 56 and 61 basis points…essentially the same as before Jackson Hole. Currently, the yield differential stands at 59 basis points. While the specific number may matter less, the magnitude and direction of yields are important. While economists and analysts were anticipating higher inflation due to delayed tariff impacts to put upward pressure on longer Treasury maturities, it has clearly not occurred thus far.
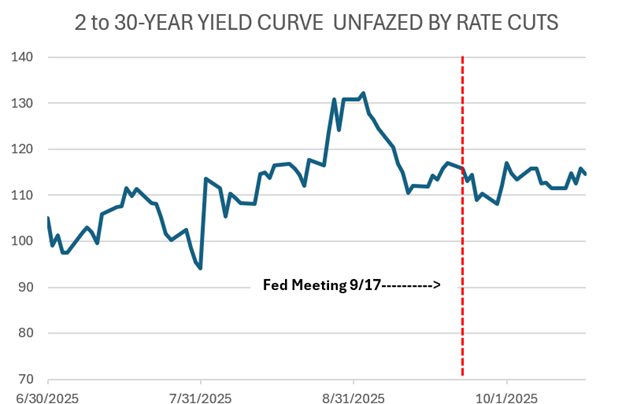
The chart below of the 2 to 30-year yield curve shows that most of the steepening of the yield curve happened in the month of August, before moderating. The dotted red line in the chart delineates the Fed’s September 17th rate cut and just how flat the curve has stayed since. Hence, we believe that the Fed will have to make a series of rate cuts for there to be significant movement in the 2 to 30-year part of the yield curve. Thus, we continue to prefer shorter maturing bonds over those that are 10 years or longer.

Source: RiverFront, Bloomberg; data daily, as of 10.17.2025. Chart shown for illustrative purposes only. Past performance is no indication of future results.
Credit Spreads
While we have focused mostly on the yield curve, it is now time to look at the impact that the Fed rate cut has had on credit spreads of investment grade and non-investment grade (high yield) companies. Since the Fed cut interest rates, credit spreads for investment grade bonds have only increased by 4 basis points, while spreads of high yield bonds have increased by 25 basis points. In both instances, there have been minor changes since the Fed cut rates. We believe that the credit spreads, like the yield curve, will not react to the interest rate cuts unless the Fed facilitates a significant move lower in rates. The one exception to this logic would be in high yield bonds, where defaults can drive spread movement much quicker. Currently, defaults are low and high yield credit spreads are trading within 63 basis points of their all-time lows.
RiverFront Portfolio View: 4.0-4.25% Fair Value on 10-Year Treasury; Stay Underweight Duration
We do not envision a path where yields are materially lower, especially on the long end of the yield curve. Currently, the market is pricing a neutral fed funds rate of 3%, the rate where the economy neither grows nor contracts. Since 1991, the 2 to 30-year yield curve has averaged 151 basis points. Thus, we believe a 100 to 125 basis point spread above the neutral rate would be an appropriate yield for the 10-year Treasury. Therefore, based on a 3% neutral rate, investors would expect some spread above the neutral rate to invest 2 years out. We assume that expected spread is about 25 basis points, meaning the 30-year Treasury should be in the 4.50% to 4.75% range. Given that the average spread between the 10 year and 30-year Treasuries have been 53 basis points, we believe 4.0% – 4.25 is fair value on the 10-year, its current trading range.
Hence, our balanced portfolios remain underweight interest rate sensitivity (‘duration’). We recommend owning shorter maturity bonds than the portfolio benchmark, as we believe yields have limited room to fall as the yield curve reaction function to the Fed cutting rates has been muted.
By Kevin Nicholson, CFA
Originally published by Riverfront Investment Group
For more news, information, and strategy, visit the ETF Strategist Content Hub.
A message from Advisor Perspectives and VettaFi: Did you know that we provide daily updates when key market and economic indicators change? Visit the AP Charts and Analysis site to get our expert insights.
Risk Discussion: All investments in securities, including the strategies discussed above, include a risk of loss of principal (invested amount) and any profits that have not been realized. Markets fluctuate substantially over time and have experienced increased volatility in recent years due to global and domestic economic events. Performance of any investment is not guaranteed. In a rising interest rate environment, the value of fixed-income securities generally declines. Diversification does not guarantee a profit or protect against a loss. Investments in international and emerging markets securities include exposure to risks such as currency fluctuations, foreign taxes and regulations, and the potential for illiquid markets and political instability. Please see the end of this publication for more disclosures.
Important Disclosure Information:
The comments above refer generally to financial markets and not RiverFront portfolios or any related performance. Opinions expressed are current as of the date shown and are subject to change. Past performance is not indicative of future results and diversification does not ensure a profit or protect against loss. All investments carry some level of risk, including loss of principal. An investment cannot be made directly in an index.
Information or data shown or used in this material was received from sources believed to be reliable, but accuracy is not guaranteed.
This report does not provide recipients with information or advice that is sufficient on which to base an investment decision. This report does not take into account the specific investment objectives, financial situation or need of any particular client and may not be suitable for all types of investors. Recipients should consider the contents of this report as a single factor in making an investment decision. Additional fundamental and other analyses would be required to make an investment decision about any individual security identified in this report.
Chartered Financial Analyst is a professional designation given by the CFA Institute (formerly AIMR) that measures the competence and integrity of financial analysts. Candidates are required to pass three levels of exams covering areas such as accounting, economics, ethics, money management and security analysis. Four years of investment/financial career experience are required before one can become a CFA charterholder. Enrollees in the program must hold a bachelor’s degree.
All charts shown for illustrative purposes only. Technical analysis is based on the study of historical price movements and past trend patterns. There are no assurances that movements or trends can or will be duplicated in the future.
Stocks represent partial ownership of a corporation. If the corporation does well, its value increases, and investors share in the appreciation. However, if it goes bankrupt, or performs poorly, investors can lose their entire initial investment (i.e., the stock price can go to zero). Bonds represent a loan made by an investor to a corporation or government. As such, the investor gets a guaranteed interest rate for a specific period of time and expects to get their original investment back at the end of that time period, along with the interest earned. Investment risk is repayment of the principal (amount invested). In the event of a bankruptcy or other corporate disruption, bonds are senior to stocks. Investors should be aware of these differences prior to investing.
In general, the bond market is volatile, and fixed income securities carry interest rate risk. (As interest rates rise, bond prices usually fall, and vice versa). This effect is usually more pronounced for longer-term securities). Fixed income securities also carry inflation risk, liquidity risk, call risk and credit and default risks for both issuers and counterparties. Lower-quality fixed income securities involve greater risk of default or price changes due to potential changes in the credit quality of the issuer. Foreign investments involve greater risks than U.S. investments, and can decline significantly in response to adverse issuer, political, regulatory, market, and economic risks. Any fixed-income security sold or redeemed prior to maturity may be subject to loss.
Definitions:
A basis point is a unit that is equal to 1/100th of 1%, and is used to denote the change in a financial instrument. The basis point is commonly used for calculating changes in interest rates, equity indexes and the yield of a fixed-income security. (bps = 1/100th of 1%).
A yield curve is a graphical representation of yields over time; it’s often depicted by plotting the yield of any given bond across different maturities in a given interval, perhaps by month.
High yield bonds are debt securities often referred to as “high-yield” or “junk” bonds issued by corporations. High-yield bonds tend to pay higher interest rates because they have lower credit ratings than investment-grade bonds. High-yield securities (including junk bonds) are subject to greater risk of loss of principal and interest, including default risk, than higher-rated securities.
Treasuries are government debt securities issued by the US Government. Treasury securities typically pay less interest than other securities in exchange for lower default or credit risk. With relatively low yields, income produced by Treasuries may be lower than the rate of inflation.
Treasury Bonds is represented by the Bloomberg US Treasury Index which measures the performance of the US Treasury bond market.
”Risk-Free’ rate is the theoretical rate of return of an investment with zero risk, which we define by using the 10-yr US Treasury Yield.
The 10-year Treasury bond yield is the interest rate the U.S. government pays to borrow money for a decade. It serves as a benchmark for other interest rates and a key indicator of investor sentiment about economic conditions.
Federal Open Market Committee (FOMC) refers to the branch of the Federal Reserve System (FRS) that determines the direction of monetary policy in the United States by directing open market operations (OMOs). The committee is made up of 12 members, including seven members of the Board of Governors, the president of the Federal Reserve Bank of New York, and four of the remaining 11 Reserve Bank presidents on a rotating basis.
A credit spread is defined as the difference in yield or interest rates between two debt securities that typically have similar maturities but differ in their credit ratings. This spread reflects the market’s perception of credit risk, with a wider spread indicating higher perceived risk and a narrower spread suggesting lower risk.
Inflation is a gradual loss of purchasing power, reflected in a broad rise in prices for goods and services over time.
Interest rate sensitivity is a measure of how much the price of a fixed-income asset will fluctuate as a result of changes in the interest rate environment. Securities that are more sensitive have greater price fluctuations than those with less sensitivity. This type of sensitivity must be taken into account when selecting a bond or other fixed-income instrument the investor may sell in the secondary market. Interest rate sensitivity affects buying as well as selling.
When referring to being “overweight” or “underweight” relative to a market or asset class, RiverFront is referring to our current portfolios’ weightings compared to the composite benchmarks for each portfolio. Asset class weighting discussion refers to our Advantage portfolios.
RiverFront Investment Group, LLC (“RiverFront”), is a registered investment adviser with the Securities and Exchange Commission. Registration as an investment adviser does not imply any level of skill or expertise. Any discussion of specific securities is provided for informational purposes only and should not be deemed as investment advice or a recommendation to buy or sell any individual security mentioned. RiverFront is affiliated with Robert W. Baird & Co. Incorporated (“Baird”), member FINRA/SIPC, from its minority ownership interest in RiverFront. RiverFront is owned primarily by its employees through RiverFront Investment Holding Group, LLC, the holding company for RiverFront. Baird Financial Corporation (BFC) is a minority owner of RiverFront Investment Holding Group, LLC and therefore an indirect owner of RiverFront. BFC is the parent company of Robert W. Baird & Co. Incorporated, a registered broker/dealer and investment adviser.
To review other risks and more information about RiverFront, please visit the website at riverfrontig.com and the Form ADV, Part 2A. Copyright ©2025 RiverFront Investment Group. All Rights Reserved. ID 4916760
Read more commentaries by Riverfront Investment Group