As we inch towards the end of the year, many investors are digesting the ground we have covered so far this year while looking forward to 2026. For many investors, this analysis may warrant some sort of portfolio rebalancing to ensure that overall asset-class exposure remains aligned with long-term financial goals. Year-to-date, equity markets (as measured by the S&P 500 Total Return Index) are higher by 15.8%. If you stretch the timeframe back to the start of 2024, equities are higher by 44.8%. The stock market has been on a tremendous run for the past few years. By comparison, bonds (as measured by the Bloomberg US Aggregate index) are higher by 6.7% year-to-date and up by 8.1% looking back to the beginning of 2024.
For a very simple illustration, if you assume that an investor has a 50/50 target allocation between stocks and bonds and started 2024 aligned to their target with $1,000,000 in each asset class, they would currently be over-allocated to equities by over $180,000 (using the index returns outlined above). Whatever your target allocation is as an investor, it was likely arrived at based on aligning and balancing long-term financial goals with personal risk tolerance. If you are $180,000 overallocated to equities, you are likely taking on more risk than originally intended and revisiting the overall structure of your portfolio with your financial advisor may be warranted.
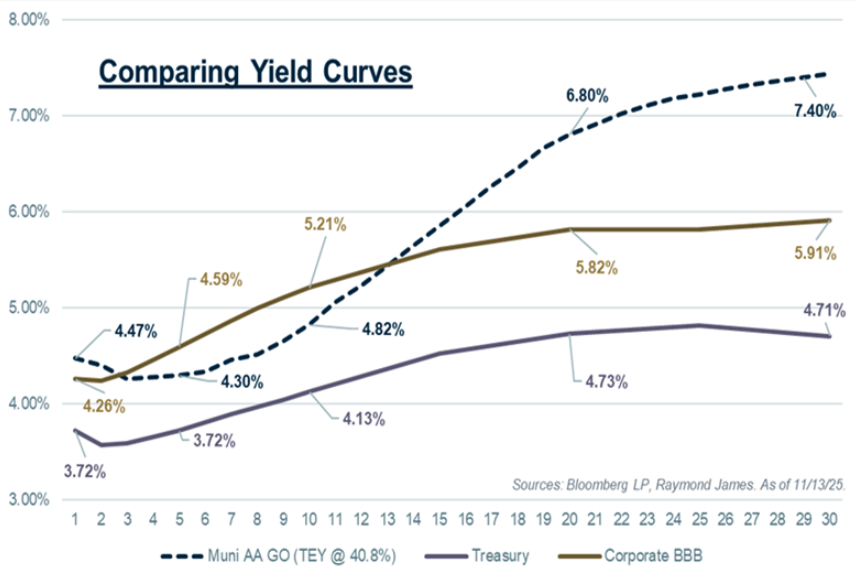
As you eye potentially shifting some of the gains made in the equity market back over to fixed income in order to realign your portfolio, this commentary provides a snapshot of the current state of the fixed income market to highlight available yields and relative value. In the chart below, the purple line represents the Treasury curve, the gold line is the BBB corporate curve, and the dotted blue line is the AA municipal curve shown on a taxable-equivalent yield (TEY) basis. A few takeaways are noted below.
Treasuries
As would be expected given the inherent differences in credit risk, Treasury yields are lower than both corporate and municipal yields across the curve. For conservative investors who would prefer to not take on credit risk, Treasuries still offer compelling yields in the high-3% to high-4% range, which are relatively attractive yield levels compared to much of the past 10 to 15 years. Also note that for investors in high-income tax states, the TEY for Treasuries should be considered and can make them much more attractive. For example, a 3.70% yield for a California investor in the state’s top tax bracket (13.3%) translates to a TEY of 4.69%, which at 1-year is higher than the yield for BBB rated corporate bonds.

Corporates
Investment-grade corporate bonds continue to provide attractive yields, offering investors yields from the mid-4% range to nearly 6% on the long end of the curve. The short end of the curve is relatively flat and begins to steepen around the 3 to 4 year part of the curve, with the steepest part of the curve being the 4 to 10 year window. A steeper curve means that investors are being rewarded more (in terms of yield) for each additional year they extend out on the curve.
Municipals
The municipal curve tells a few different stories. The short end of the curve, out to around 10 years, is relatively flat and is also trading rich relative to taxable bonds. Even when using the TEY for an investor in the top tax bracket, corporate bonds offer higher yields on the shorter part of the curve (the gold line is higher than the dashed blue line). This means that even after paying taxes, many investors could be better off from after-tax yield perspective by buying corporate bonds versus municipal bonds inside of 10 years. Given how steep the municipal curve gets around 10 years, the narrative shifts completely as you extend out to the intermediate and long part of the curve. Municipal bonds in this part of the curve offer tremendous value, providing investors TEYs in the upper 6% to mid-7% range. For investors in high income tax states, TEYs over 8% can be achieved.
The current fixed income landscape offers investors the opportunity to rebalance their portfolio and bring it back into alignment with their desired risk tolerance while also locking in attractive yields, regardless of product choice.
The author of this material is a Trader in the Fixed Income Department of Raymond James & Associates (RJA), and is not an Analyst. Any opinions expressed may differ from opinions expressed by other departments of RJA, including our Equity Research Department, and are subject to change without notice. The data and information contained herein was obtained from sources considered to be reliable, but RJA does not guarantee its accuracy and/or completeness. Neither the information nor any opinions expressed constitute a solicitation for the purchase or sale of any security referred to herein. This material may include analysis of sectors, securities and/or derivatives that RJA may have positions, long or short, held proprietarily. RJA or its affiliates may execute transactions which may not be consistent with the report’s conclusions. RJA may also have performed investment banking services for the issuers of such securities. Investors should discuss the risks inherent in bonds with their Raymond James Financial Advisor. Risks include, but are not limited to, changes in interest rates, liquidity, credit quality, volatility, and duration. Past performance is no assurance of future results.
Investment products are: not deposits, not FDIC/NCUA insured, not insured by any government agency, not bank guaranteed, subject to risk and may lose value.
To learn more about the risks and rewards of investing in fixed income, access the Financial Industry Regulatory Authority’s website at finra.org/investors/learn-to-invest/types-investments/bonds and the Municipal Securities Rulemaking Board’s (MSRB) Electronic Municipal Market Access System (EMMA) at emma.msrb.org.
J.D. Power 2025 U.S. Investor Satisfaction Study, which measures overall investor satisfaction with investment firms, was released 3/20/25, based on investors surveyed 1/24-12/24, who may be working with a financial advisor. Based on 7,876 responses from Advised Investors, 1 company out of 24 was chosen as the winner. The award is not representative of any one client’s experience, is not an endorsement, and is not indicative of an advisor’s future performance. The study is independently conducted, and the participating firms do not pay to participate. Use of study results in promotional materials is subject to a license fee. J.D. Power is not affiliated with Raymond James. For J.D. Power 2025 award information, visit jdpower.com/awards.
Links are being provided for information purposes only. Raymond James is not affiliated with and does not endorse, authorize or sponsor any of the listed websites or their respective sponsors. Raymond James is not responsible for the content of any website or the collection or use of information regarding any website's users and/or members.
© 2025 Raymond James Financial, Inc. All rights reserved.
A message from Advisor Perspectives and VettaFi: Discover something new! Click here to register for our upcoming webcasts.
© Raymond James
Read more commentaries by Raymond James