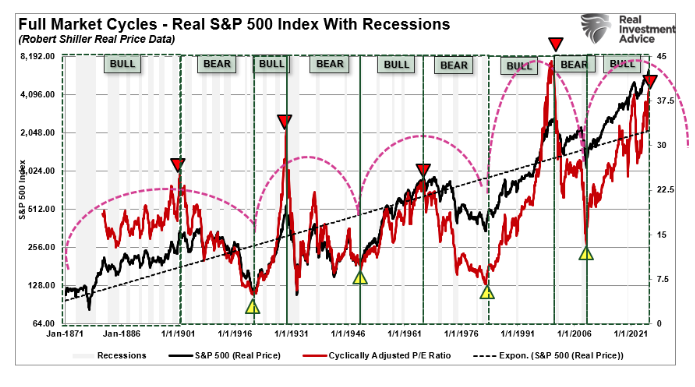
Last week, we discussed the importance of “math” as it relates to valuations and noted the importance of understanding “full market cycles.” To wit:
“The math on forward return expectations, given current valuation levels, does not hold up. The assumption that valuations can fall without the price of the markets being negatively impacted is also grossly flawed. Historical data, as illustrated in the following chart, suggest that valuations do not decline without a significant impact on investment returns. Additionally, it is worth noting that “full market cycles,” which encompass both secular bull and bear periods, recur throughout history.”

What is a “Full Market Cycle”
Many readers asked what I meant by a full market cycle and why it matters today. The chart above showing inflation-adjusted S&P 500 prices since 1871 makes it clear: every bull market is eventually followed by a bear market. Together, these form a full cycle.
Throughout history, bull market cycles are only one-half of the “full market” cycle. This is because during every “bull market” cycle the markets and economy build up excesses that are then “reverted” during the following “bear market.” In the other words, as Sir Issac Newton once stated:
“What goes up, must come down.”
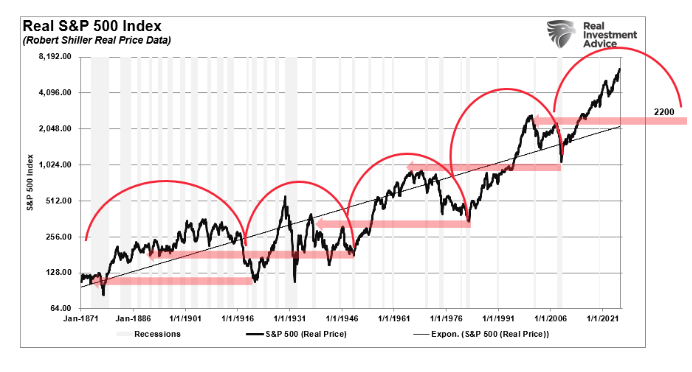
The current cycle remains incomplete, but history suggests that the second half usually retraces much of the prior gains. Logical downside targets often align with past peaks, such as those in 2000 and 2008.
Note: I am not stating that I “believe” the markets are about to crash to the 2200 level on the S&P 500. I am simply showing where the previous support intersects with the price. The longer that it takes for the markets to mean revert the higher the intersection point will be. Furthermore, the 2200 level is not out of the question either. Famed investor Jack Bogle stated that over the next decade we are likely to see two more 50% declines. A 50% decline from current levels would put the market below 3400 which would be in the “ballpark” of completing the current full market cycle.
As I have often stated, I am not bullish or bearish. My job as a portfolio manager is simple; invest money in a manner that creates returns on a short-term basis, but reduces the possibility of catastrophic losses, which wipe out years of growth.
Nobody tends to believe that philosophy until the markets wipe about 40-50% of portfolio values over a relatively short period. But that is why it is crucial to understand that markets do cycle, and this time is likely “not different.”
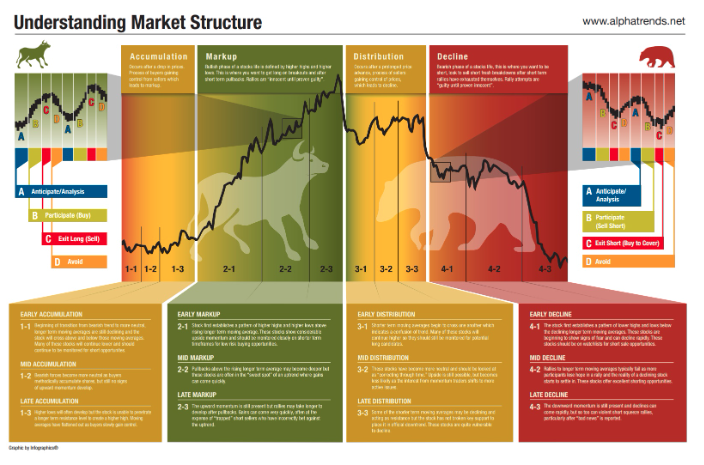
4-Phases Of A Full Market Cycle
AlphaTrends previously put together an excellent diagram laying out the 4-phases of the full-market cycle. To wit:
“Is it possible to time the market cycle to capture big gains? Like many controversial topics in investing, there is no real professional consensus on market timing. Academics claim that it’s not possible, while traders and chartists swear by the idea.
The following infographic explains the four important phases of market trends, based on the methodology of the famous stock market authority Richard Wyckoff. The theory is that the better an investor can identify these phases of the market cycle, the more profits can be made on the ride upwards of a buying opportunity.”
So, the question to answer, obviously, is:
“Where are we now?”
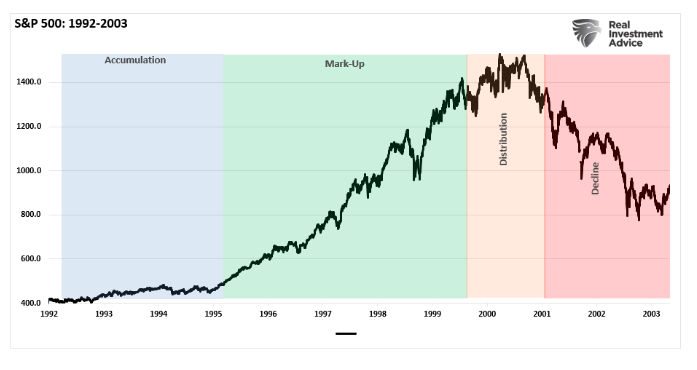
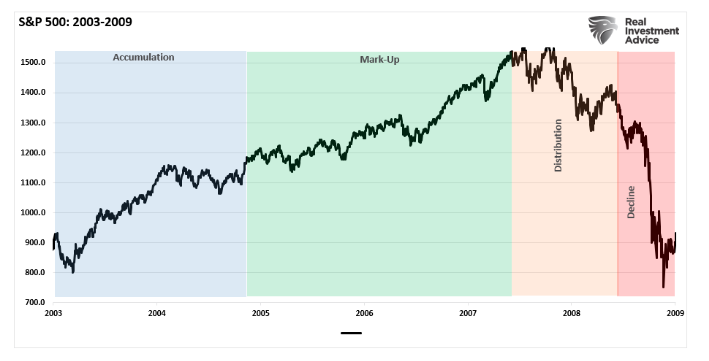
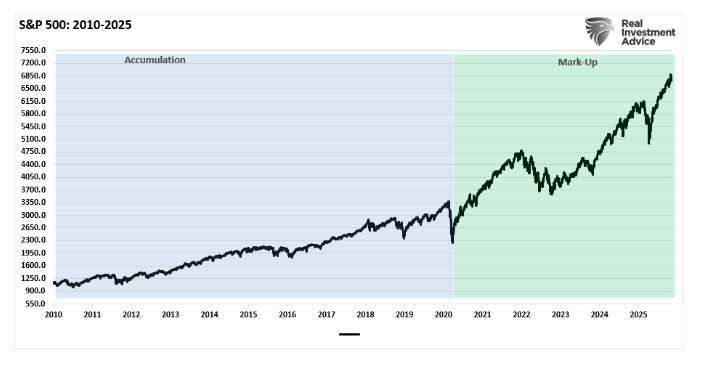
Let’s take a look at the past two full-market cycles, using Wyckoff’s methodology, as compared to the current post-financial-crisis half-cycle. While actual market cycles will not exactly replicate the chart above, you can clearly see Wyckoff’s theory in action.
The accumulation phase, following the 1991 recessionary environment, was evident as it preceded the “internet trading boom” and the rise of the “dot.com” bubble from 1995-1999. As I noted previously:
“Following the recession of 1991, the Federal Reserve drastically lowered interest rates to spur economic growth. However, the two events which laid the foundation for the ‘dot.com’ crisis was the rule-change which allowed the nation’s pension funds to own equities and the repeal of Glass-Steagall, which unleashed Wall Street upon a nation of unsuspecting investors.
The major banks could now use their massive balance sheet to engage in investment-banking, market-making, and proprietary trading. The markets exploded as money flooded the financial markets. Of course, since there were not enough ‘legitimate’ deals to fill demand and Wall Street bankers are paid to produce deals, Wall Street floated any offering it could despite the risk to investors.”
The distribution phase became evident in early-2000 as stocks began to struggle.
Names like Enron, WorldCom, Global Crossing, Lucent Technologies, Nortel, Sun Micro, and a host of others, are “ghosts of the past.” Importantly, they are the relics of an era the majority of investors in the market today are unaware of, but were the poster children for the “greed and excess” of the preceding bull market frenzy.
As the distribution phase gained traction, it is worth remembering the media and Wall Street were touting the continuation of the bull market indefinitely into the future.
Then, came the decline.
The Housing Boom
Following the “dot.com” crash, investors had all learned their lessons about the value of managing risk in portfolios, not chasing returns, and focusing on capital preservation as the core for long-term investing.
Okay. Not really.
It took about 27-minutes for investors to completely forget about the previous pain of the bear market and jump headlong back into the creation of the next bubble leading to the “financial crisis.”
During the mark-up phase, investors once again piled into leverage. This time not just into stocks, but real estate, as well as Wall Street, found a new way to extract capital from Main Street through the creation of exotic loan structures. Of course, everything was fine as long as interest rates remained low, but as with all things, the “party eventually ends.”
Once again, during the distribution phase of the market, the analysts, media, Wall Street, and rise of bloggers, all touted “this time was different.” There were “green shoots,” it was a “Goldilocks economy,” and there was “no recession in sight.”
They were disastrously wrong.
If any of this sounds familiar, it should
The “Buy Everything” Market
So, here we are, a 15-years into one of the longest bull market cycles in history. Massive interventions by the Federal Reserve and the Government have created an era of “moral hazard” unlike anything in previous market history. Investors are scrambling to take on leverage, make the most speculative of investments, and chase whatever trend is currently in vogue regardless of economic or financial underpinnings. It’s a winner take all market, and investors are reveling in it under the belief that if anything goes wrong the “powers that be” will bail them out.
Once again, due to the length of the “mark up” phase, most investors today have once again forgotten the “ghosts of bear markets past.” Despite some bumps along the way, the same messages seen at previous market peaks are steadily hitting the headlines: “there is no recession in sight,” “the bull market is cheap” and “this time is different because of Central Banking.”
However, the risk to investors in the current “buy everything” market, is an “unexpected, exogenous event” that sparks a revaluation of expectations in an overly leveraged, overly extended, and overly bullish market. That the event will be is unknown, but when the markets begin the “distribution phase,” investors should become exceedingly cautious about the risks they are taking.
Lost And Found
There is a sizable contingent of investors, and advisors, today who have never been through a real bear market. After a 15-year long bull-market cycle, fueled by Central Bank liquidity, it is understandable why mainstream analysis believed the markets could only go higher. What was always a concern to us was the rather cavalier attitude they took about the risk.
“Sure, a correction will eventually come, but that is just part of the deal.”
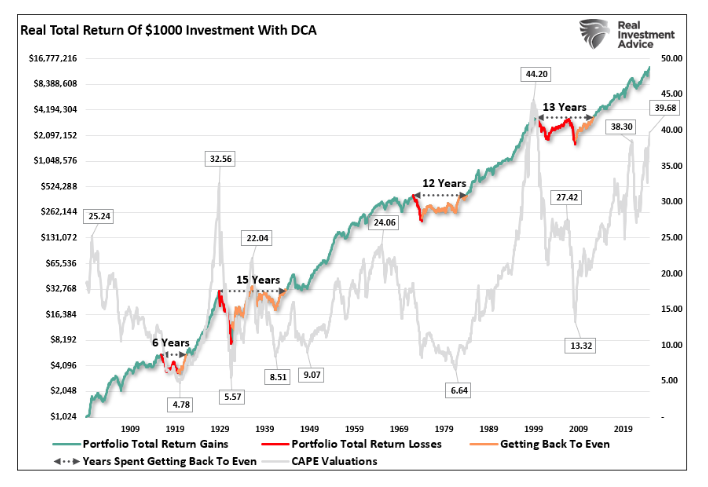
What gets lost during bull cycles, and is always found in the most brutal of fashions, is the devastation caused to financial wealth during the inevitable decline. It isn’t just the loss of financial wealth, but also the loss of employment, defaults, and bankruptcies caused by the coincident recession. This is the story told by the S&P 500 inflation-adjusted total return index. The chart shows all of the measurement lines for all the previous bull and bear markets, along with the number of years required to get back to even.
What you should notice is that in many cases bear markets wiped out essentially all or a very substantial portion of the previous bull market advance.
But that is the inherent problem of “eternal bullishness” which is the “willful blindness” to the underlying data in an effort to chase short-term returns. This leads to the unfortunate problem of being “all-in” on every hand which has a devastating consequence when a mean reverting event occurs.
John Hussman once penned an excellent piece on the full-market cycle:
“Put simply, most apparent “opportunities” to obtain investment returns above zero in conventional assets over the coming decade are based on a misunderstanding of valuations, total returns, and historical yield relationships. At current valuations, virtually everything is priced for a decade of zero. The unwinding of these speculative extremes is likely to be chaotic, and will likely occur over a shorter horizon than investors imagine. That chaos, driven not by central bank tightening but by an emerging default cycle, will usher in fresh investment opportunities in conventional assets, where presently there are none.
Looking beyond the near-term, my view is that a ‘permanently high plateau’ is unlikely, and we will instead see a violent unwinding of recent speculative extremes over the completion of the current market cycle, even if central banks ease aggressively, as they did throughout the 2000-2002 and 2007-2009 collapses. Corporate income growth and profit margins have already begun to narrow from their extremes, and the default cycle has already turned higher. The completion of this cycle won’t arrive because central banks suddenly become enlightened enough to abandon their recklessness. It will arrive precisely because they have sustained yield-seeking speculation for too long already; because they have amplified the vulnerability of the debt and equity markets to normal economic fluctuations; and because the consequences of this fragility are now fully baked in the cake.”
In the end, it does not matter IF you are “bullish” or “bearish.” The reality is that both “bulls” and “bears” are owned by the “broken clock” syndrome during the full-market cycle. However, what is grossly important in achieving long-term investment success is not necessarily being “right” during the first half of the cycle, but by not being “wrong” during the second half.
Lance Roberts is a Chief Portfolio Strategist/Economist for RIA Advisors. He is also the host of “The Lance Roberts Podcast” and Chief Editor of the “Real Investment Advice” website and author of “Real Investment Daily” blog and “Real Investment Report“. Follow Lance on Facebook, Twitter, Linked-In and YouTube Customer Relationship Summary (Form CRS)
Join RIA Advisors and elevate your career within a deeply experienced team focused on innovation. Our collaborative environment is built on a foundation of advanced technology and effective investment models, designed to enhance your ability to serve clients and grow your practice. Benefit from a supportive culture that encourages professional development and fosters a forward-thinking approach. By joining our team, you’ll be part of a group dedicated to excellence and continuous improvement, empowering you to focus on building meaningful client relationships and pursuing your business ambitions. Discover the advantages of working with our accomplished advisory team by starting your conversation today.
A message from Advisor Perspectives and VettaFi: Discover something new! Click here to register for our upcoming webcasts.
© Real Investment Advice
Read more commentaries by Real Investment Advice