The Latest Technical and Chart Developments
Membership required
Membership is now required to use this feature. To learn more:
View Membership BenefitsFOMC – Projects Faster Growth and Less Inflation
As expected the FOMC lowered the Funds rate by 0.25% and there were 3 dissents. Stephen Miran wanted a cut of 0.50%, and two district Presidents didn’t think a cut was warranted. Austan Goolsbee (Chicago) joined Jeffrey Schmid (Kansas City) who had dissented at the October 29 meeting (I incorrectly said Alberto Musalem St. Louis had dissented). I also thought that other FOMC members might register their opposition to a cut in the Dot Plot. The December 2025 Dot Plot shows that 6 members thought the Funds rate should have been held at 3.875%. By registering their view in the Dot Plot, rather than through a public dissent, they would show support for Chair Powell in response to the ongoing criticism he’s received from President Trump. “The Dot Plot is public but the Dots are never identified so guessing which Dot belongs to which FOMC member is less than certain. FOMC members can frankly provide their outlook via the Dots with a measure of anonymity, whereas a dissent is known.” Although there isn’t a way to know the identity of the additional dissents, and whether any of them were voters, my guess is that at least one of them was.
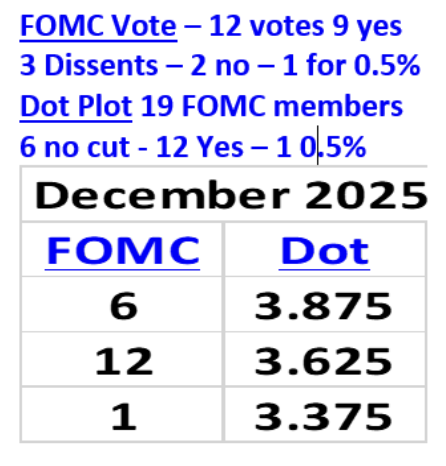
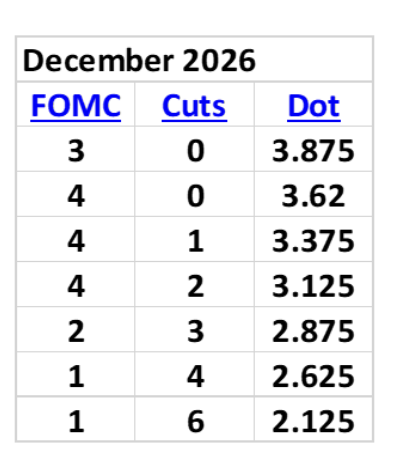
Last week I thought that “Investors will react more to the number of rate cuts the FOMC projects for 2026, than the rate cut that is widely expected and priced in on December 10. Wall Street could be disappointed if the number of projected cuts in 2026 is less than the 2 expected.” The Dot Plot and the Summary of Economic Projections indicated just one cut is coming in 2026. Three FOMC members think the Funds rate should be at 3.875% at the end of 2026, unchanged from October 29, 2025, and 4 members favor no cuts next year. Wall Street was expecting two cuts in 2026, so why did the market rally?
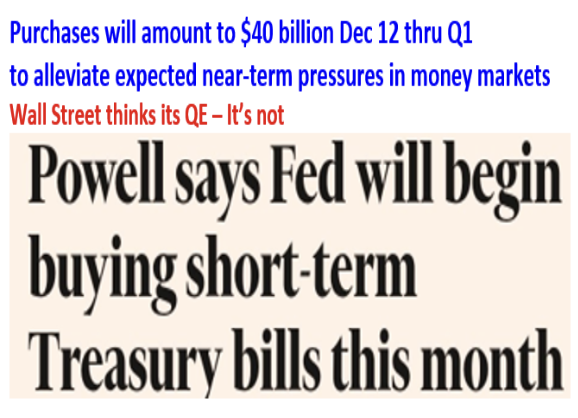
There were several reasons why Wall Street overlooked the less Dovish outlook for 2026. In his opening statement Chair Powell announced that the FOMC had authorized the Federal Reserve Bank of New York to begin purchasing $40 billion of Treasury Bills each month beginning on December 12. Some traders heard this news and concluded that this represented a small first step toward restarting Quantitative Easing. Investors have been conditioned to buy stocks when QE is running, even though Chair Powell attempted to set the record straight as he fielded questions about the T-Bill purchases. Chair Powell noted that the decision was prompted by money market functioning and didn’t amount to monetary easing. “We announced that we're resuming reserve management purchases. That is completely separate from monetary policy.”
In his opening statement Chair Powell said the purchases would address pressures in the overnight money markets. “As detailed in a statement released today by the Federal Reserve Bank 2 of New York, reserve management purchases will amount to $40 billion in the first month and may remain elevated for a few months to alleviate expected near-term pressures in money markets.”
One way to measure liquidity is to compare Excess liquidity (Bank Reserves plus Reverse Repo assets), divided by Commercial Bank Deposits. Excess Liquidity is abundant when the percent of Excess Liquidity is 21.0% or higher (blue dashed line), ample when it is between 16.0% and 21.0%, and tight when below 16.0% (tan dashed line). The percent was below 16.0% after the 2008 Financial Crisis and in 2018 and 2019 that led to the Repo crisis in September 2019.
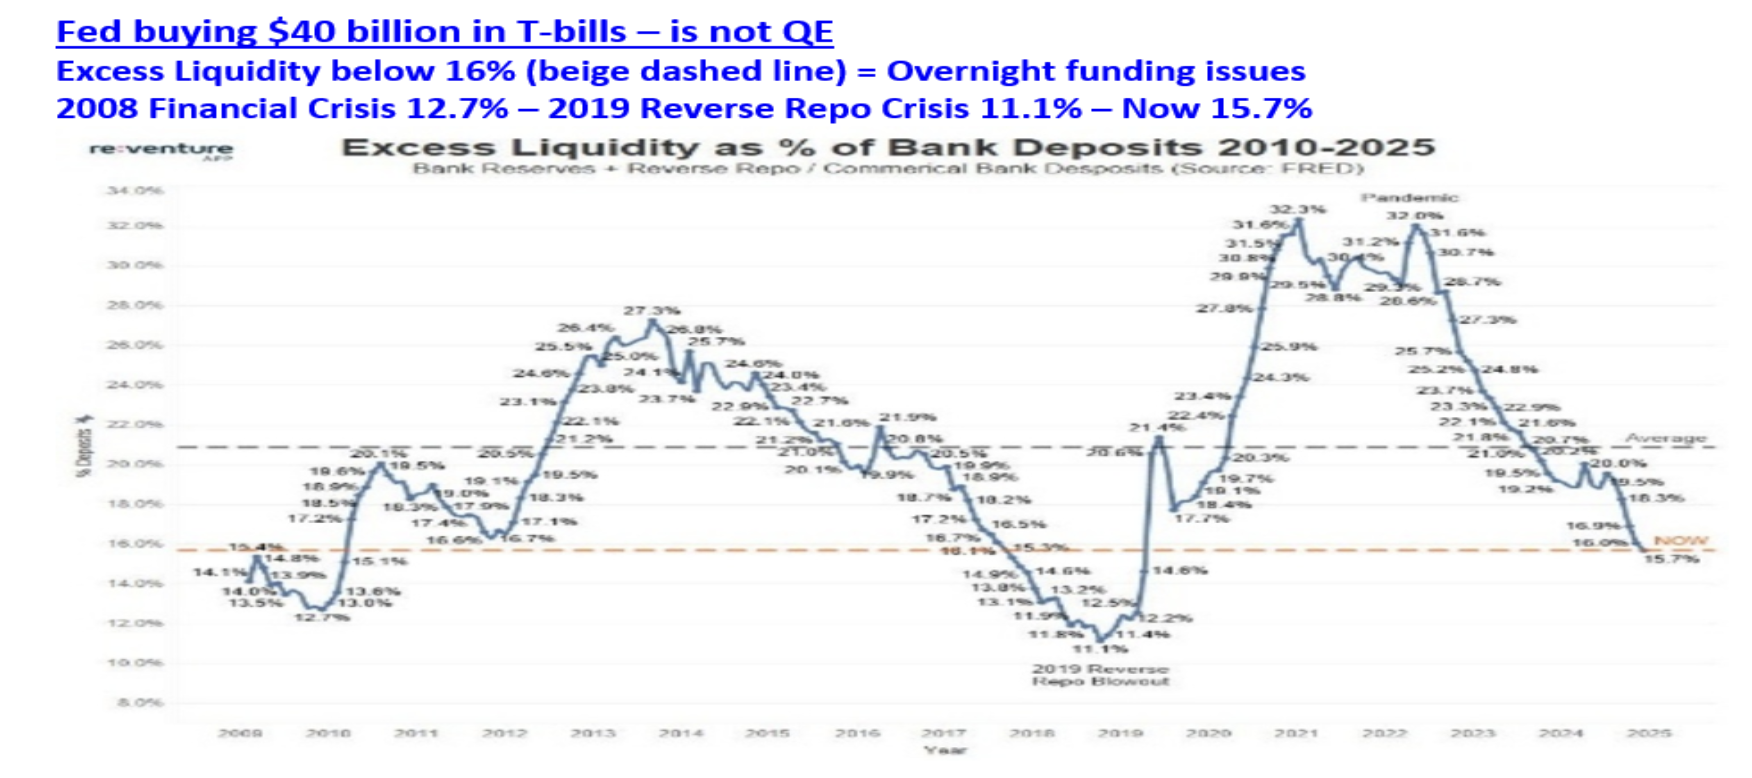
Chair Powell acknowledged that upward pressure on the Funds rate began to appear in overnight funding markets in September, which is why the FOMC decided to implement the T-Bill purchases on December 12. “The overnight reverse repo facility went down pretty much close to zero (It was $2.2 trillion in May 2023 and the Excess Liquidity percent was above 21%). And then, beginning in September, the federal funds rate started to tick up within the range.” When overnight liquidity is ample, the Funds rate holds near the mid-point of its range. Prior to the cut on December 10, the range was between 3.75% and 4.0%, so the mid-point was 3.875%. As overnight funding became less liquid, the Funds rate drifted above 3.875%. The T-bill purchases by the Fed will create a buffer of liquidity that reduces overnight money market stress.
Chair Powell noted that as corporations and individuals pays taxes, bank reserves decline. As taxes are paid the transfer of money from bank accounts to the Treasury causes banks to scramble for overnight funding. The Fed’s purchases of T-Bills are expected to keep overnight funding market functioning at a high level. This is why the purchases will continue through April 15. “April 15th is coming up, and our framework is such that we want to have ample reserves even at times when reserves are at a low level temporarily. So that's what happens on Tax Day. People pay a lot of 3 money to the government and reserves drop sharply and temporarily. So, this seasonal build up that we'll see in the next few months was going to happen anyway. It was going to happen because April 15th is April 15th. There's also a secular ongoing growth of the balance sheet. We have to keep reserves constant as it relates to the banking system or to the whole economy. And that alone calls for us to increase about $20-25 billion per month. So that's a small part. That's going on. It's also happening in the context of a temporary few month front loading to get reserves high enough to get through the tax period in mid-April.” The Fed’s upcoming purchases of T-Bills is far different than buying Treasury bonds from 2 years to 30 years, which is why calling it Quantitative Easing is not accurate.
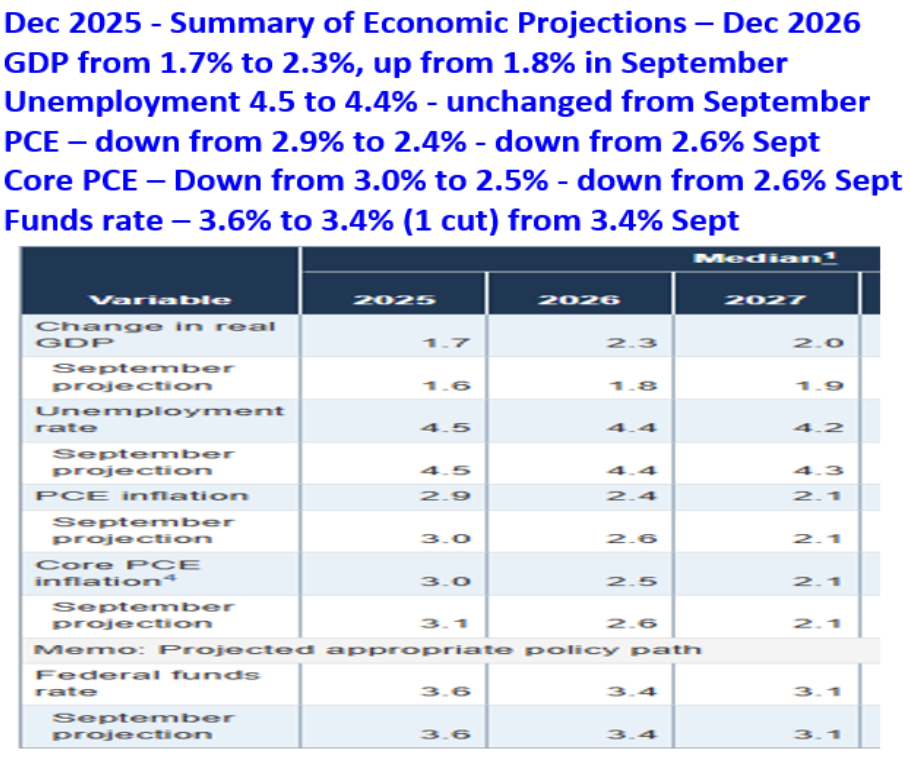
The Summary of Economic Projections for 2026 indicates a pick up in GDP, decline in PCE inflation, and a dip in the Unemployment Rate, which is a fairly optimistic view. The SEP projects an increase in GDP from 1.7% in 2025 to 2.3% in 2026. This looks like a big jump but Chair Powell explained that some of the increase was due to the government shutdown hurting GDP in Q4 and adding to GDP in 2026. “I mentioned that the SEP meeting is 1.7% for this year growth and 2.3% for next year. Some of that is due to the shutdown. You can take 2/10 out of 2025 and put it in 2026. So, it would really be 1.9 and 2.1. But, overall Fiscal policy is going to be supportive. And, as I mentioned, AI spending will continue.” Cyclical sectors rallied on the expectation that the economy would do better in 2026. The Russell 2000 broke out above the October high.
The SEP also provided a positive view for PCE inflation next year. The Headline PCE is projected to drop from 2.9% in 2025 to 2.4% in 2026, and the Core PCE is expected to drop to 2.5% from 3.0% in 2025. PCE inflation has been sticky in 2025, but Chair Powell explained that tariffs on goods are the main reason, but are expected to fall in 2026. “I think the evidence is kind of growing that what's happening here is services inflation coming down and that's offset by increases in goods, and that goods inflation is entirely in sectors where there are tariffs. If you get away from tariffs, inflation is in the low 2s. It's really tariffs that's causing most of the inflation overshoot. Let's assume there are no major new tariff announcements, inflation from goods should peak in the first quarter or so should be the peak.”
With the Funds rate closer to the Neutral rate and, no longer a reason to cut more, the labor market will be the main determinant and timing of any future rate cuts. In the first half of 2025 the labor market appeared to be on a solid footing, which was the main reason FOMC members thought they could be patient. That changed in August as reviewed in the October Macro Tides.
“On August 9 the Bureau of Labor Statistics (BLS) released its Benchmark revision of employment numbers from April 2024 through March 2025 which showed that -911,000 fewer jobs were created than previously reported. On September 5 the Labor Department announced that employers added just 22,000 jobs August and the Unemployment Rate ticked up to 4.3% from 4.2%. The revisions to prior months data were small (-21,000) compared to the July revision of -258,000 for May and June. Job growth in July was revised up by 6,000 (79,000 from 73,000), but June was shaved by -27,000 (from +14,000 to -13,000). The three-month revision was the largest revision outside of a recession since 1967. Job growth averaged just 29,000 for June, July, and August. The one-two punch from the August Employment report and Benchmark revisions raised concerns that the labor market had suddenly hit an air pocket.”
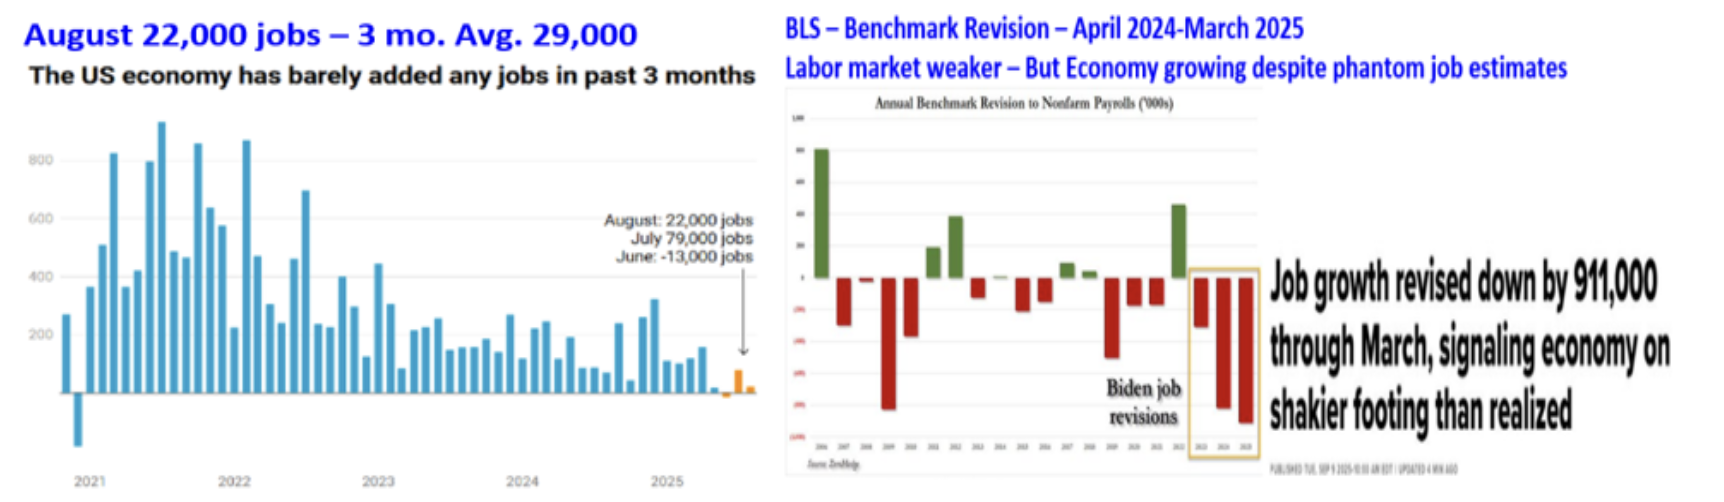
As Chair Powell explained he doesn’t believe the BLS has fixed the problem that caused job growth to be over stated from April 2024 through March 2025. “The gradual cooling in the labor market has continued. Unemployment is now up 3/10 from June through September. Payroll jobs averaging 40,000 per month since April. We think there's an overstatement in these numbers by about 60,000. So that would be negative 20,000 per month. It's a difficult situation where job creation may actually be negative, and now the supply of workers has also gone way down, so the unemployment rate hasn't moved that much. But, you know, it's a labor market that seems to have significant downside risks.”
The November Employment report will be released on Tuesday December 16 and indicate if the labor market has weakened further or is stable. The next FOMC meeting is on January 28, so FOMC members will have the December Employment report before the next meeting. Wall Street is focused more on the perceived ‘QE’, the sanguine outlook the economy, and lower inflation than the projection of just one rate cut in 2026. However, a pronounced weakening in the labor market could interject a dose of sobriety.
Dollar
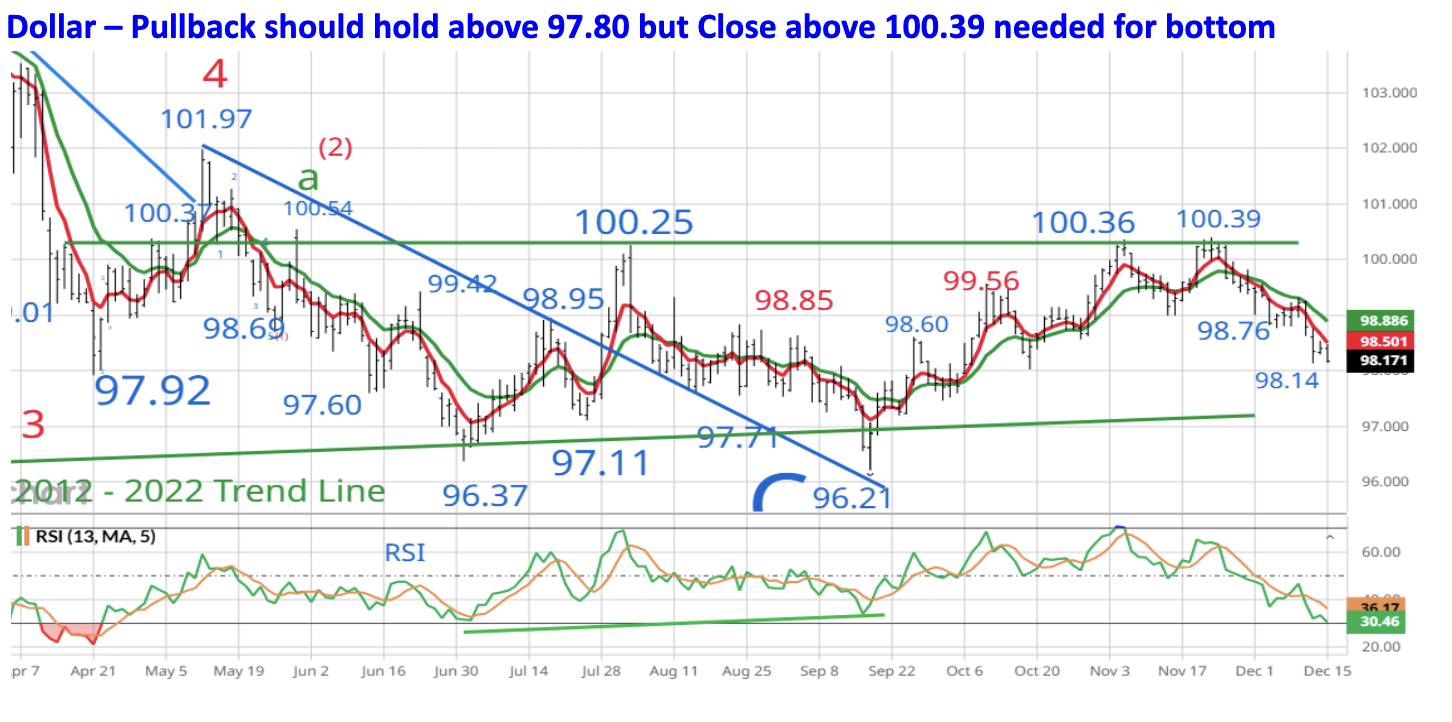
The Dollar weakened after the FOMC announced the Fed would start buying $40 billion in T-Bills on December 12. The increase for better GDP growth in 2026 in the SEP was overlooked, but is a positive as growth in the EU isn’t expected to improve. After reaching 100.39 the Dollar was expected to decline with 98.30 as the first target (50% retracement of the rally from 96.21 to 100.39), with the intra-day low of 98.03 on October 17 as the second target. The Dollar fell to 98.14 on December 15. The Dollar’s RSI (lower panel) is down to 30.4 so it is oversold, which is supportive of the Dollar bottoming soon. The 61.8% retracement of the rally from 96.21 is 97.80. So far, the pullback in the Dollar is normal, but the Dollar still needs to close above 100.39 to increase the odds that it bottomed in September at 96.21. Any bounce can be expected to put some downward pressure on Gold.
Treasury yields
The FOMC has lowered the Funds rate from 5.37% in September 2024 to 3.625% on December 10, but the 10-year Treasury yield has increased from 3.60% to 4.182% and the 30-year is up to 4.851% from 3.906% on September 16, 2024. Fundamentally, this action is bearish, even if we can’t know the reason why for this reaction with certainty. Technically, the charts suggest that the path of least resistance is for yields to increase in coming months.
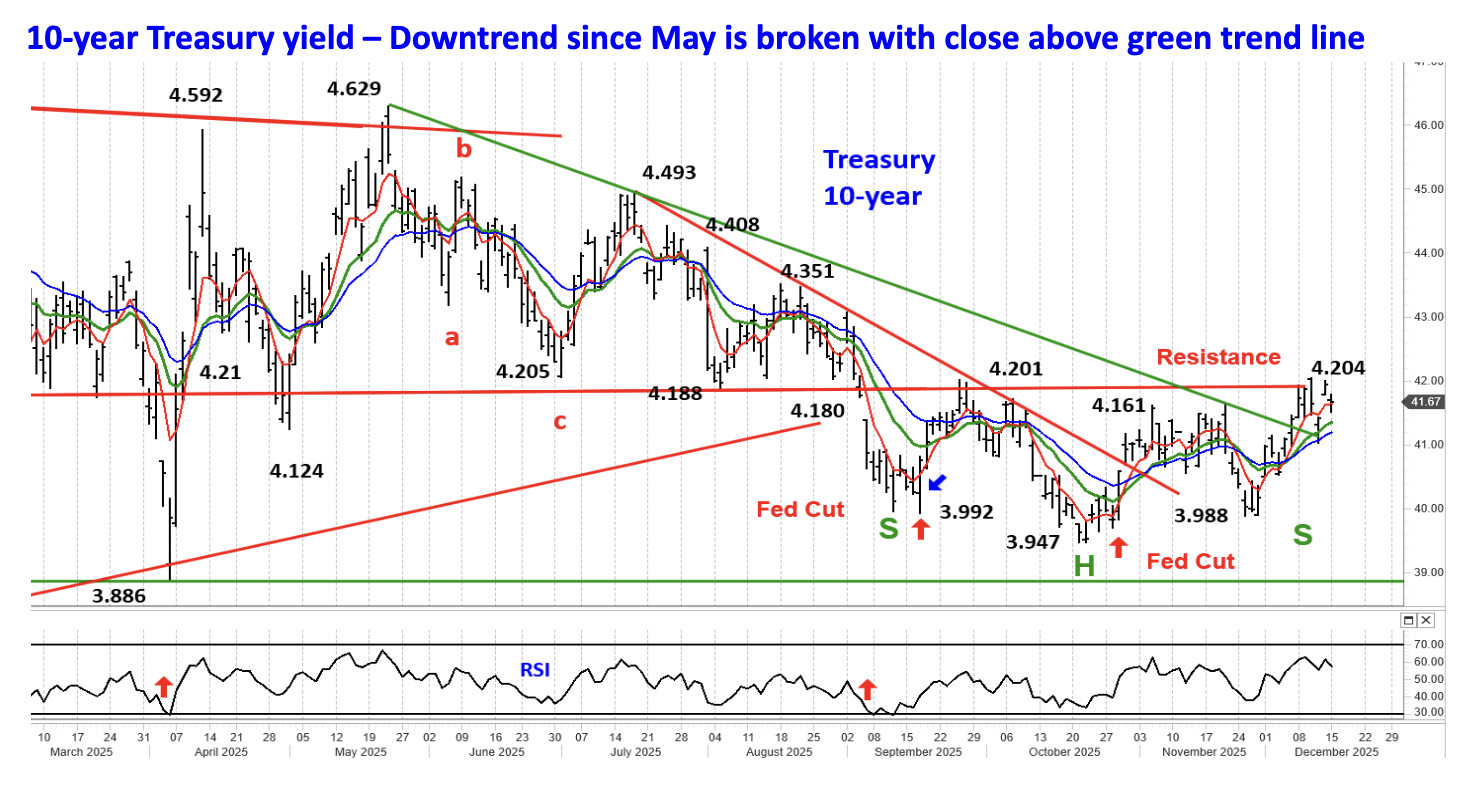
The 10-year yield has closed above the green downtrend line which has defined the downtrend in yields since the 10-year hit 4.629% on May 22. The 10-year yield has tested the key resistance at 4.20% (red horizontal line) and is expected to close above 4.20%. A close above 4.20% will confirm the Head and Shoulders pattern and be followed by a quick move up to 4.45%. The long term expectation is that the 10-year yield will breach 5.0%. This bearish outlook would become tempered if the 10-year yield closed below the green trend line near 4.09%.
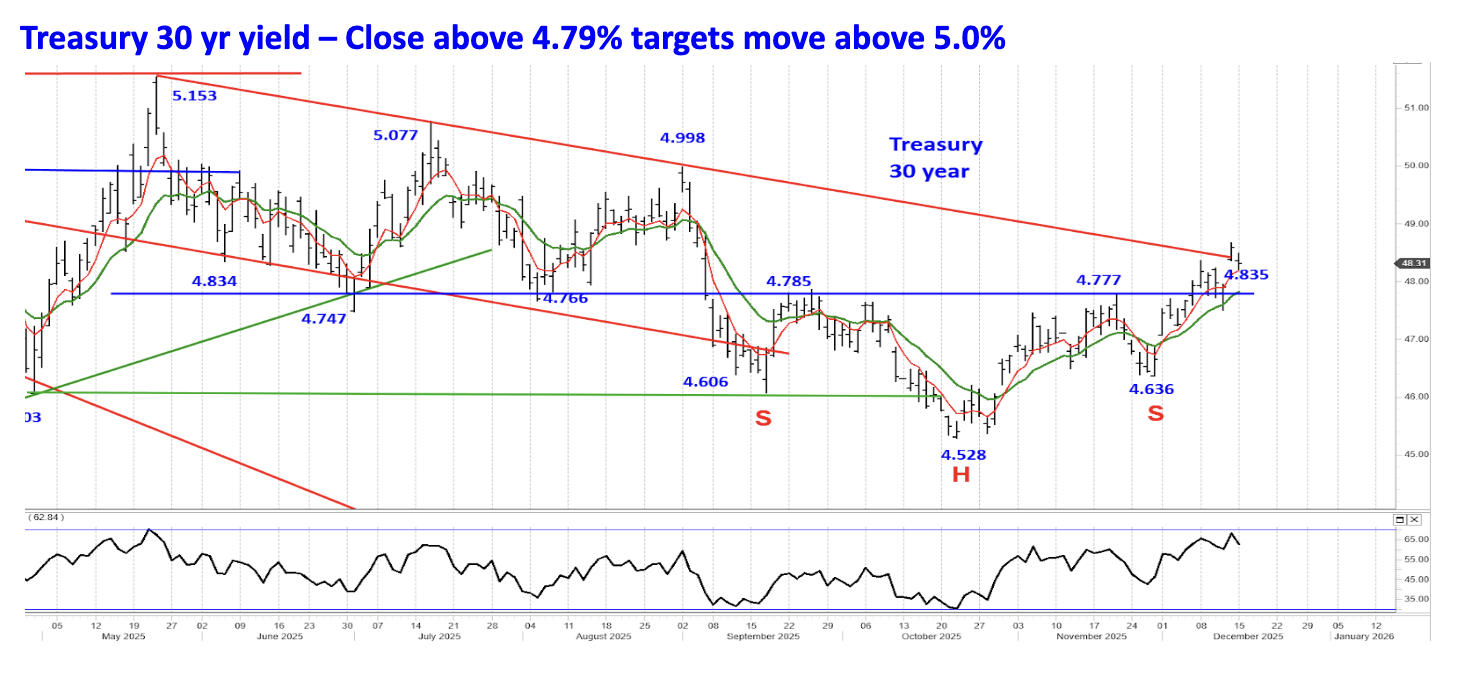
In the December 1 WTR I discussed the inverse Head and Shoulder pattern on the 30-year Treasury yield. On December 5 the 30-year yield closed above the Neckline at 4.785%, so the 30-year is leading the 10-year yield higher. As noted in the December 8 WTR, the breakout above the Neckline by the 30-year yield should be followed by a quick move up to and modestly above 5.0%. (Neckline 4.785% minus Head 4.528% (0.257%) plus Neckline = 5.042%. The red downtrend line from 5.153% has posed some resistance (near 4.83%), but is expected to be breached. This bearish outlook would become tempered if the 30-year yield closed below 4.75%.
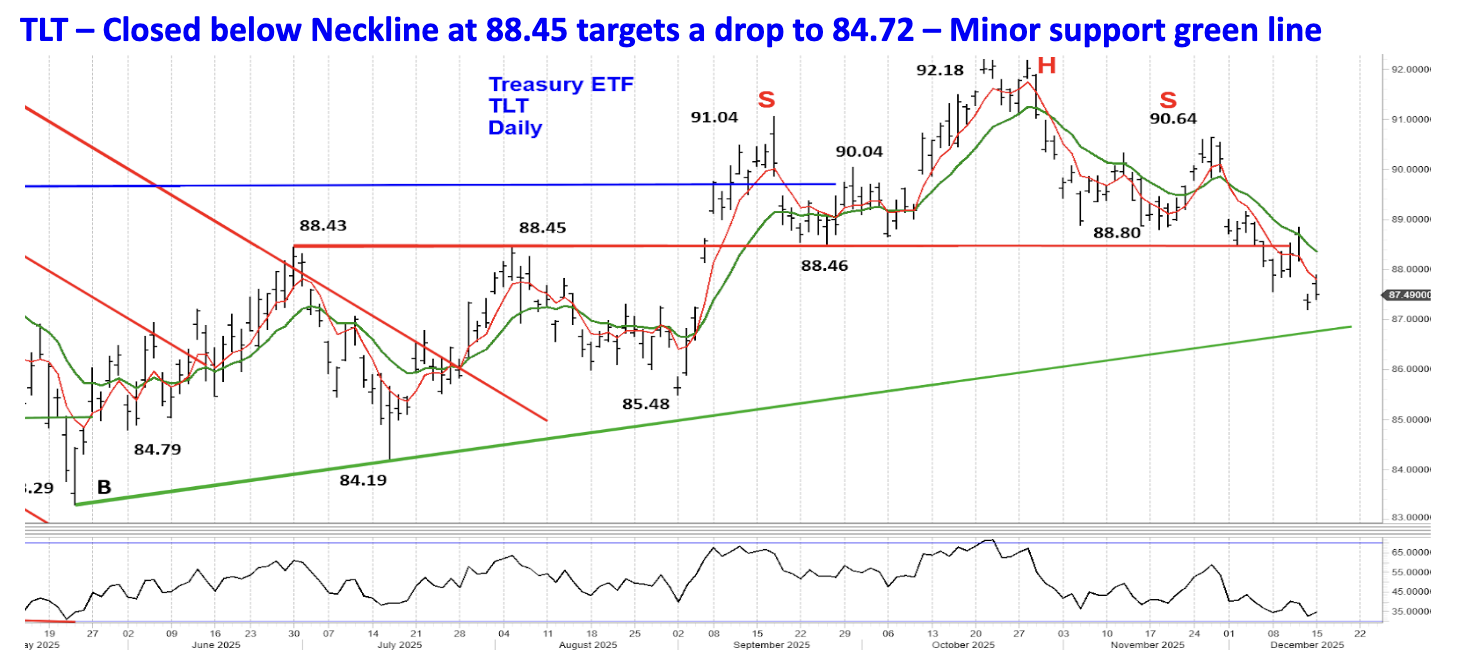
On December 5 TLT closed below 88.45 completing the Head and Shoulders top. The break below the Neckline at 88.445 targets a decline to 84.72, although the green trend line near 86.80 could provide some short term support via a bounce.
Stocks
The stock market should be able to ignore the initial increase in Treasury yields since the economy is OK and earnings are forecast to increase about 14% in 2026. My guess is that the stock market will begin to pay attention if / when the 10-year yield climbs above 4.50% and the 30-year moves above 5.0%. Higher Treasury yields above those levels will pressure valuations, and cause the S&P 500’s Price / Earnings Ratio to compress. The stock market will struggle in a more significant manner if / when the 10-year is above 5.0% and the 30-year pushes above 5.15%.
The Russell 2000 bettered its October high by 2.0% last week and set a new all-time high. The Dow Jones Industrials exceeded its October high by 1.5% as it also set a new all-time high. However, the S&P 500 and Nasdaq 100 recorded a lower high, and the Semiconductor Indexed reversed lower after hitting a new high. The Advance – Decline Line almost a made a new high but came up short. These divergences show that there is a level of fragmentation within the market, which is a sign of stress.
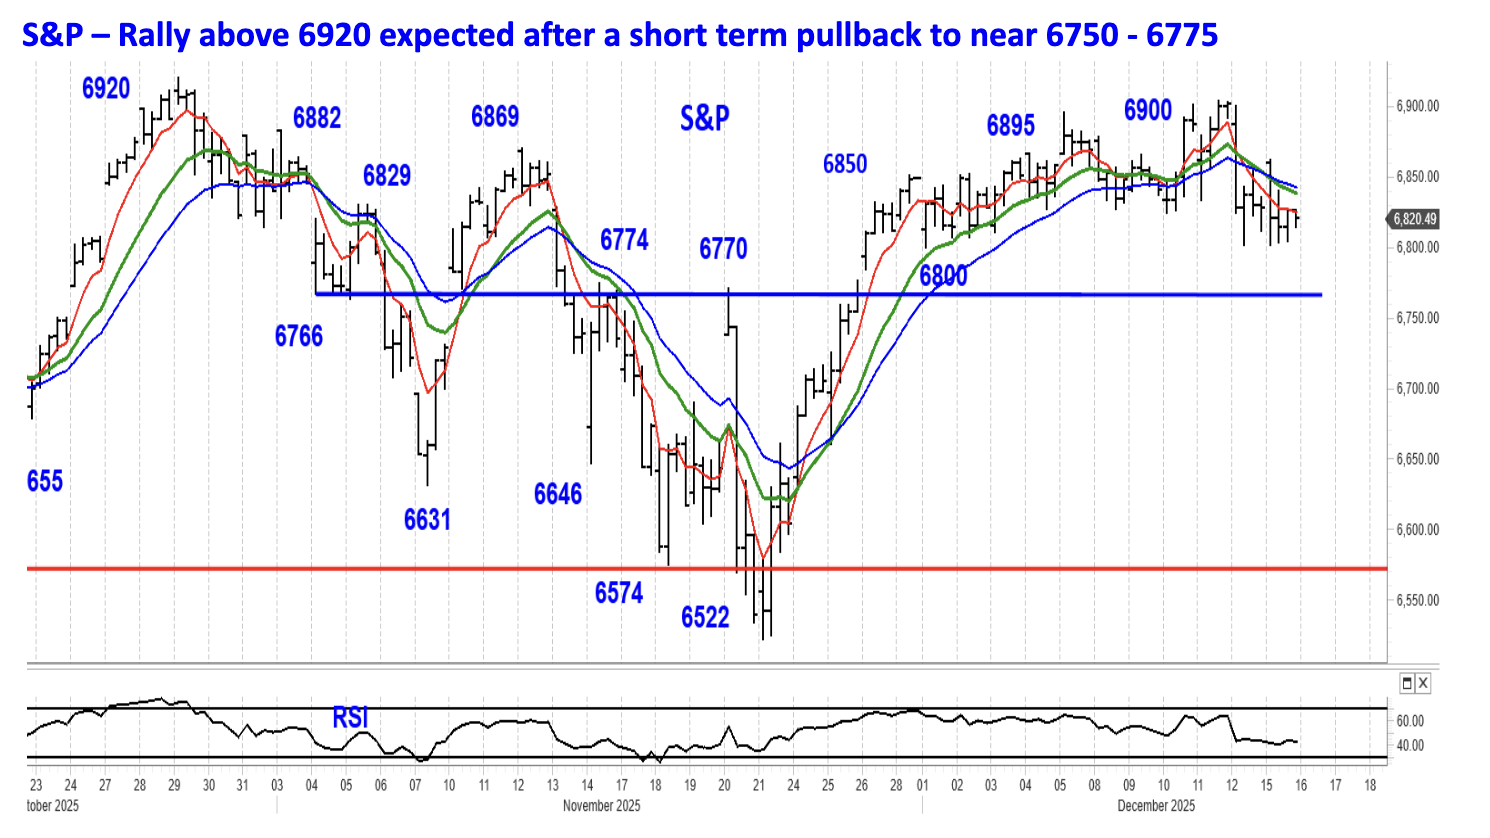
The S&P 500 has been expected to drop to 6750 – 6775 and these divergences are supportive of that. The S&P 500 has been testing and holding above 6800, so a drop below 6800 should be followed by more weakness. The 38.2% retracement of the rally from 6522 to 6895 is 6752, which is just below the blue horizontal trend line connecting pivot points at 6766, 6774, and 6770.
As noted in recent WTR’s, seasonality is favorable going into year end and most individual investors will be reluctant to sell winners before year end, so capital gains taxes can be postponed until April 2027. Institutional investors will also be reluctant sellers since they want to show they are exposed to the AI trade and its great promise. After year-end these positive dynamics will diminish. These are the reasons why the market can hold up into early 2026 despite near term volatility, with the S&P 500 ultimately managing to rally above 6920. A close below 6650 would call this constructive outlook into question.
Gold
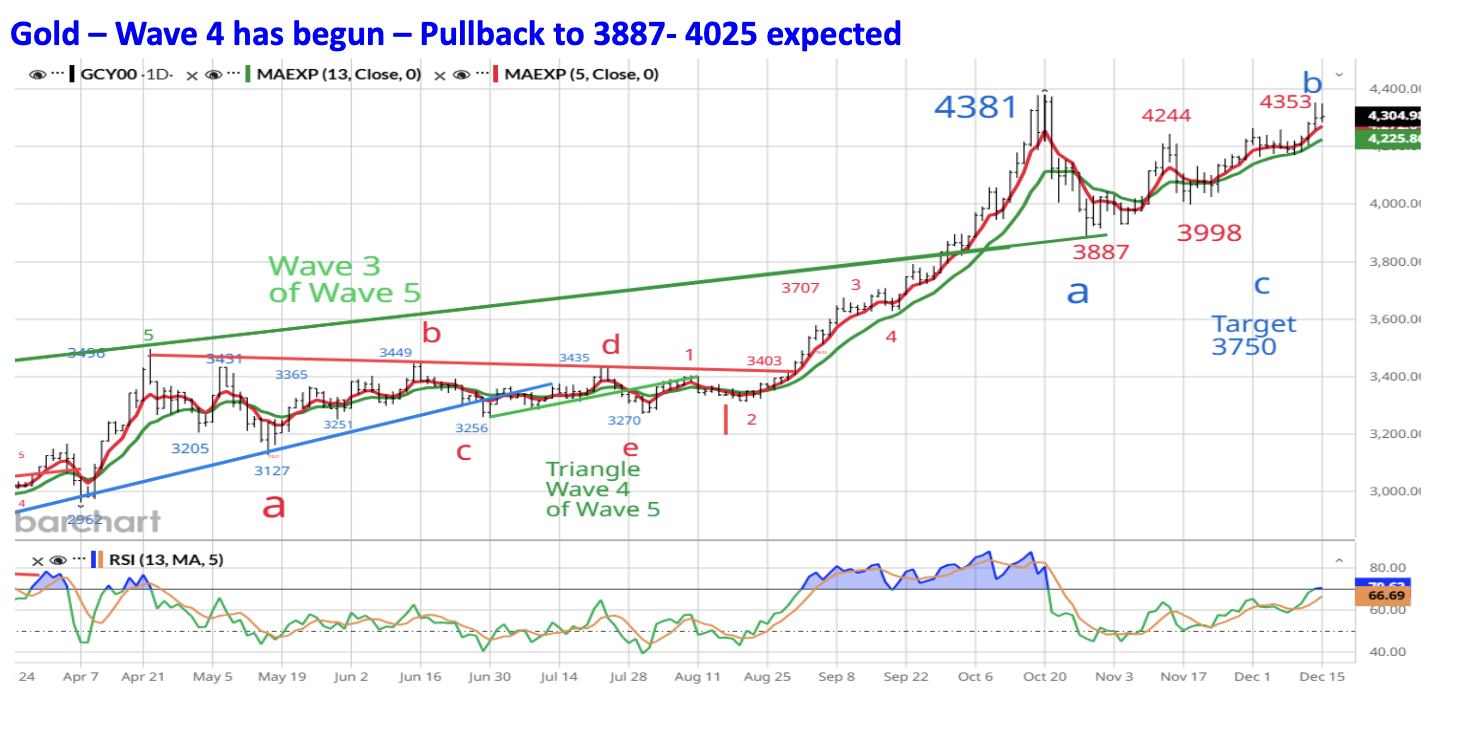
Gold was expected to decline below 3887 and possibly down to 3750 or 3325, if Gold retraced 38.2% of Wave 3 (4381 – 1616 September 2022 Wave 2 low). As discussed in the December 1 WTR, the rally to 4244 increases the odds that Gold will spend more time chopping sideways than experiencing a large price decline as Wave 4 unfolds. In April, a sharp decline to 3197 from 3496 was followed by months of choppy trading with Gold never taking out the initial low of 3127.
The weaker Dollar after the FOMC meeting and belief the FOMC is launching QE Lite, helped Gold to rally to 4353 on December 12. Despite this resilience, Gold is expected to decline in coming weeks and months. The key to the intermediate term is whether the next decline holds above 3887. If it does, the odds of a decline to 3325 will diminish, and the odds of months of choppy trading will increase. From a trading perspective, buying if / when Gold drops below 4025 will make sense. The stop would be 3887, since a decline below 3887 would open the door for a drop to 3750 or 3325.
Silver made a new all-time high last week, but Gold has failed to confirm it (so far – 4353 vs. 4381). This represents an inter market divergence, and is a sign of below the surface stress that often appears just before a correction in the Metals.
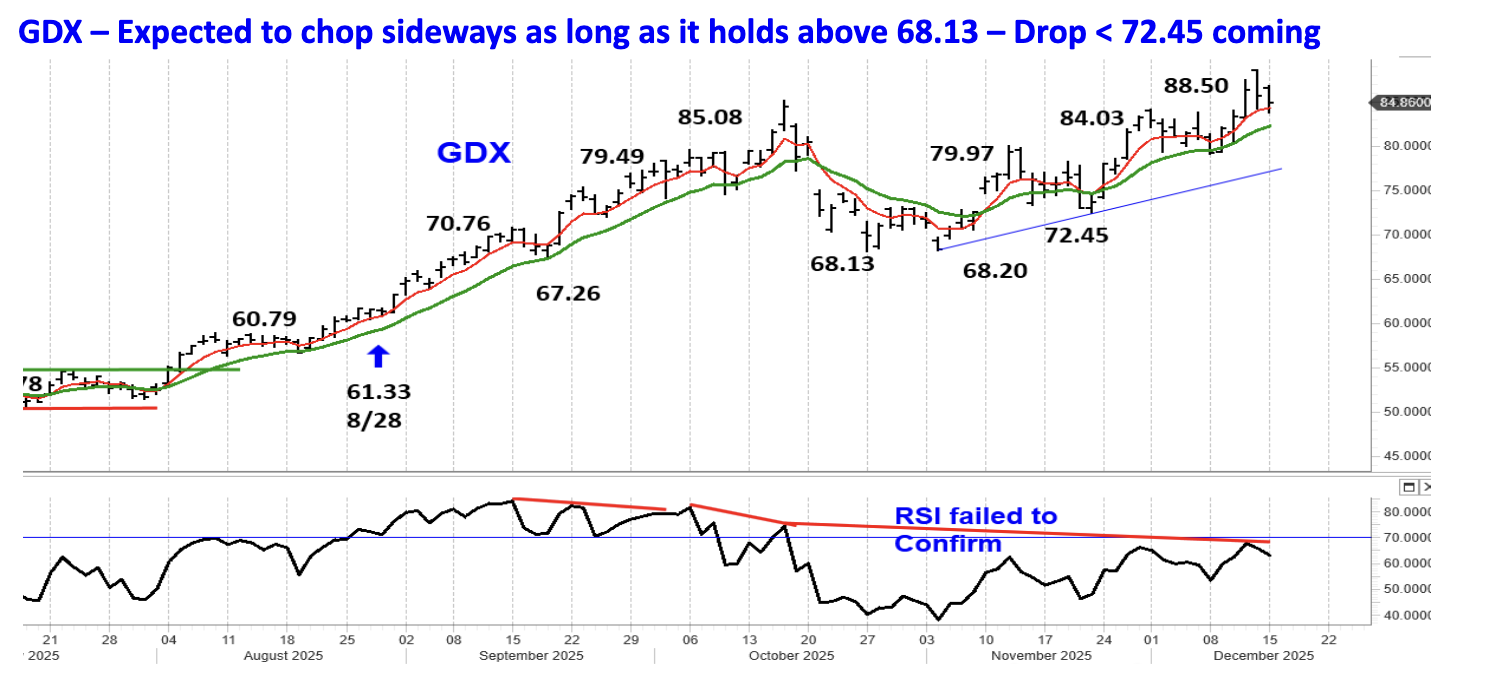
Gold Stocks
The resilience in Gold enabled GDX to rally to another new high. On Friday GDX gapped higher and recorded its high on the opening (88.50), which is a sign of peak emotional enthusiasm. The additional strength doesn’t change the expectation that GDX will decline in coming months. The upcoming correction will likely spend more time going sideways than falling below 68.13 or dropping to 62.67. GDX is still expected to drop below 72.45 during the next correction, which could provide a trading opportunity, since the stop would be 68.13. We’ll cross that bridge if and when GDX falls below 72.45.
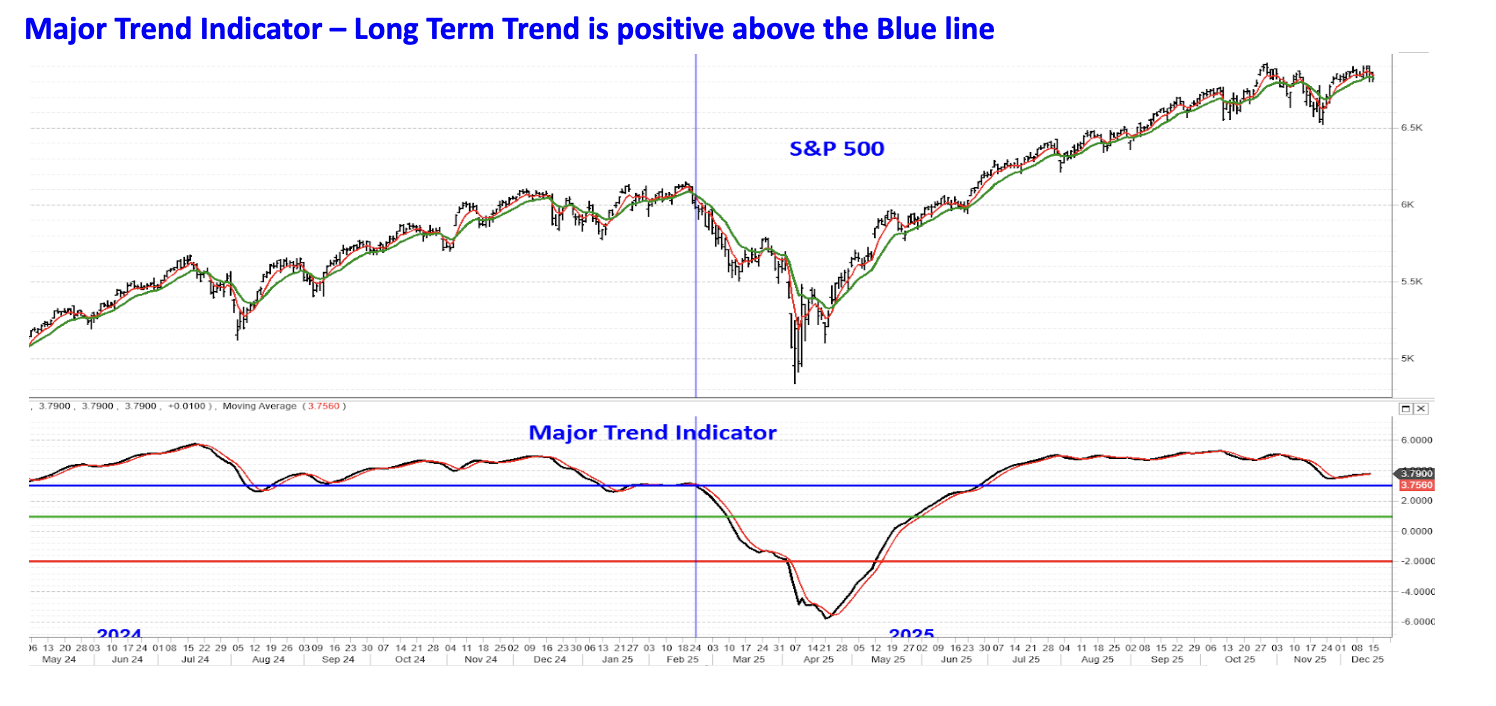
Major Trend Indicator
The Major Trend Indicator has been indicating that a decline of more than -7% wasn’t likely and that’s been the case. Although the MTI is above the blue horizontal line, the gap has narrowed. The rally from 6522 though, has arrested the decline in the MTI and helped it rebound a bit. This should buy the market more time and suggests a rally above 6920 is still in the cards.
If the MTI falls below the blue horizontal line the odds will increase that the S&P 500 will decline below 6522 and signal the onset of an intermediate decline. I think that’s coming in 2026.
Bear market declines in 2022 and 2025 didn’t occur until after the MTI fell below the blue horizontal blue line, and a good reason to sell materialized. In 2022 it was FOMC aggressive rate increases and a huge increase in reciprocal tariffs in 2025.
In 2026, there could be more than one reason why the market struggles. Treasury yields are expected to increase with the 10-year climbing above 5.0%. An increase of this magnitude would pressure high P/E stocks since higher rates usually causes multiples to compress. Higher Treasury yields can be expected to pressure the Russell 2000 as the increase in yields puts more stress on the economy.
In 2026 another reason will likely be a reckoning between the enormous spending on AI and a realistic assessment of investment returns as discussed in the November Macro Tides. “Revenues will have to grow so much in the next few years to justify all the spending on AI that a valuation hangover seems unavoidable. I have no idea if the coming AI hangover will mimic the Dot.com and fiber optic wipeout, or merely be a take two aspirin and an Alka Selzer type of hangover. What I am confident about is that at some point investors will realize that a gap exists between where the AI stocks are trading and an economic reality that is less than all the hype currently accepted without question. It’s not if, but when AI companies and investors experience Déjà vu all over again.”
After July 4 the looming mid-term elections could be a problem if it looks like the Democrats have a good chance of gaining control of the House. That development would virtually cripple President Trump’s agenda, which stocks may not like as progress on any issue will grind to a halt.
The Daily Shot A number of charts in this letter were from The Daily Shot.
Jim Welsh
A message from Advisor Perspectives and VettaFi: Discover something new! Click here to register for our upcoming webcasts.
Membership required
Membership is now required to use this feature. To learn more:
View Membership BenefitsSponsored Content
Upcoming Virtual Events View All


