Key Takeaways
- Bonds, once viewed as a reliable hedge against risk, took on the role of “risk accelerator” since 2021 as inflation shifted traditional stock/bond correlations from negative to positive. This trend is now showing signs of a reversal.
- As inflation has slowed in recent years, it has also become less volatile. With anticipation of further Fed easing and likely expansion of the central bank’s balance sheet, Russ believes that bonds could once again fill the role of a traditional portfolio diversifier.
For the better part of 20 years bonds offered little yield but effective diversification. From the aftermath of the internet bubble through the pandemic, stock/bond correlations were consistently negative, making a Treasury bond an effective portfolio hedge.
Unfortunately, starting in 2021 that relationship abruptly shifted. A sharp and abrupt rise in inflation turned bonds from a risk mitigant to a risk accelerator. However, that dynamic may be in the process of changing, suggesting that bonds may once again start to provide some portfolio diversification.
Inflation elevated, but less volatile
As I’ve discussed in previous blogs, shifting stock/bond correlations marked a paradigm shift relative to the 2000-2020 period. What changed? Inflation. The re-emergence of inflation fundamentally shifted stock/bond correlations as higher prices became as much of a risk to markets as slowing growth.
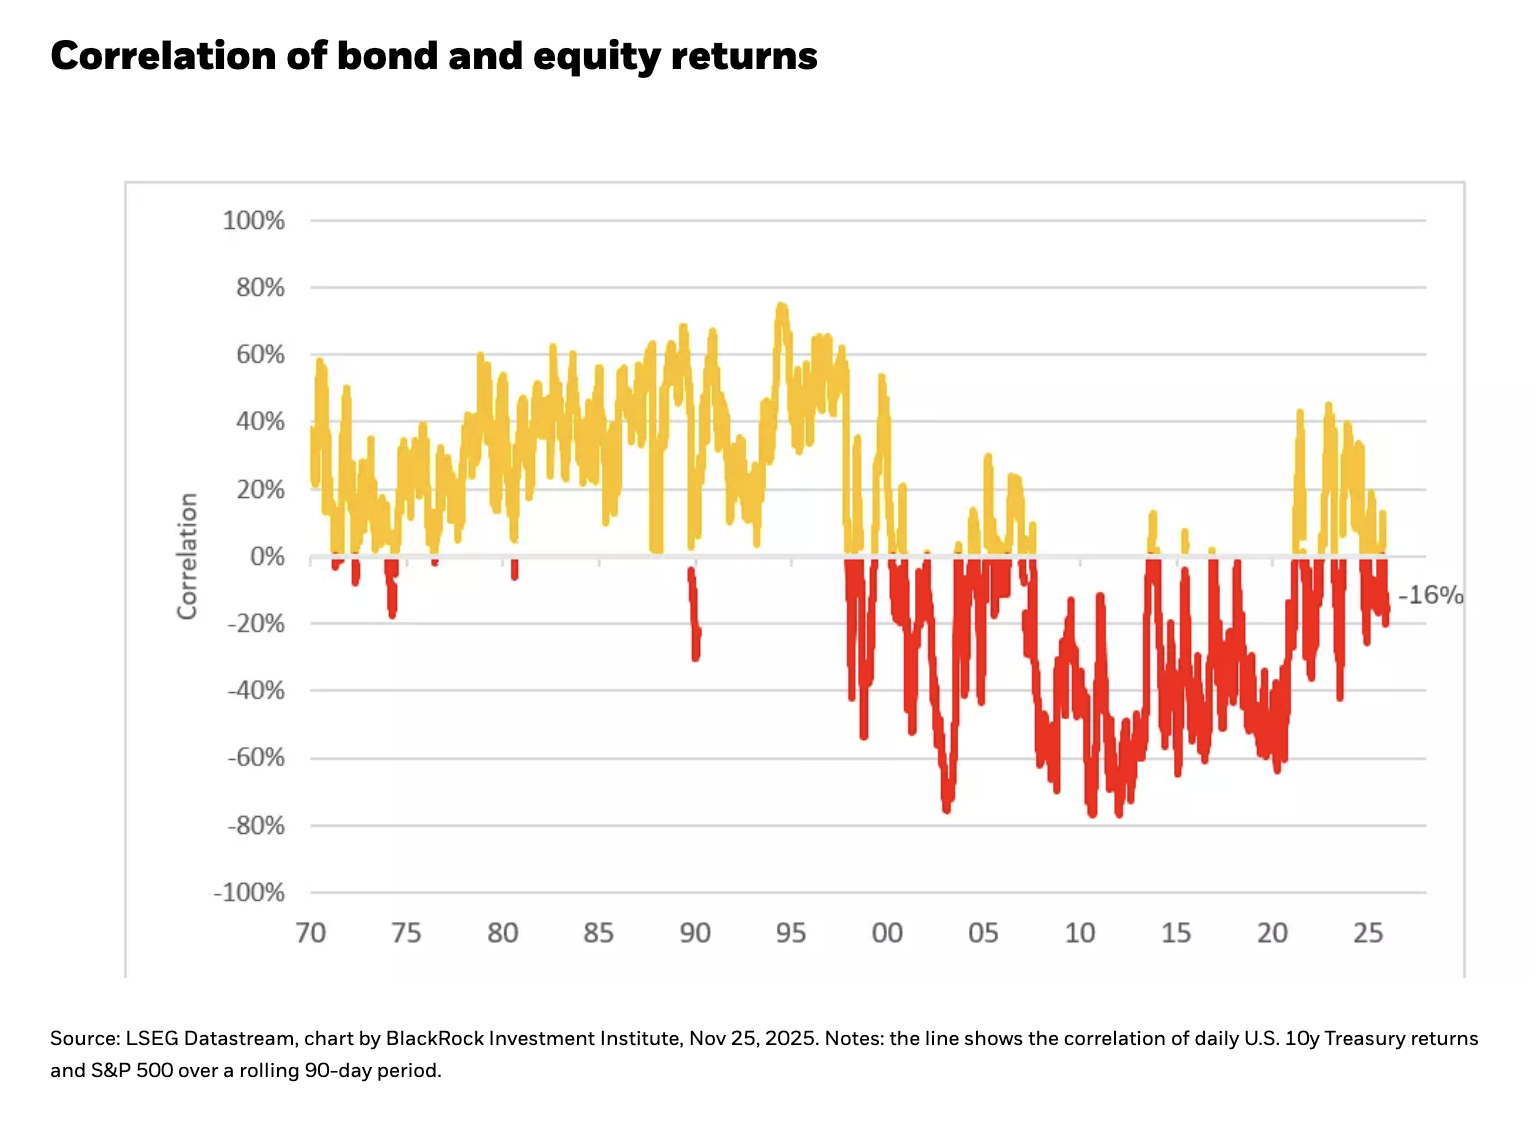
Today, while inflation remains above the Fed’s 2% target, it has slowed dramatically, with most measures of core inflation running between 2.5% and 3.0%. This moderation has led to some mean reversion in stock/bond correlations. For much of the past two years, stocks and bonds have traded with a correlation close to zero, suggesting no statistically significant pattern in how they trade relative to each other. Most recently the correlation has reverted to slightly negative (see Chart 1).

What may be changing? Inflation remains elevated but is becoming less volatile. Historically, this has been important for how stocks and bonds trade. In other words, it is not just the level of inflation that influences investor behavior but also the stability, or lack thereof, of inflation.
Today, the volatility of inflation, measured using the standard deviation of monthly readings, is falling fast. The three-year standard deviation is at its lowest level since the spring of 2020 and back near its post-2008 average. In the past, this level of volatility has been associated with modestly negative stock/bond correlations.
Another factor favoring a reversion towards negative stock/bond correlations: Fed easing and the likelihood that it will once again begin expanding its balance sheet. Both developments support easier financial conditions, a dynamic which would also favor a negative stock/bond correlation.
Stabilizing inflation + Fed easing = more negative stock/bond correlations
Following two years of +20% gains and a more than respectable +16% gain year-to-date, investors could be forgiven for not obsessing over hedges. But as we witnessed in October, elevated valuations, crowded trades and lingering AI concerns may make for a more volatile 2026, even if equities continue to advance. Finding ways to effectively diversify a multi-asset portfolio allows investors to maintain their strategic equity allocation while managing risk. We may be entering a period when bonds can, at least in part, start to once again fulfill that function.
Russ Koesterich, CFA, is a Portfolio Manager for BlackRock's Global Allocation Fund and Lead Portfolio Manager for BlackRock’s Global Allocation (GA) Selects Model Portfolios and is a regular contributor to Market Insights.
To obtain more information on the fund(s) including the Morningstar time period ratings and standardized average annual total returns as of the most recent calendar quarter and current month end, please click on the fund tile.
The Morningstar RatingTM for funds, or "star rating", is calculated for managed products (including mutual funds, variable annuity and variable life subaccounts, exchange-traded funds, closed-end funds, and separate accounts) with at least a three-year history. Exchange-traded funds and open-ended mutual funds are considered a single population for comparative purposes. It is calculated based on a Morningstar Risk-Adjusted Return measure (excluding any applicable sales charges) that accounts for variation in a managed product's monthly excess performance, placing more emphasis on downward variations and rewarding consistent performance. The top 10% of products in each product category receive 5 stars, the next 22.5% receive 4 stars, the next 35% receive 3 stars, the next 22.5% receive 2 stars, and the bottom 10% receive 1 star. The Overall Morningstar Rating for a managed product is derived from a weighted average of the performance figures associated with its three-, five-, and 10-year 60-119 months of total returns, and 50% 10-year rating/30% five-year rating/20% three-year rating for 120 or more months of total returns. While the 10-year overall star rating formula seems to give the most weight to the 10-year period, the most recent three-year period actually has the greatest impact because it is included in all three rating periods.
A message from Advisor Perspectives and VettaFi: Discover something new! Click here to register for our upcoming webcasts.
Carefully consider the Funds' investment objectives, risk factors, and charges and expenses before investing. This and other information can be found in the Funds' prospectuses or, if available, the summary prospectuses, which may be obtained by visiting the iShares Fund and BlackRock Fund prospectus pages. Read the prospectus carefully before investing.
Investing involves risk, including possible loss of principal.
Fixed income risks include interest-rate and credit risk. Typically, when interest rates rise, there is a corresponding decline in bond values. Credit risk refers to the possibility that the bond issuer will not be able to make principal and interest payments.
This material is not intended to be relied upon as a forecast, research or investment advice, and is not a recommendation, offer or solicitation to buy or sell any securities or to adopt any investment strategy. The opinions expressed are as of December 2025 and may change as subsequent conditions vary. The information and opinions contained in this post are derived from proprietary and nonproprietary sources deemed by BlackRock to be reliable, are not necessarily all-inclusive and are not guaranteed as to accuracy. As such, no warranty of accuracy or reliability is given and no responsibility arising in any other way for errors and omissions (including responsibility to any person by reason of negligence) is accepted by BlackRock, its officers, employees or agents. This post may contain “forward-looking” information that is not purely historical in nature. Such information may include, among other things, projections and forecasts. There is no guarantee that any forecasts made will come to pass. Reliance upon information in this post is at the sole discretion of the reader.
Past performance is no guarantee of future results. Index performance is shown for illustrative purposes only. You cannot invest directly in an index.
Prepared by BlackRock Investments, Inc. LLC. Member FINRA.
©2025 BlackRock, Inc. or its affiliates. All rights reserved. BLACKROCK is a trademark of BlackRock, Inc. or its affiliates. All other trademarks are those of their respective owners.
FFI1225-5070366-EXP1226
© BlackRock
Read more commentaries by BlackRock