SUMMARY
- Neither valuation, leverage nor sentiment reflect ‘Bubble’ behavior yet, in our view.
- Base Case: Further upside for US stocks, due to AI spending, an accommodative Fed, and no recession.
- In 2026, we are watching risks related to credit, inflation and Fed policy; 2nd years in Presidential cycles are typically volatile.
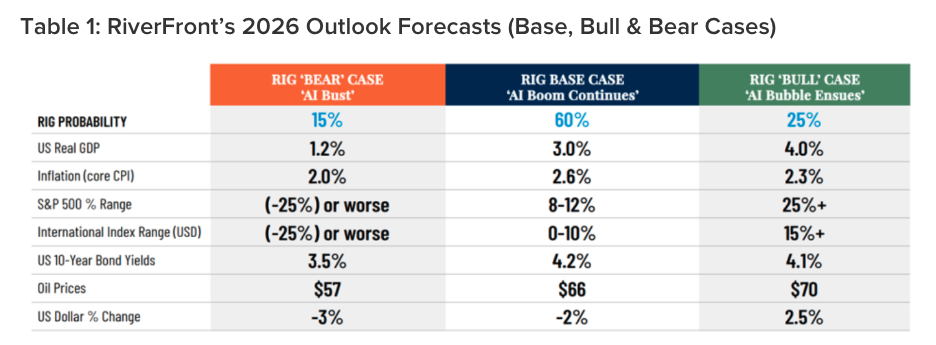
RiverFront’s Investment Team is proud to present the summary of our 2026 Outlook, which will be released this Friday, December 19th. In 2025, the tech-heavy US stock market rode a wave of AI awareness and spending. In ’26, our Base Case (see Table 1, below) is that this spending ‘Boom’ will continue – thereby avoiding a recessionary ‘Bust’ – but with enough emotion and controversy to avoid ‘Bubble’ mania. We continue to favor stocks over bonds, and US assets over international.
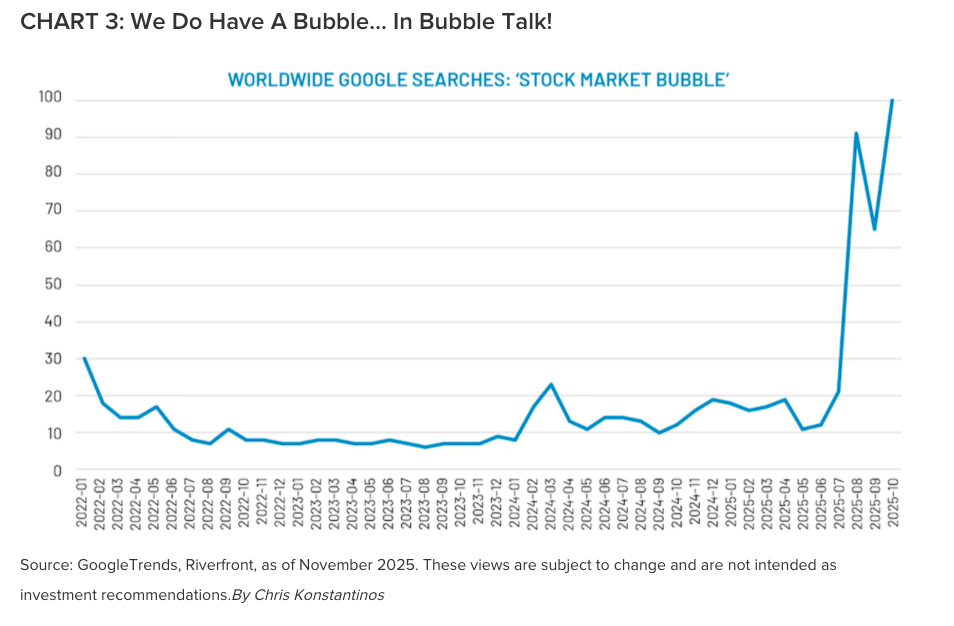
The question we fielded most often this year was “are we in a market bubble?” Judging by the near-record number of Google searches in Q4 for ‘stock market bubble’ (see Chart 3, last chart below), we do appear to have a ‘bubble’ in bubble concerns! All kidding aside, cautious sentiment like this may be one of the clearest indicators that the stock boom still has room to go, in our view.
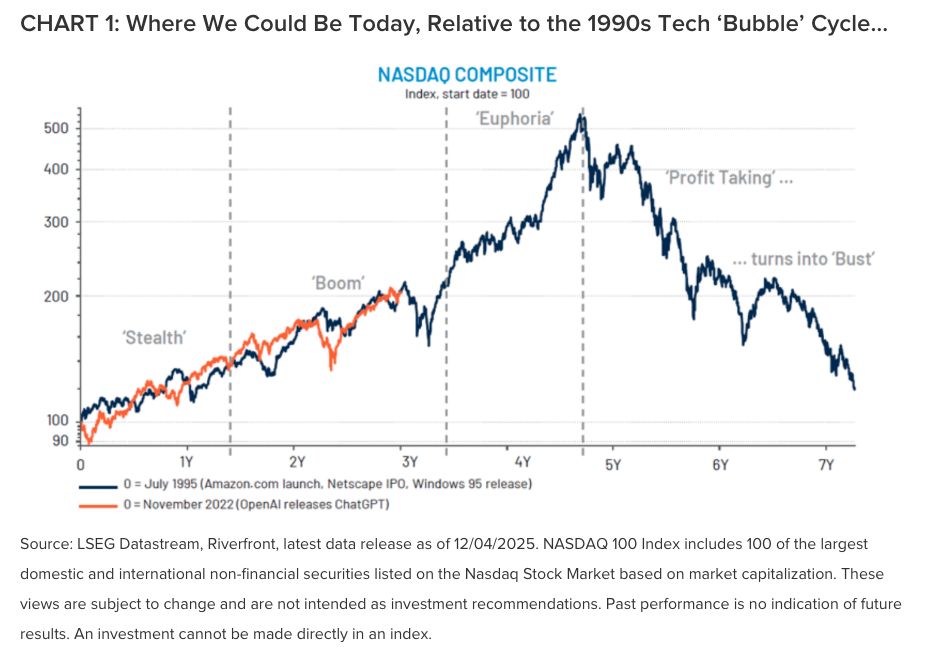
Bubbles are only obvious in retrospect. But, in studying classic US bubbles in the 1920s and the 1990s, neither valuation, leverage nor sentiment today resembles ‘Euphoria’-stage bubble behavior, in our view. And if tech spending eventually does cause a bubble, it is our belief that we are only in the ‘Boom’ phase of that bubble anatomy…suggesting that the most powerful part of the bull market may still be ahead of us. Mapping the recent Nasdaq rally that started with the release of Chat-GPT in late 2022 onto the 1994-2001 stock experience lends some credence to this view (Chart 1, after Table 1, below).
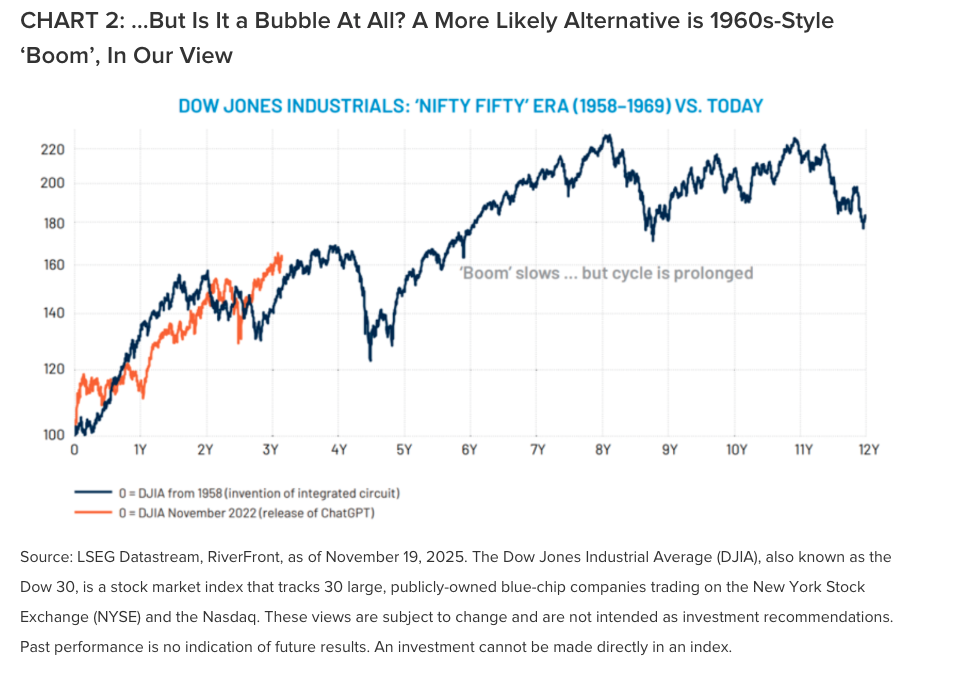
However, a better analog may instead be the growth stock ‘boom’ of the late 1950s and 1960s, as epitomized by the Dow Jones (DJIA – see Chart 2, below). Similar to today, this period experienced elevated economic growth, inflation, and stock valuation, driven by tech-led productivity gains and a growing consumer demographic. If the 50s and 60s are any guide, we may only be in the early stages of what could be a less powerful but more sustained stock ‘Boom’… rather than in the midst of a euphoric ‘Bubble’.

The table above depicts RiverFront’s predictions for 2026 using three scenarios (Pessimistic (Bear), Base, and Optimistic (Bull)). Our assessment of each scenario’s probability (“RiverFront Investment Group Probability”) is also shown. The assessment is based on RiverFront’s Investment team’s views and opinions as of 12.15.2025. Each case is hypothetical and is not based on actual investor experience. Yield and return estimates listed are for general asset classes and not related or reflective of any RiverFront portfolio investment. These views are subject to change and are not intended as investment recommendations. There is no representation that an investor will or is likely to achieve positive returns, avoid losses or experience returns as discussed for various market classes. See Definitions & Disclosures section for index definitions.
Originally published December 16, 2025
Originally published on ETF Trends
For more news, information, and strategy, visit the ETF Strategist Content Hub.
A message from Advisor Perspectives and VettaFi: Discover something new! Click here to register for our upcoming webcasts.
Risk Discussion: All investments in securities, including the strategies discussed above, include a risk of loss of principal (invested amount) and any profits that have not been realized. Markets fluctuate substantially over time, and have experienced increased volatility in recent years due to global and domestic economic events. Performance of any investment is not guaranteed. In a rising interest rate environment, the value of fixed-income securities generally declines. Diversification does not guarantee a profit or protect against a loss. Investments in international and emerging markets securities include exposure to risks such as currency fluctuations, foreign taxes and regulations, and the potential for illiquid markets and political instability. Please see the end of this publication for more disclosures.
Important Disclosure Information
The comments above refer generally to financial markets and not RiverFront portfolios or any related performance. Opinions expressed are current as of the date shown and are subject to change. Past performance is not indicative of future results and diversification does not ensure a profit or protect against loss. All investments carry some level of risk, including loss of principal. An investment cannot be made directly in an index.
Information or data shown or used in this material was received from sources believed to be reliable, but accuracy is not guaranteed.
This report does not provide recipients with information or advice that is sufficient on which to base an investment decision. This report does not take into account the specific investment objectives, financial situation or need of any particular client and may not be suitable for all types of investors. Recipients should consider the contents of this report as a single factor in making an investment decision. Additional fundamental and other analyses would be required to make an investment decision about any individual security identified in this report.
Chartered Financial Analyst is a professional designation given by the CFA Institute (formerly AIMR) that measures the competence and integrity of financial analysts. Candidates are required to pass three levels of exams covering areas such as accounting, economics, ethics, money management and security analysis. Four years of investment/financial career experience are required before one can become a CFA charterholder. Enrollees in the program must hold a bachelor’s degree.
All charts shown for illustrative purposes only. Technical analysis is based on the study of historical price movements and past trend patterns. There are no assurances that movements or trends can or will be duplicated in the future.
Stocks represent partial ownership of a corporation. If the corporation does well, its value increases, and investors share in the appreciation. However, if it goes bankrupt, or performs poorly, investors can lose their entire initial investment (i.e., the stock price can go to zero). Bonds represent a loan made by an investor to a corporation or government. As such, the investor gets a guaranteed interest rate for a specific period of time and expects to get their original investment back at the end of that time period, along with the interest earned. Investment risk is repayment of the principal (amount invested). In the event of a bankruptcy or other corporate disruption, bonds are senior to stocks. Investors should be aware of these differences prior to investing.
In general, the bond market is volatile, and fixed income securities carry interest rate risk. (As interest rates rise, bond prices usually fall, and vice versa). This effect is usually more pronounced for longer-term securities). Fixed income securities also carry inflation risk, liquidity risk, call risk and credit and default risks for both issuers and counterparties. Lower-quality fixed income securities involve greater risk of default or price changes due to potential changes in the credit quality of the issuer. Foreign investments involve greater risks than U.S. investments, and can decline significantly in response to adverse issuer, political, regulatory, market, and economic risks. Any fixed-income security sold or redeemed prior to maturity may be subject to loss.
Investing in foreign companies poses additional risks since political and economic events unique to a country or region may affect those markets and their issuers. In addition to such general international risks, the portfolio may also be exposed to currency fluctuation risks and emerging markets risks as described further below.
Changes in the value of foreign currencies compared to the U.S. dollar may affect (positively or negatively) the value of the portfolio’s investments. Such currency movements may occur separately from, and/or in response to, events that do not otherwise affect the value of the security in the issuer’s home country. Also, the value of the portfolio may be influenced by currency exchange control regulations. The currencies of emerging market countries may experience significant declines against the U.S. dollar, and devaluation may occur subsequent to investments in these currencies by the portfolio.
Foreign investments, especially investments in emerging markets, can be riskier and more volatile than investments in the U.S. and are considered speculative and subject to heightened risks in addition to the general risks of investing in non-U.S. securities. Also, inflation and rapid fluctuations in inflation rates have had, and may continue to have, negative effects on the economies and securities markets of certain emerging market countries.
In a rising interest rate environment, the value of fixed-income securities generally declines.
Technology and internet-related stocks, especially of smaller, less-seasoned companies, tend to be more volatile than the overall market.
Artificial intelligence, or AI, refers to the simulation of human intelligence by software-coded heuristics. Nowadays this code is prevalent in everything from cloudbased, enterprise applications to consumer apps and even embedded firmware.
Index Definitions:
Standard & Poor’s (S&P) 500 Index measures the performance of 500 large cap stocks, which together represent about 80% of the total US equities market.
The U.S. dollar index is a measure of the U.S. dollar’s value relative to its most significant trading partners’ currencies: EUR, JPY, CAD, GBP, SEK, and CHF.
Definitions:
Gross Domestic Product (GDP) is the monetary value of all finished goods and services made within a country during a specific period. GDP provides an economic snapshot of a country, used to estimate the size of an economy and growth rate.
The Consumer Price Index (CPI) is a measure that examines the weighted average of prices of a basket of consumer goods and services, such as transportation, food, and medical care. It is calculated by taking price changes for each item in the predetermined basket of goods and averaging them. Changes in the CPI are used to assess price changes associated with the cost of living. The CPI is one of the most frequently used statistics for identifying periods of inflation or deflation.
The Purchasing Managers’ Index (PMI) is an indicator of the prevailing direction of economic trends in the manufacturing and service sectors.
Inflation is a gradual loss of purchasing power, reflected in a broad rise in prices for goods and services over time.
Reflation is a policy response to economic slowdowns that aims to boost spending and counter deflation. It can involve tax cuts, lower interest rates, expanding the money supply, or increased infrastructure spending, all meant to jump-start activity after a contraction.
A recession is a significant, widespread, and prolonged downturn in economic activity. A common rule of thumb is that two consecutive quarters of negative gross domestic product (GDP) growth indicate a recession. However, more complex formulas are also used to determine recessions.
When referring to being “overweight” or “underweight” relative to a market or asset class, RiverFront is referring to our current portfolios’ weightings compared to the composite benchmarks for each portfolio. Asset class weighting discussion refers to our Advantage portfolios.
RiverFront Investment Group, LLC (“RiverFront”), is a registered investment adviser with the Securities and Exchange Commission. Registration as an investment adviser does not imply any level of skill or expertise. Any discussion of specific securities is provided for informational purposes only and should not be deemed as investment advice or a recommendation to buy or sell any individual security mentioned. RiverFront is affiliated with Robert W. Baird & Co. Incorporated (“Baird”), member FINRA/SIPC, from its minority ownership interest in RiverFront. RiverFront is owned primarily by its employees through RiverFront Investment Holding Group, LLC, the holding company for RiverFront. Baird Financial Corporation (BFC) is a minority owner of RiverFront Investment Holding Group, LLC and therefore an indirect owner of RiverFront. BFC is the parent company of Robert W. Baird & Co. Incorporated, a registered broker/dealer and investment adviser.
To review other risks and more information about RiverFront, please visit the website at riverfrontig.com and the Form ADV, Part 2A. Copyright ©2025 RiverFront Investment Group. All Rights Reserved. ID 5065135
Read more commentaries by Riverfront Investment Group