Periodic Table of Commodities Returns: Silver Took the Gold in 2025
Membership required
Membership is now required to use this feature. To learn more:
View Membership BenefitsEvery year around this time, we update one of our most popular and widely followed tools, the interactive Periodic Table of Commodities Returns. I encourage you to spend a few minutes exploring it. With just a click, you can see which commodities rose to the top in 2025 and which fell to the bottom.
Silver was the best-performing commodity last year, up an astounding 145%, but precious metals as a whole delivered solid returns. Gold, silver, platinum and palladium all responded positively to a number of factors, from rising geopolitical tensions to changes to global trade to the accelerating energy transition.
50 New All-Time Highs for Gold
When it comes to gold, you have to go all the way back to 1979, when the Iranian revolution and Cold War dominated headlines, to find a year like 2025. The yellow metal gained 64%, closing the year above $4,300 an ounce after hitting more than 50 new all-time highs.
So what pushed the yellow metal so high?
Rate cuts and a weaker U.S. dollar, for one. After aggressively raising rates in 2022-2023, the Federal Reserve reversed course as hiring slowed and inflation remained stubbornly high. As many of you know, lower real yields have historically been rocket fuel for gold.
Central banks, especially those in emerging markets, continued to accumulate the precious metal in a bid to diversify away from the U.S. dollar. According to the World Gold Council (WGC), central banks purchased 53 metric tons in October alone, representing the largest monthly haul for the year so far.
Gold Still Criminally Underinvested
Despite gold’s monster rally this past year, gold mining stocks remain criminally underinvested compared to the S&P 500. Take a look below. When the metal climbed in the 2000s, from around $290 in 2000 to a high of over $1,900 by September 2011, the NYSE Arca Gold Miners Index surged dramatically relative to the market. (It helped, of course, that the S&P was still recovering from the financial crisis.) And when gold began to capitulate soon after, investors dropped mining stocks like a hot potato… and never returned, even as gold crossed above $4,000.
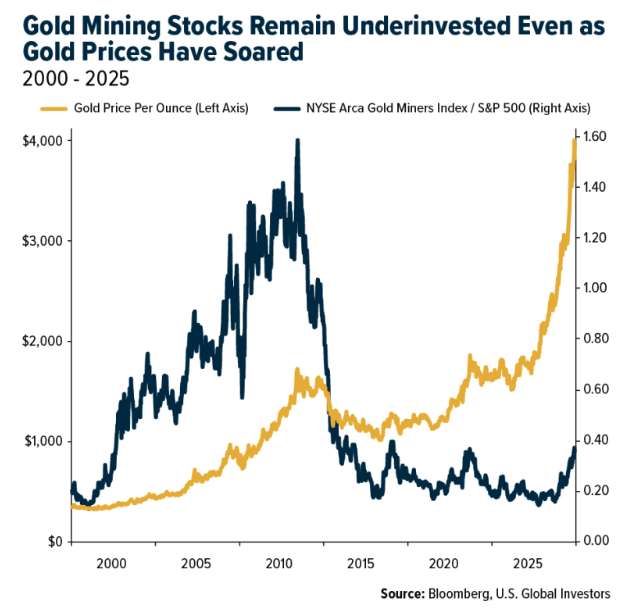
I hear from friends who say they’re not participating because they missed the last run-up. That’s the wrong way to look at it, I think. Hitting 50 new all-time highs in a single year is nice, but it’s not necessary for the metal to do its job. As a portfolio diversifier, it has historically shared a negative correlation with stocks, meaning it has often zigged when the market zagged.
Silver Stole the Show
As strong as gold performed, it was silver that stole the show in 2025. Prices more than doubled, finishing the year above $70 per ounce and notching the biggest annual gain on record.
Notably, an ounce of silver costs more than a barrel of oil right now, a highly unusual position for the two assets to find themselves in. The silver-to-oil ratio has averaged about 0.27 over the past 30 years, meaning one ounce of silver has historically bought you a little over a quarter of a barrel of Brent crude.
Today, that ratio has skyrocketed to 1.2.
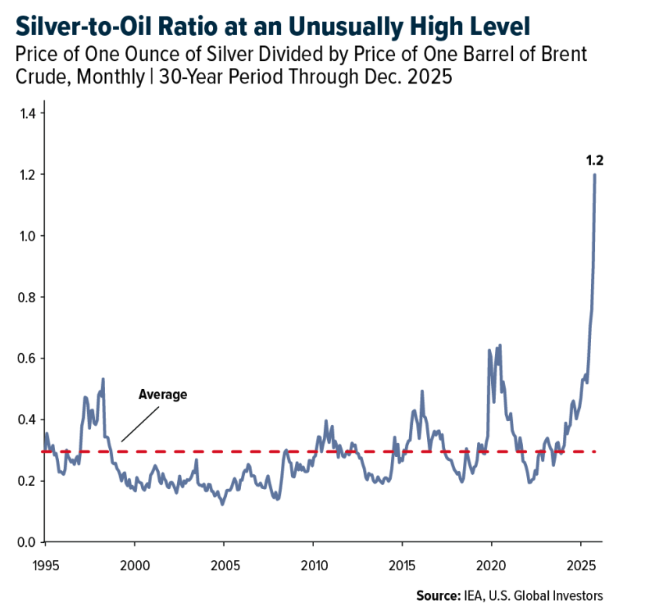
It should go without saying, but that’s not normal. The only other time we’ve seen silver this expensive relative to oil was back in 1980, when the Hunt brothers famously tried to corner the silver market. Some analysts see signs of a bubble.
How Chinese Export Curbs Could Send Silver Even Higher
There’s more going on with silver, of course. Today, it’s as much an industrial metal as it is a monetary one. Roughly 50% to 60% of annual demand now comes from technology and manufacturing—solar panels, electric vehicles (EVs), electronics, medical devices and more. Every solar panel uses about 20 grams of silver, while an EV can carry up to 2 ounces of it in sensors and wiring.
And that’s before we add geopolitics to the equation. Effective January 1, China has placed new restrictions on silver exports. Only large state-approved firms with massive credit limits will be allowed to export, effectively sidelining thousands of smaller players. Since China currently controls an estimated 60% to 70% of global refined silver supply, even a partial slowdown could be enough to jolt markets.
Put all that together—strong industrial demand, low inventories, looming export controls—and you get what FXStreet calls a “perfect storm” for silver.
China Controls the Global Clean-Tech Market
2025 was a breakthrough year for renewable energy. An analysis from Ember found that wind and solar supplied 17.6% of the world’s electricity in the first three quarters of the year, pushing total low-carbon generation up to 43%.
For the first time ever, renewables produced more electricity than coal.
China is the main engine behind this shift. Last year, the country added a jaw-dropping 380 gigawatts of wind and solar, more than three times the new capacity in the U.S. and Europe combined, according to energy consultancy firm Wood Mackenzie. Meanwhile, EVs now make up about 55% of new car sales in China, compared to 15% to 20% in the West.
As it does with refined silver, China dominates the global supply chain for clean technology. It produces around 80% of solar cells, 70% of wind turbines and 70% of lithium batteries. That’s according to reporting by the journal Science, which named renewable energy its Breakthrough of the Year.
America Takes a Step Back
Contrast this with what’s been happening in the U.S. The second Trump administration has reversed much of the federal support for clean energy while halting virtually all offshore wind projects along the East Coast, allegedly over national security concerns.
Federal loans, grants and tax incentives for renewables have been cut, contributing to at least 51 large clean-tech manufacturing projects being canceled or paused in 2025 through the end of November.
Combined, these projects represent an economic loss of nearly $32 billion and as many as 40,000 jobs, according to analysis by business and investor advocacy group E2.
Record Coal Demand in a Supposedly “Green” World
Up 5.6% in 2025, coal proved once again that rumors of its death are greatly exaggerated. The International Energy Agency (IEA) estimated global demand to have reached 8,845 million tons in 2025, a new record. The group estimates coal use to plateau in 2026 and then slowly decline.
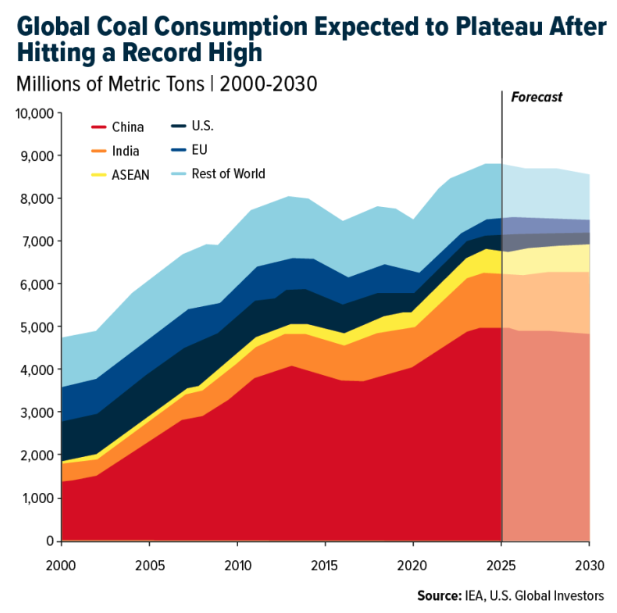
After 15 years of steady losses, U.S. consumption of coal jumped an estimated 8% year-over-year, thanks to higher natural gas prices and slower retirements of coal plants, in line with President Trump’s pro-fossil fuel stance.
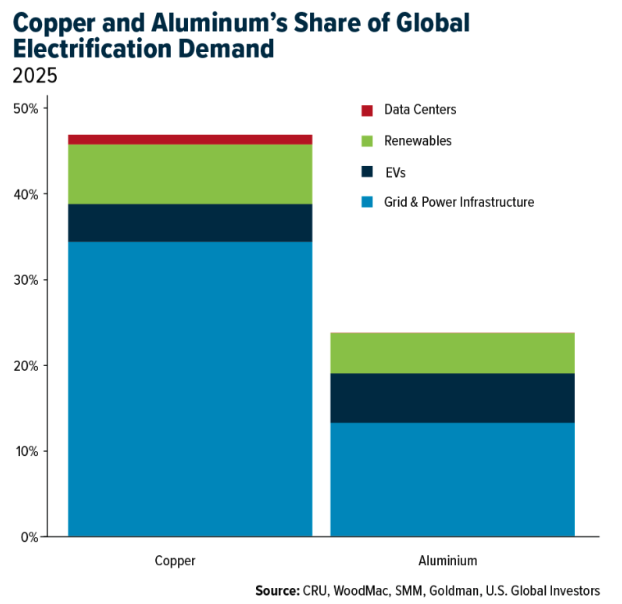
Copper at the Heart of the Electrification Boom
The energy transition is also reshaping industrial metals, with copper at the center.
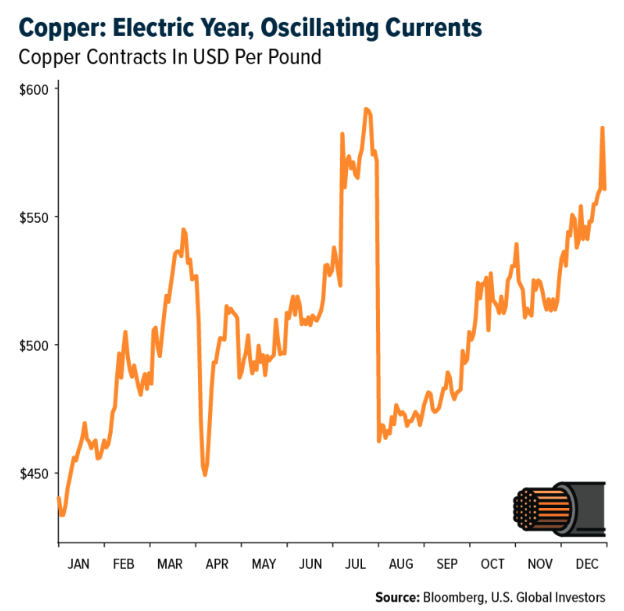
Closing the year at nearly $12,600 per ton, representing an increase of 45.6% since the start of 2025, copper hit a number of record highs in 2025, driven by concerns that new tariffs and trade policies would tighten supplies, even as demand from power grids, data centers, EVs and defense continued to surge.
In a December report, Goldman Sachs called copper its favorite industrial metal for the long term, noting that electrification already accounts for nearly half of copper demand and that new mine supply faces unique constraints.
Fitch expects global demand for the red metal and aluminum to rise between 2.0% and 2.5% in 2026, supported by loose fiscal policy and ongoing investment in the energy transition. UBS is slightly more optimistic, forecasting copper consumption growth of nearly 3% in both 2025 and 2026.
Investors should do their own research, obviously, but I believe mining companies involved in electrification and the energy transition are likely to remain in the spotlight for some time. Investment banking firm Jefferies believes 2026 could be a year of commodities-driven earnings growth, with names like Freeport-McMoRan, Glencore, Anglo American and Alcoa singled out as potential beneficiaries.
Interested in investment opportunities in mining and natural resources in 2026? Shoot an email to [email protected] with the subject line COMMODITIES.
Airlines and Shipping
Strengths
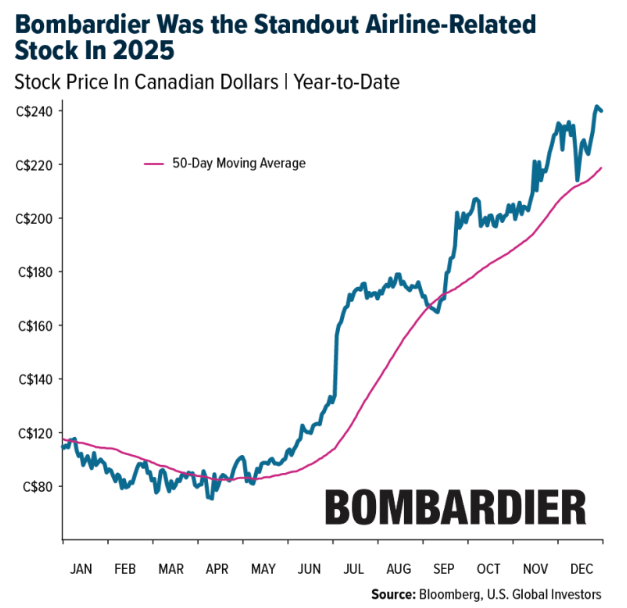
- The best performing airline stock for the year was Bombardier, up 157%. Bombardier had several earnings beats during 2025, along with strong order activity, debt paydown ahead of schedule, and removal of major tariff concerns with the U.S.
- Crude tanker ton-mile demand grew +4% year-over-year (YoY), with Chinese imports tracking at double-digit YoY growth. Middle East-to-China VLCC spot rates have started 3Q25 averaging +10% YoY higher, while VLCC forward curves suggest a rebound back to $40K/day, tracking +10–20% YoY higher, according to Bank of America.
- Fare growth for bookings is accelerating. Airfares saw the strongest sequential increase since February 2023, according to UBS. The U.S. Bureau of Labor Statistics reports airline fares were up 5.9% YoY. This marks the first sequential increase in the 5%+ range since February 2023, according to Morgan Stanley.
Weaknesses
- The worst-performing airline stock for the year was Sabre, down 62%, driven by the sale of its Hospitality Solutions business and several earnings misses. Bank of America notes that 40–45% of passenger bookings on China/Japan routes have been canceled, mostly involving lower-tier cities. About 30–40% of replacement travel is domestic, while 10–15% has shifted to Southeast Asia.
- Ocean container rates fell 10% sequentially and remain under significant pressure year-over-year (YoY) at -76%. Goldman attributes the decline to disruptions in trade flows caused by tariff policies, with ongoing trade war uncertainties prompting a “wait-and-see” approach among shippers, buyers, and cargo owners.
- Spirit Aviation Holdings filed for bankruptcy a second time and restructured its lease agreement with AerCap. Key points include Spirit rejecting some aircraft leases while affirming others, and AerCap providing a liquidity infusion.
Opportunities
- United Airlines and JetBlue formed a partnership focused on better connectivity and frequent-flier benefits, with potential growth in JFK and Florida. The alliance could evolve in three phases: basic commercial reciprocity, a strategic partnership, and possibly a merger.
- Container spot rates may firm due to European port congestion and pre-CNY seasonality, while dry bulk demand remains strong. The Red Sea situation is mostly unchanged, with about half of tanker transits back to normal, according to Bank of America.
- The recently passed “Big Beautiful Bill” provides the FAA $12.5B for ATC modernization, including $4.75B for telecommunications infrastructure and $3B for radar replacements, according to Morgan Stanley.
Threats
- United Airlines CEO Scott Kirby has called for flight limits at Newark, where UAL operates nearly 70% of flights. Proposed solutions include capping flights at 48 per hour during runway construction, modernizing the air traffic control system, and fully staffing controllers, according to Morgan Stanley.
- JP Morgan warns that ocean oversupply challenges may persist, with the orderbook-to-fleet ratio at 31% versus 20% in mid-2024, and 20% of new capacity expected in the next three years, according to Alphaliner.
- Transatlantic travel from Europe to the US is down, with bookings from Germany (-13%), Spain (-9%), Italy (-7.6%), the UK (-4.9%), and France (-2.9%) declining year-over-year, based on Cirium data.
Luxury Goods and International Markets
Strengths
- According to the “Billionaire Ambitions Report 2025” produced by UBS, global billionaire wealth reached a record $15.8 trillion in 2025, up about 13% from 2024 as markets rose and new fortunes were created. The number of billionaires also increased, reflecting continued wealth concentration at the top. Since most luxury spending comes from ultra-rich consumers who are less sensitive to price increases, the luxury sector continued to benefit despite higher costs.
- Super-luxury brands maintained strong pricing power in 2025, supported by product scarcity and controlled distribution that kept demand above supply. This allowed companies to raise prices with minimal impact on sales, as exclusivity remained a key driver of desirability. Iconic houses like Hermès, Louis Vuitton, and Cartier continued to benefit from loyal high-end customers, protecting margins and offsetting inflation and material cost increases while still delivering revenue growth.
- Laopu Gold, a Chinese jewelry retailer focused on traditional goods, was the best-performing stock in the luxury index this week, rising more than 162%. Chinese consumers are increasingly choosing local luxury brands like Laopu Gold over traditional European and U.S. houses, as these brands leverage local culture, craftsmanship, and design aesthetics that resonate more strongly with domestic buyers.
Weaknesses
- Consumer spending recovery in China has remained slow in 2025, with shoppers still cautious and luxury demand lagging expectations despite targeted stimulus efforts. Tourism has improved from prior years, and travel flows continue to rebound, but overall activity remains below pre-pandemic levels, limiting the full return of international luxury spending that brands relied on before 2020.
- Consumer confidence in the U.S. weakened in 2025. Several major sentiment gauges showed declining confidence through the year, with the Conference Board’s Consumer Confidence Index falling multiple months in a row and ending the year at lower levels than earlier in 2025, reflecting increased anxiety about prices, jobs, and the economy.
- CityChamp Watch & Jewellery, a Hong Kong-based retailer known for watches and mid-tier jewelry brands, was the worst-performing stock in the luxury index this week, falling 76%. Unlike Laopu Gold, which focuses on traditional gold jewelry and benefited from strong domestic demand and the “China-chic” trend, CityChamp struggled with weak earnings, loss-making subsidiaries, and softer brand momentum, making it far less attractive to investors in 2025.
Opportunities
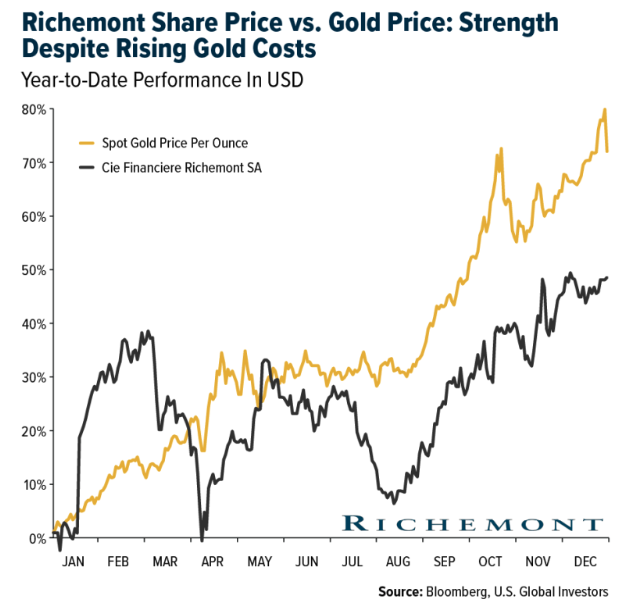
- Richemont, the parent company of Cartier, grew jewelry sales in 2025 even as gold prices reached record highs, demonstrating strong brand power, pricing ability, and resilient demand for high-end pieces. Luxury consumers were willing to pay premium prices, allowing the company to protect margins and pass on higher material costs without reducing demand. This strength highlights continued opportunity for 2026, as strong brand desirability, wealth-driven consumption, and demand for iconic jewelry collections could support further sales growth.
- Strong consumer spending on luxury travel continued to drive the luxury sector in 2025, supported by high-income travelers prioritizing premium experiences such as luxury hotels, fine dining, and high-end shopping while abroad. With global travel demand rising and a potential rebound in China, this momentum is likely to carry into 2026, creating further opportunities for luxury brands to capture spending from tourism flows.
- Analysts remain positive on China, expecting improved economic support, a recovery in earnings, and increased consumer spending. Attractive valuations and potential policy stimulus could bring investors back, creating room for growth. If China strengthens, luxury brands stand to benefit from a pickup in demand and spending next year.
Threats
- Luxury brands have been raising prices consistently for several years, especially since the pandemic. This multi-year trend has been driven by higher material and labor costs, along with strong post-COVID demand from affluent consumers. Ultra-rich buyers remain largely price-insensitive, but aggressive pricing over time may put pressure on the aspirational and middle-affluent segments.
- The rise of second-hand luxury shopping has become a growing trend, particularly among more price-sensitive consumers, posing a potential threat to primary luxury sales. Pre-owned platforms offer access to premium brands at lower prices, attracting younger buyers and those affected by rising retail costs. As resale marketplaces gain credibility and scale, some consumers may shift purchases away from full-price boutiques.
- Ongoing geopolitical tensions represent a threat to luxury sector growth, as uncertainty can reduce consumer confidence. The continued war in Ukraine with no clear resolution, rising military tensions along Russia–NATO borders, instability in the Middle East, and renewed tariff disputes between major economies like the U.S. and China all increase volatility. These conditions can weaken tourism flows, raise operating costs, and slow discretionary spending in key markets, creating downside risk for luxury demand in 2026.
Energy and Natural Resources
Strengths
- The best-performing commodity of the year was lithium carbonate, which rose roughly 65%. Prices surged in 2025 as major supply disruptions hit the market, most notably when CATL halted operations at one of the world’s largest lithium mines in Jiangxi, China, tightening supply just as demand from EV and battery-storage manufacturers rebounded.
- Copper prices soared in 2025, driven by a wave of supply disruptions. Reuters reported that a mudflow shut down the Grasberg mine, which accounts for roughly 5% of global output, while additional outages removed hundreds of thousands of tons from expected supply. Bloomberg also noted that tariff-driven stockpiling by U.S. buyers worsened regional shortages, helping push copper to its strongest annual performance in more than a decade.
- Industry consolidation accelerated in 2025, strengthening supply-chain resilience as major miners and metals producers prioritized scale, integration, and securing critical inputs. Bloomberg reported that mergers across steel, copper, and battery metals aimed to control logistics, reduce geopolitical risk, and stabilize procurement. Reuters highlighted Nippon Steel’s acquisition of U.S. Steel and the Anglo–Teck merger, underscoring a wave of cross-border deals reshaping the metals industry amid commodity volatility.
Weaknesses
- Wheat was the worst-performing commodity of the year, falling about 17%. Prices stayed weak through most of 2025 as favorable weather drove bumper harvests in key regions including Argentina, North America, and Australia. Late in the year, prices briefly rebounded on Black Sea supply risks and U.S. weather concerns, but the rally faded and wheat ended the year near its lows.
- Lumber policy risk intensified in late 2025 after the National Association of Home Builders warned that U.S. Commerce actions could raise combined countervailing and anti-dumping duties on Canadian softwood lumber to roughly 35.2% from about 14.4%. The potential increase adds significant cost and uncertainty heading into 2026, deepening weakness in the rate-sensitive housing market and limiting near-term recovery in lumber demand and pricing.
- Energy-sector investment also lagged in 2025 as capital discipline and project delays persisted amid price uncertainty and cost pressures. The Dallas Fed Energy Survey showed business activity indices remaining negative, with many firms signaling continued caution on capital spending as weak sentiment dominated industry outlooks.
Opportunities
- South Korea’s nuclear regulator approved Saeul Unit 3 to move toward full operation after its pilot run, expanding a fleet of 26 operating units with additional reactors under construction. In the United States, forward indicators improved as Duke filed for an NRC early site permit targeting about 600 megawatts of advanced nuclear capacity at Belews Creek, with initial small modular reactor operations expected in the mid-2030s. Asia remains the center of new nuclear construction, with World Nuclear Association data showing roughly 70 reactors under construction globally, mostly in Asia.
- A federal district court invalidated a broad federal pause on wind approvals, restoring agencies’ obligation to process wind authorizations and marking a legal win for the sector. However, late December headlines pointed to new federal freezes and suspensions affecting major offshore wind projects tied to national security claims and involving developers such as Ørsted. Legal victories reduce the risk of blanket moratoriums, but project level permitting and political risk remain, and President Trump has attempted to ban wind power over concerns about interference with defense radar systems.
- The White House released a United States Australia framework focused on securing mining and processing supply for critical minerals and rare earths. The framework outlines clearer pathways for allied offtake, financing support, and processing capacity, supporting efforts to reduce reliance on China.
Threats
- Chinese yuan denominated assets and trade settlement continued to expand in 2025, with the renminbi accounting for roughly 3.1 to 3.3 percent of global payments by value, according to SWIFT. Growth was driven by China’s push to price energy, commodities, and bilateral trade in yuan, supported by expanded central bank swap lines, greater yuan use in trade with Russia, the Middle East, and parts of Asia, and efforts by firms to reduce reliance on the U.S. dollar amid sanctions risk and geopolitical fragmentation.
- The Pennsylvania New Jersey Maryland electricity grid faced mounting capacity constraints and rising costs in 2025 as demand growth outpaced new supply. The latest capacity auction implies about 16.4 billion dollars in additional system costs starting in June 2027, largely driven by data centers, AI-related power use, and electrification. Clearing prices rose to roughly 333.44 dollars per megawatt per day, raising affordability concerns as higher costs are passed through to consumers and increasing political and regulatory pressure on the sector.
- Physical copper markets and exchange pricing were heavily influenced by tariff expectations. Reuters noted that a tariff driven trade dislocation in physical copper began to unwind, with market structure shifting from extreme scarcity back toward contango, meaning prices for future delivery moved above spot prices as supply pressures eased. S&P Global reported a surge in U.S. copper imports in the first half of 2025, exceeding 500,000 metric tons compared with the same period in 2024, illustrating how policy expectations can rapidly distort trade flows, inventories, and pricing.
Bitcoin and Digital Assets
Strengths
- On July 18, 2025, the Guiding and Establishing National Innovation for US Stablecoins (GENIUS) Act was signed into law. This landmark legislation established the first comprehensive federal framework for payment stablecoins, removing them from SEC/CFTC jurisdiction and classifying them as banking products, providing the regulatory green light institutional investors had long awaited.
- As of December 2025, the Markets in Crypto-Assets (MiCA) regulation completed its first year of full application. Over 100 licensed entities now use “passporting” to operate seamlessly across all 27 EU member states, making Europe the most structurally stable market for crypto-asset service providers (CASPs).
- By late 2025, Spot Bitcoin and Ethereum ETFs from BlackRock and Fidelity became core institutional portfolio assets, securing $31 billion in annual net inflows. This was accelerated by an August 2025 Executive Order opening the $9 trillion US 401(k) market to crypto ETFs, transitioning the sector from retail speculation to long-term institutional savings.
Weaknesses
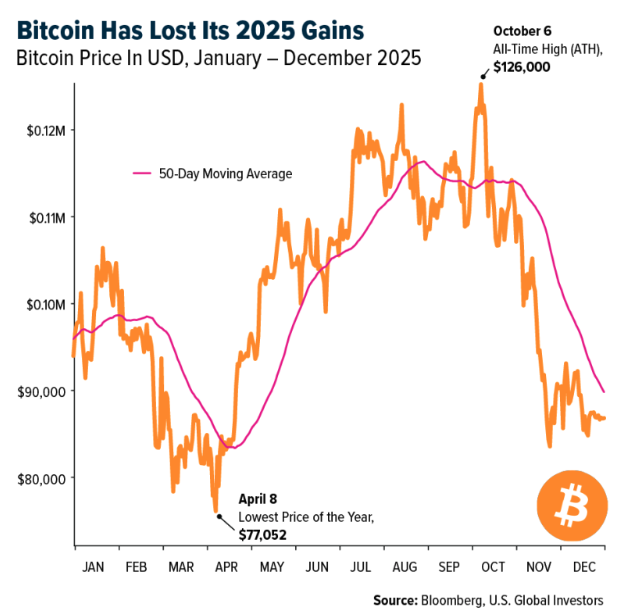
- Despite growing institutional adoption, Bitcoin ended 2025 with a year-to-date (YTD) return of roughly -6%, wiping out all annual gains by December. After hitting an all-time high of $126,000 in October, it plunged about 30% to the $87,000 range. This extreme volatility, driven by leverage liquidations and shifting macro sentiment, continues to hinder Bitcoin’s evolution from a speculative asset to a stable medium of exchange.
- A large portion of the market’s liquidity is concentrated in just two entities: Tether and Circle. With Tether’s reserves heavily tied to U.S. debt, the entire crypto ecosystem remains vulnerable to shocks in the Treasury market or shifts in U.S. fiscal policy.
- While Layer 2 solutions have improved, the user experience for non-custodial wallets and cross-chain bridges remains a barrier. CoinTelegraph reports that “gas wars” and bridge hacks, though less frequent than in 2024, continue to pose significant challenges for mainstream retail adoption.
Opportunities
- In a strategic pivot to diversify away from pure fiat, Tether became the largest private buyer of gold in Q3 2025, acquiring 26 metric tons. Their total holdings now reach 116 tons (valued at $14 billion), placing them among the top 30 gold holders worldwide. This strengthens the appeal of “Tether Gold” (XAUt) as a hedge against dollar inflation.
- Following the federal lead, several U.S. states in 2025, including Texas and Pennsylvania, moved to establish Strategic Bitcoin Reserves. Texas became the first to fund its reserve with a $5 million “placeholder” purchase, marking a new front for sovereign-level demand.
- The GENIUS Act has enabled the mass tokenization of private credit, real estate, and commodities. Major banks are now using the framework to move trillions in traditional assets onto public and private blockchains, creating a significant new revenue stream for the sector.
Threats
- The implementation of the DAC8 Directive in late 2025 marks the end of crypto anonymity in Europe. It mandates automatic tax reporting for all crypto transactions, significantly raising compliance costs for platforms and pushing some capital to offshore jurisdictions.
- While the GENIUS Act resolved the stablecoin issue, other areas such as Decentralized Finance (DeFi) and privacy-focused coins like Monero face increased scrutiny. The IRS and international task forces have introduced stricter Know Your Customer (KYC) requirements for DeFi protocols, which could hinder decentralized innovation.
- There is a growing risk of capital flight, as institutional funds previously allocated to crypto are redirected toward the energy and hardware demands of AI infrastructure, potentially reducing liquidity in digital assets.
Defense and Cybersecurity
Strengths
- The defense industry has entered a new phase focused on sustained serial production, replenishment, and long-term sustainment instead of episodic procurement cycles. Multi-year budget visibility, expanded manufacturing capacity, and steady defense spending in the U.S. and allied nations are creating durable revenue streams that are less affected by short-term political changes. This represents a lasting transformation of the defense industrial base, not just a temporary wartime surge.
- AI and data centers are now essential infrastructure with strong, persistent demand across industries and regions. Despite market consolidation, orders for computing, storage, and supporting infrastructure continue to grow, making data centers foundational assets for economic activity, technology, and national competitiveness.
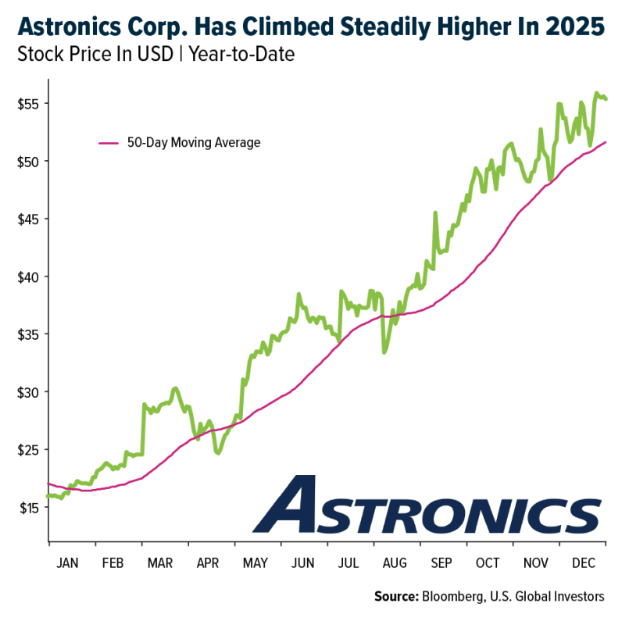
- The best-performing aerospace and defense stock for the year was Astronics, up 239.85%. The company designs, manufactures, and markets specialized lighting, control systems, and electronics for the cockpit, cabin, and exteriors of military, commercial, and general aviation aircraft. Astronics stood out as a key strength, supported by upgraded earnings forecasts, new Strong Buy analyst ratings, and solid guidance that the company successfully delivered on.
Weaknesses
- Execution risk is becoming more visible across large-scale infrastructure and defense programs as timelines lengthen and operations grow more complex. Labor shortages, permitting delays, and coordination challenges between construction, hardware, and software continue to slow the translation of structural demand into deployed capacity and revenue.
- Rising capital intensity in AI infrastructure and advanced defense manufacturing increases sensitivity to financing conditions and balance-sheet strength. Projects relying on high leverage or aggressive schedules face lower tolerance for delays and cost overruns, favoring well-capitalized incumbents and exposing weaker players to greater risk.
- The worst-performing aerospace and defense stock of the year was Redwire, down 53.83%. Redwire operates as a space infrastructure company, offering mission-critical space solutions and high-reliability components. The stock underperformed as the company faced mounting short-interest pressure (at one point the highest in the Russell 3000) compounded by a disappointing outlook and revenue that fell short of expectations.
Opportunities
- Missile defense and ISR have shifted from niche programs to top-tier procurement priorities. They are now central to modern defense architecture, supporting air and missile defense, autonomous platforms, and strategic deterrence. Expanding budgets and long-term program visibility in the U.S. and allied nations point to sustained growth with little sign of near-term saturation.
- Space-based defense infrastructure has evolved from complementary capability to a critical operational domain. Satellite tracking, missile warning, and space-enabled ISR are increasingly integrated into core defense planning, driving demand for resilient, distributed constellations and rapid deployment. While execution remains concentrated among a few providers, program depth and strategic importance continue to grow.
- Uncrewed systems and counter-drone capabilities are moving toward an industrialized model focused on scale, affordability, and rapid deployment. Demand is shifting toward consumable platforms integrated into broader defense networks, creating opportunities for companies that can deliver reliability, volume, and system-level integration.
Threats
- Power availability and grid capacity constraints remain a key bottleneck for AI and data-center expansion, slowing deployment despite strong demand. Delays in grid upgrades, rising infrastructure costs, and permitting challenges continue to affect timelines and returns, determining which projects and operators can scale effectively.
- AI integration into offensive and defensive digital systems adds structural risk, increasing operational complexity and dependence on software, data quality, and system design. Poorly executed adoption can amplify vulnerabilities and disrupt both civilian and defense infrastructure.
- Global geopolitical instability remains a persistent risk. Ongoing conflicts in Ukraine, the Middle East, and regional tensions in Southeast Asia heighten the potential for sudden shocks, supply-chain disruptions, and pressure on defense and critical infrastructure.
Gold Market
Strengths
- The best-performing precious metal(s) of the year were silver and platinum, up roughly 145% and 135%, respectively. Both metals led 2025’s gains, driven by their roles as monetary safe-haven assets amid expectations of U.S. rate cuts and rising geopolitical tensions. Silver’s record-breaking surge was further supported by deepening supply deficits, China’s threatened export restrictions, and strong industrial demand from EV and solar manufacturing.
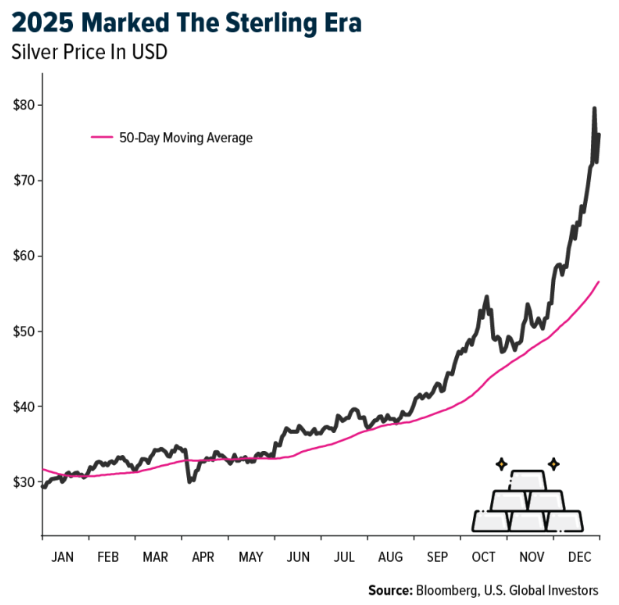
- Silver climbed above $80 an ounce, a new all-time high, while gold hovered near fresh record levels, supported by exiting crypto investors who saw a FOMO case for precious metals ownership. The move capped a standout, record-breaking year for silver, with spot prices extending one of their strongest annual rallies in decades.
- Platinum surged to record highs, driven by major supply disruptions from Russia and rising demand for precious metals. Heavy trading activity on a newly launched Chinese futures contract added to the momentum, particularly as conditions tightened in London, shipments to China increased, and confidence in Chinese demand grew following the start of trading on the Guangzhou Futures Exchange.
Weaknesses
- The worst-performing precious metal(s) for the year were gold and palladium, up 58% and 70%, respectively. Both lagged the explosive gains of silver and platinum in 2025 but remained fundamentally strong as monetary and strategic store-of-value assets. Gold’s performance was supported by massive central-bank accumulation of over 1,000 tonnes, driving prices to record highs despite limited new exploration and persistent macro uncertainty. Palladium, though pressured by long-term EV demand concerns, advanced as supply constraints and tight global inventories supported prices.
- Since 2014, 31 African countries have updated their mining codes to boost government and community involvement in resource extraction, according to Mining Weekly. Resource nationalism remains particularly strong in the Sahel region, namely Mali, Burkina Faso, and Niger, and is spreading across the continent. These nations are taking advantage of rising commodity prices by raising taxes and royalties, requiring state ownership, and sometimes pursuing outright nationalization to maximize the value of natural resources.
- Even as gold and silver prices neared record levels in 2025, all-in sustaining costs for many producers remained high, averaging $1,540–$1,680 per ounce in Q3 and rising notably year over year. Higher labor and energy costs, increased maintenance and ore processing expenses, and elevated sustaining capex for aging assets lifted cash costs per ounce by 20–40% in some cases. This cost pressure limited margin expansion despite strong metal prices, forcing producers to focus on efficiency programs and tighter cost control to protect free cash flow.
Opportunities
- The gold price is up 80% since September 2022, and while impressive, it still lags the previous three gold bull markets over the past 25 years. Looking further back, the current move is roughly in the middle of past gold cycles. UBS remains bullish on gold, driven by expectations for US rate cuts being pushed out and supported by continued: 1) official sector buying, 2) haven demand, 3) low positioning, and 4) ongoing liquidity issues. Gold mining company results to date have highlighted beats on returns, which are expected to continue ramping up through increased cash generation, before investment options are exhausted and the inevitable M&A cycle begins.
- Gold and other precious metals delivered exceptional performance in 2025, with spot gold rising roughly 70% year-to-date and topping $4,500 an ounce at year-end, while silver surged around 150–160% and set new record highs. Gains were fueled by safe-haven demand, inflation hedging, and expectations of U.S. rate cuts and easing monetary policy from the Fed and other central banks. In contrast, Bitcoin underperformed, finishing the year down about 5% and trading well below its October peak near $125,000, showing that crypto did not keep pace with precious metals despite similar macro drivers. This divergence underscores a renewed investor preference for physical precious metals as reliable stores of value amid quantitative easing and central bank liquidity programs, reinforcing gold’s strategic role in portfolios alongside traditional hedges.
- Bank of America calculates that the world’s central banks would need to purchase just over 11,000 tons of gold to reach 30% of total reserves. This is equivalent to roughly 10 years of buying at recent elevated annual levels. Excluding central banks that already hold at least 30% of reserves in gold, the remaining central banks would need to purchase 24,665 tons to reach 30%, equivalent to more than two decades of purchases at current elevated levels.
Threats
- New gold deposit discoveries have declined sharply over the past decades, averaging 18 per year in the 1990s, 12 in the 2000s, and just 4 in the 2010s. Between 2020 and 2023, there were only 5 major discoveries despite higher exploration spending. Scotia expects 2024 reserves to remain largely flat net of depletion, with higher gold price assumptions for reserves ($1,300–$1,400/oz) and resources ($1,600–$1,800/oz).
- The late-2025 silver flash crash, when prices fell from above $80 to the low $70s following CME margin hikes, underscores near-term volatility driven by leverage and positioning. Such dislocations are often financial rather than fundamental, historically creating attractive entry points. Structural demand from solar, electrification, and advanced electronics continues to tighten the physical silver balance, supporting long-term risk-reward for patient investors.
- RBC notes that gold equities sharply outperforming gold when prices are flat is rare, and historical periods of outperformance are often followed by underperformance, warranting caution. They also highlight that large-cap gold equities traded at unprecedented free cash flow yields above 8%.
U.S. Global Investors, Inc. is an investment adviser registered with the Securities and Exchange Commission (“SEC”). This does not mean that we are sponsored, recommended, or approved by the SEC, or that our abilities or qualifications in any respect have been passed upon by the SEC or any officer of the SEC.
This commentary should not be considered a solicitation or offering of any investment product. Certain materials in this commentary may contain dated information. The information provided was current at the time of publication. Some links above may be directed to third-party websites. U.S. Global Investors does not endorse all information supplied by these websites and is not responsible for their content. All opinions expressed and data provided are subject to change without notice. Some of these opinions may not be appropriate to every investor.
Holdings may change daily. Holdings are reported as of the most recent quarter-end. The following securities mentioned in the article were held by one or more accounts managed by U.S. Global Investors as of (09/30/2025):
Sabre
United Airlines
JetBlue Airways
Bombardier Inc.
Laopu Gold
Richemont
Freeport-McMoRan Inc.
Glencore PLC
Nippon Express Holdings
*The above-mentioned indices are not total returns. These returns reflect simple appreciation only and do not reflect dividend reinvestment.
The Dow Jones Industrial Average is a price-weighted average of 30 blue chip stocks that are generally leaders in their industry. The S&P 500 Stock Index is a widely recognized capitalization-weighted index of 500 common stock prices in U.S. companies. The Nasdaq Composite Index is a capitalization-weighted index of all Nasdaq National Market and SmallCap stocks. The Russell 2000 Index® is a U.S. equity index measuring the performance of the 2,000 smallest companies in the Russell 3000®, a widely recognized small-cap index.
The Hang Seng Composite Index is a market capitalization-weighted index that comprises the top 200 companies listed on Stock Exchange of Hong Kong, based on average market cap for the 12 months. The Taiwan Stock Exchange Index is a capitalization-weighted index of all listed common shares traded on the Taiwan Stock Exchange. The Korea Stock Price Index is a capitalization-weighted index of all common shares and preferred shares on the Korean Stock Exchanges.
The Philadelphia Stock Exchange Gold and Silver Index (XAU) is a capitalization-weighted index that includes the leading companies involved in the mining of gold and silver. The U.S. Trade Weighted Dollar Index provides a general indication of the international value of the U.S. dollar. The S&P/TSX Canadian Gold Capped Sector Index is a modified capitalization-weighted index, whose equity weights are capped 25 percent and index constituents are derived from a subset stock pool of S&P/TSX Composite Index stocks. The NYSE Arca Gold Miners Index is a modified market capitalization weighted index comprised of publicly traded companies involved primarily in the mining for gold and silver. The S&P/TSX Venture Composite Index is a broad market indicator for the Canadian venture capital market. The index is market capitalization weighted and, at its inception, included 531 companies. A quarterly revision process is used to remove companies that comprise less than 0.05% of the weight of the index, and add companies whose weight, when included, will be greater than 0.05% of the index.
The S&P 500 Energy Index is a capitalization-weighted index that tracks the companies in the energy sector as a subset of the S&P 500. The S&P 500 Materials Index is a capitalization-weighted index that tracks the companies in the material sector as a subset of the S&P 500. The S&P 500 Financials Index is a capitalization-weighted index. The index was developed with a base level of 10 for the 1941-43 base period. The S&P 500 Industrials Index is a Materials Index is a capitalization-weighted index that tracks the companies in the industrial sector as a subset of the S&P 500. The S&P 500 Consumer Discretionary Index is a capitalization-weighted index that tracks the companies in the consumer discretionary sector as a subset of the S&P 500. The S&P 500 Information Technology Index is a capitalization-weighted index that tracks the companies in the information technology sector as a subset of the S&P 500. The S&P 500 Consumer Staples Index is a Materials Index is a capitalization-weighted index that tracks the companies in the consumer staples sector as a subset of the S&P 500. The S&P 500 Utilities Index is a capitalization-weighted index that tracks the companies in the utilities sector as a subset of the S&P 500. The S&P 500 Healthcare Index is a capitalization-weighted index that tracks the companies in the healthcare sector as a subset of the S&P 500. The S&P 500 Telecom Index is a Materials Index is a capitalization-weighted index that tracks the companies in the telecom sector as a subset of the S&P 500.
The Consumer Price Index (CPI) is one of the most widely recognized price measures for tracking the price of a market basket of goods and services purchased by individuals. The weights of components are based on consumer spending patterns. The Purchasing Manager’s Index is an indicator of the economic health of the manufacturing sector. The PMI index is based on five major indicators: new orders, inventory levels, production, supplier deliveries and the employment environment. Gross domestic product (GDP) is the monetary value of all the finished goods and services produced within a country’s borders in a specific time period, though GDP is usually calculated on an annual basis. It includes all private and public consumption, government outlays, investments and exports less imports that occur within a defined territory.
The S&P Global Luxury Index is comprised of 80 of the largest publicly traded companies engaged in the production or distribution of luxury goods or the provision of luxury services that meet specific investibility requirements.
A message from Advisor Perspectives and VettaFi: Discover something new! Click here to register for our upcoming webcasts.
Membership required
Membership is now required to use this feature. To learn more:
View Membership BenefitsSponsored Content
Upcoming Virtual Events View All


