In the last 10-plus years, investors have grown accustomed to Japanese financial assets lagging their global counterparts. Using Asset Allocation Interactive (AAI), we can quickly compare the annualized real U.S.-dollar-denominated returns of Japanese bonds and stocks over the trailing decade to, respectively, all Core Bonds and all Multi-Country, U.S., and Chinese¹ public equities. Both Japanese asset classes rank at or near the bottom relative to their peers.
Due to very low starting yields and a generally strengthening U.S. dollar, the Japan Aggregate delivered an abysmal –6.5%, about 3% worse than the next-lowest performer in fixed income. As for the perhaps more salient asset class, Japanese stocks generated a respectable 4.7%, in line with the long-run historical average of most equity markets, but still third worst out of 13 major markets and far below the leader, the S&P 500, which gained 11.3% per annum over the same period during an exceptional global bull market.
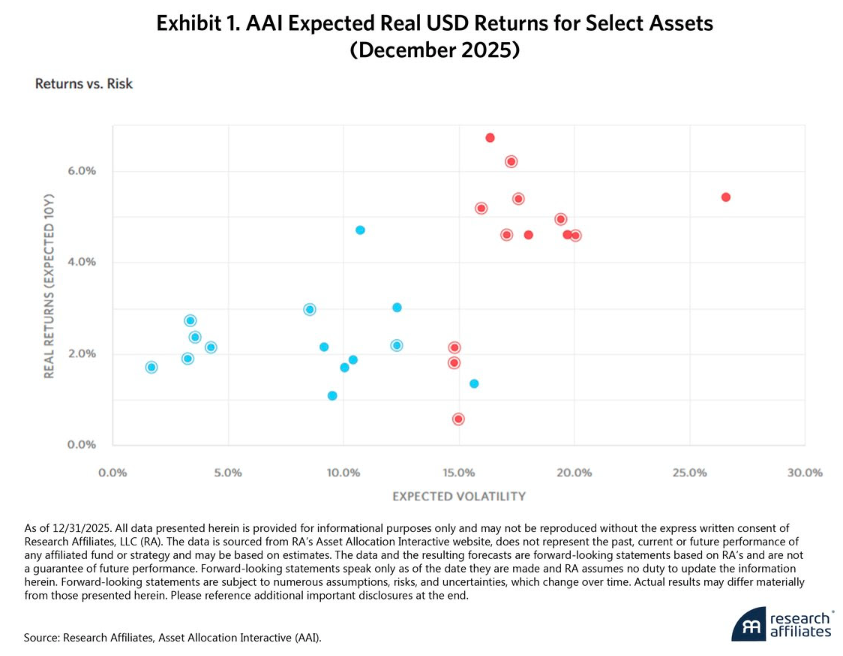
As of December 2025, however, AAI’s 10-year expected returns, inclusive of valuation, have identified an interesting theme, one that runs completely counter to the last decade’s trend. Compared to the same set of assets, Japanese bonds and stocks are now expected to deliver the highest real USD returns. With bonds in blue and equities in red, Exhibit 1 shows Japanese assets currently have the highest capital market expectations (CMEs) in their respective asset classes.

What explains the disparity between the trailing and expected returns? First, a very inexpensive Japanese yen is driving both stock and bond forecasts. Indeed, based on real exchange rate (RER) data going back to 1989, the yen has rarely been cheaper relative to the dollar. This cheapness alone is predicted to add approximately 2.6% to Japanese bond and stock returns.
Second, high starting bond yields provide a boost to the Japanese Aggregate. At 2.1%, current 10-year Japanese Government Bond (JGB) yields are in the 76th percentile relative to history since the late 1980s and are at their highest since 1999. This compares with 10-year yields in the U.S., Europe, and China that are all below their medians, providing less room for favorable mean reversion.
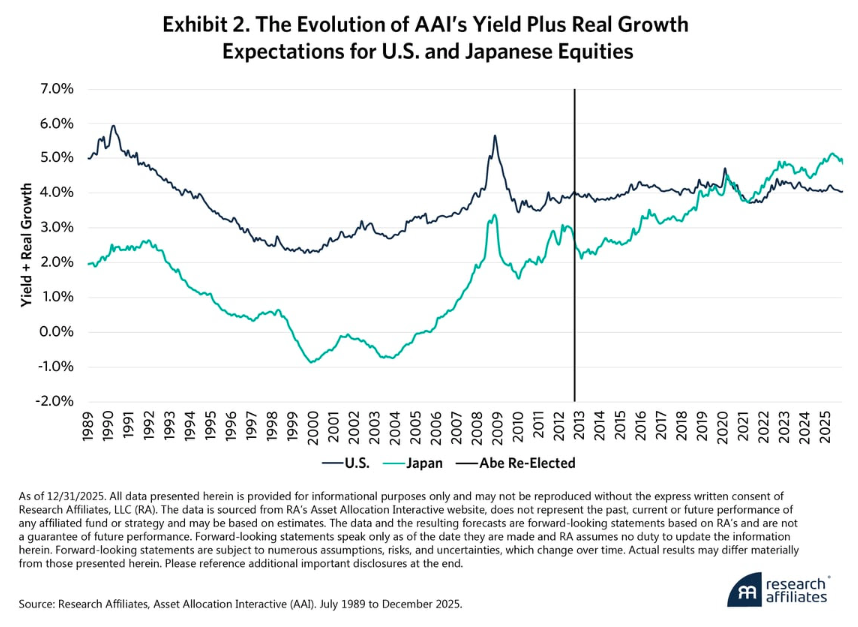
Of course, one reason for the elevated JGB yields is rising inflation, which has reached 2.9% currently, a value in the 71st percentile of Japan’s history since 1989 and among the highest in recent memory. How the country has defeated roughly three decades of deflation is a complex story whose full accounting is outside the scope of this article. Nevertheless, the tide arguably began to turn with Prime Minister Shinzo Abe’s re-election in December 2012. Abe’s Three Arrows “Abenomics” strategy, focused on easy monetary policy, fiscal stimulus, and structural reforms, set the stage for not only the return of inflation, which has driven up yields and, subsequently, expected bond returns, but also corporate reform initiatives that continue today.²
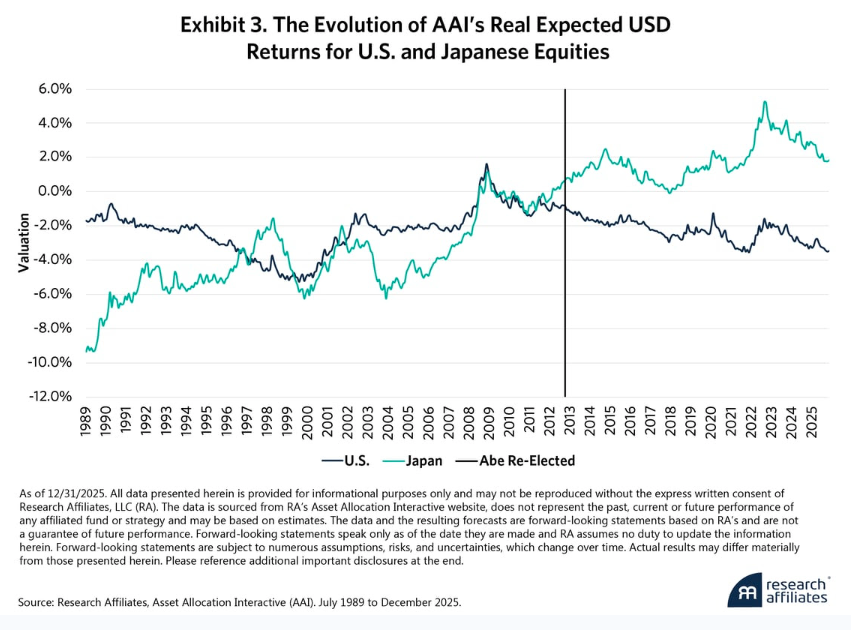
Both resurgent inflation and corporate reforms have powered the fundamental performance of Japanese equities since Abe’s re-election, fueling AAI’s rising expected stock returns in the Land of the Rising Sun. Buybacks in Japan have reached record levels as holding cash has become less attractive in real terms, cross-shareholding unwinds have accelerated, company boards have increased their independence, and optimism about future economic prospects has grown more palpable. In local currency terms, Japanese companies have increased their operating margins and earnings at a faster clip³ than their U.S. counterparts since December 2012, as well as in the last three to five years. Exhibit 2 and Exhibit 3 show, respectively, how AAI’s fundamental yield plus real growth estimates and overall real expected return forecasts of U.S. and Japanese stocks have evolved.
AAI’s systematic methodology has identified fundamental changes in Japanese markets. Despite nearly four decades of underperformance compared to their global peers, Japanese bonds and stocks are now poised for higher current expected returns.
End Notes
1 We include both U.S. Large and Small Cap and Chinese public equity indices as additional points of comparison since they constitute the largest developed and emerging markets, respectively.
2 For example, in 2022 the Tokyo Stock Exchange (TSE) restructured its market segments to encourage companies to focus more on increasing shareholder value, and later announced plans to first spotlight and later delist companies that do not attempt to maximize shareholder value, as measured by whether they have a price-to-book (P/B) ratio above 1.0x and a return on equity (ROE) above 8.0%.
3 From December 2012 to September 2025, operating margins and earnings per share increased by 5.4% and 8.4%, respectively, for Japanese companies versus 2.2% and 7.9% for U.S. firms.
A message from Advisor Perspectives and VettaFi: Discover something new! Click here to register for our upcoming webcasts.
© Research Affiliates
Read more commentaries by Research Affiliates