President Trump received fairly good news in the November Consumer Price Index (CPI) report,[1] with inflation coming in lower than expectations though still higher than the Federal Reserve’s target of 2%. Meanwhile, the American consumer continues to struggle with affordability as prices and inflation continue to top polls of voters concerns about the country/the economy.[2]
Our view from the portfolio management desk is that there seems to be a concurrent affordability crisis in the public stock markets as well. The biggest names appear to be “priced for perfection” at this moment.
For the purposes of this exercise, let’s suppose that rather than wanting to buy a few shares of a company, I want to buy the whole thing and take it private at today’s market price. In this case, growth is important, but I also want to make sure I am buying a valuable asset that a few years down the line someone else would want to buy back from me at a profit. In the meantime, I’d like to see some income from my investment. If I assumed no growth for the company, I might want to pay book value[3] plus X years of discounted earnings flows.
If I carry this assumption to the S&P 500, then, I’m going to refer to the portion of the current price not reflected by book value and 3 years of discounted earnings as the “growth premium”. [4] A high growth premium suggests I am purchasing fewer net assets and lower annual income in return for higher expectations that the company will grow earnings by a lot over the next few years.
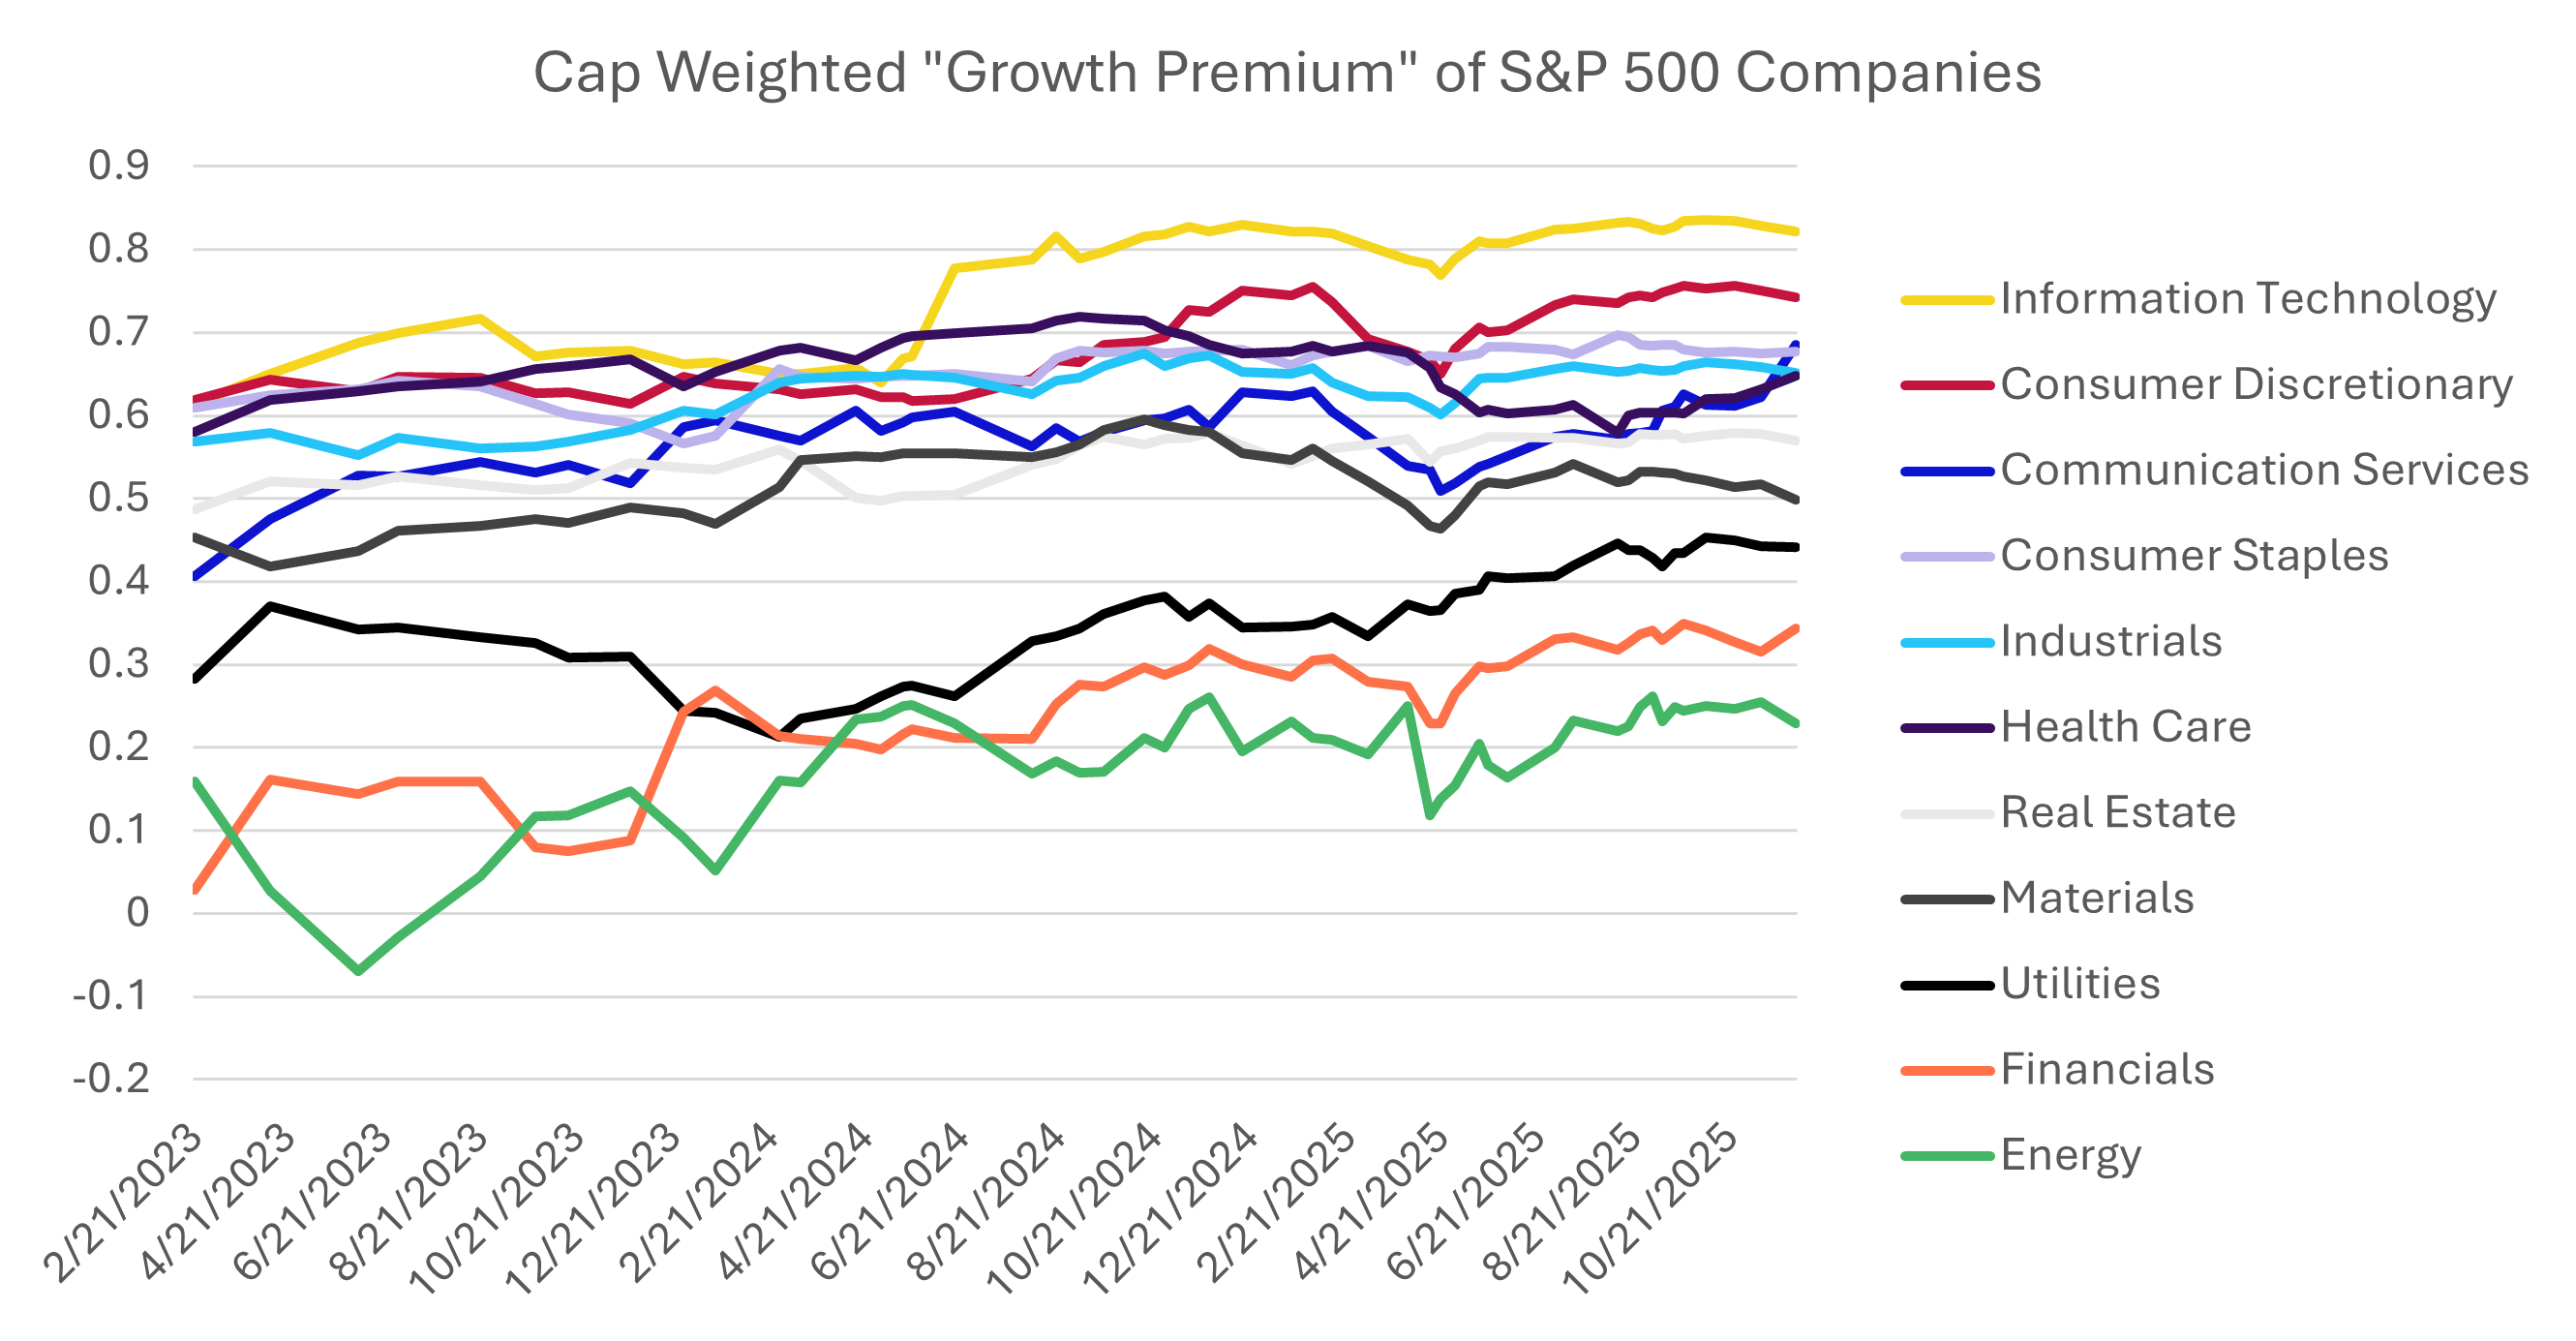
Our database on US equity fundamentals only goes back to the 4th quarter of 2022, so unfortunately my analysis is capped there, but we can still get an idea of the relative “expensiveness” (i.e., the growth premium) of each of the 11 S&P 500 equity sectors over the last 11 quarters.[5]
The S&P 500 Is Running Hot
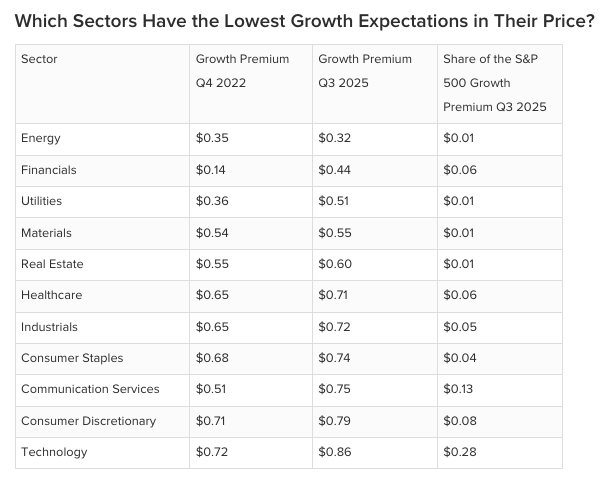
Using Q4 2022 earnings reports, the growth premium for the entire market cap-weighted S&P 500 was 59 cents per dollar. As of Q3 2025, the growth premium has increased to 72 cents per dollar (an increase of 22.6%). That’s an annual rate of inflation of 7.71%.
Just looking at the change from Q2 2025 to Q3 2025, the quarterly rate of inflation was 2.28%, annualized to 9.45%. The market is running hotter than eating out at the moment![6] The only major categories increasing by as much or more in the latest CPI were Fuel Oil and Utility (Piped Gas) Services (as we’ll see shortly, there is interestingly a similar dynamic in the S&P 500).

The sort order of this list has not changed a great deal at the top or bottom since Q4 2022, with the major exception of Communication Services. Utilities had a large increase in growth premium but the relative position didn’t change much.
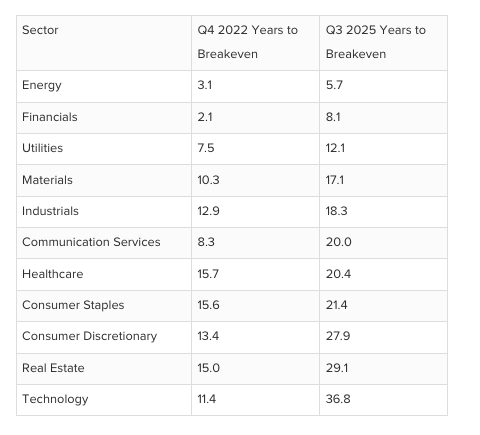
To put some of these numbers into perspective, I also computed how many additional years (beyond the assumed initial 3) one would have to own an average company from the Sector in order to make back the growth premium in earnings flows (again assuming no change in earnings relative to market cap).
When adding the initial assumed three years of earnings, some of these sectors now have breakeven holding periods longer than my mortgage term! Perceptions of affordability are not just about current price levels, but also how prices have changed compared to prior periods (i.e., the rate of inflation – in the markets we generally refer to this as appreciation, which sounds much more pleasant and it is when you own the asset).
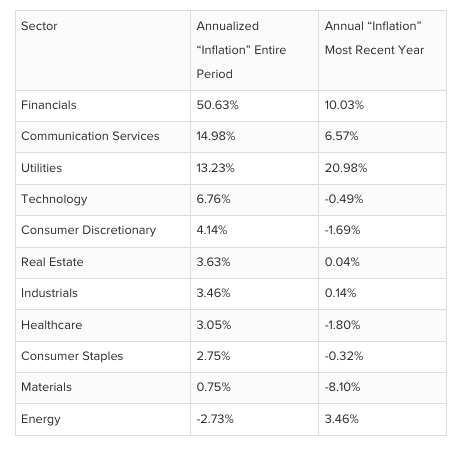
I mentioned earlier that Utility-related items being the largest source of price increases in the latest CPI had a corollary in the stock market and we see it here – the growth premium for the average public utility company has increased by 13% over the analysis period and by almost 21% in the most recent year.
This data suggests the relative growth expectations are falling the most for Energy, Materials, Consumer Staples, and Health Care – essentially all sectors with minimal exposure to the “AI” trade. Expectations for growth are increasing the most, on the other hand, for Financials (the AI trade lenders), Communication Services (Meta and Google basically), Utilities (the AI trade power suppliers), and somewhat unsurprisingly, Technology (though it is coming down somewhat in 2025).
Conclusion
US Stock Market prices are currently pricing in greater growth expectations than they have at any time in the last three years. But does this reflect greater expectations for growth, or just a higher willingness to pay for potential growth? Which is to say, are investors paying more to get more, or are they paying more to get the same or less (what is referred to in the grocery store as “shrinkflation”)? If we go back to GDP growth expectations, they have not changed much between the end of 2022 and now at the end of 2025. The Federal Open Market Committee (FOMC) in fact was forecasting 3-year forward GDP Growth at 1.8% in 2022 and has the same three-year forward GDP Growth forecast of 1.8% here at the end of 2025.[7] So it looks like US Stock buyers are paying more for the same.
It would be painful for most stockholders if the growth premium normalized to the Q4 2022 level absent a fantastic increase in earnings across the board. The market truly does seem leveraged to the AI trade at this moment, and a lot of wealth is relying on AI revenues meeting fairly rich growth expectations. If these expectations are not met, it could result in pain for the US stockholder even if prices start looking more attractive for the marginal buyer.
For more content from our portfolio managers, follow us on LinkedIn or Subscribe to our Blog
By Andrew Rice, Partner and Portfolio Manager of Algorithmic Investment Models (AIM)
Originally published January 9, 2026
Originally published on ETF Trends
For more news, information, and strategy, visit the ETF Strategist Content Hub.
[1] https://www.bls.gov/news.release/pdf/cpi.pdf
[2] For example, Poll: Trump’s own voters begin blaming him for affordability crisis – POLITICO
[3] Book value is a company’s net worth on its balance sheet, calculated by subtracting Total Liabilities from Total Assets, representing what shareholders would theoretically receive if the company liquidated all assets and paid all debts. It reflects historical costs and accounting values, not necessarily current market value, and is often used with other metrics like market cap to see if a stock is undervalued or overvalued.
[4] Growth Premium = (Price – Book Value – 3 Years of Discounted Trailing 12 Months Earnings) / Price; with discount rate equaling the three-year US treasury yield at the. It can be interpreted as the growth premium per $1 paid for the stock. For individual companies this number can be negative if they are burning significant cash. This example is for illustrative purposes only and does not reflects actual returns achieved by any investors.
[5] All analysis related to the growth premium is AIM internal analysis of EOD Historical fundamental and price data on US stocks from 2/21/2023 (reflecting Q4 2022 earnings) to 12/2/2025 (reflecting Q3 2025 earnings). Prices are used for each date on which we pulled the fundamental data into our data set.
[6] cpi.pdf. Food away from home increased by 3.7% over twelve months as of November 2025.
[7] For end of 2022: fomcprojtabl20221214.pdf. For end of 2025: fomcprojtabl20250917.pdf
Disclosures:
Copyright © 2025 Algorithmic Investment Models LLC. All rights reserved. All materials appearing in this commentary are protected by copyright as a collective work or compilation under U.S. copyright laws and are the property of Algorithmic Investment Models. You may not copy, reproduce, publish, use, create derivative works, transmit, sell or in any way exploit any content, in whole or in part, in this commentary without express permission from Algorithmic Investment Models.
Certain information contained herein constitutes “forward-looking statements,” which can be identified by the use of forward-looking terminology such as “may,” “will,” “should,” “expect,” “anticipate,” “project,” “estimate,” “intend,” “continue,” or “believe,” or the negatives thereof or other variations thereon or comparable terminology. Due to various risks and uncertainties, actual events, results or actual performance may differ materially from those reflected or contemplated in such forward-looking statements. Nothing contained herein may be relied upon as a guarantee, promise, assurance or a representation as to the future.
This material is provided for informational purposes only and does not in any sense constitute a solicitation or offer for the purchase or sale of a specific security or other investment options, nor does it constitute investment advice for any person. The material may contain forward or backward-looking statements regarding intent, beliefs regarding current or past expectations. The views expressed are also subject to change based on market and other conditions. The information presented in this report is based on data obtained from third party sources. Although it is believed to be accurate, no representation or warranty is made as to its accuracy or completeness.
The charts and infographics contained in this blog are typically based on data obtained from third parties and are believed to be accurate. The commentary included is the opinion of the author and subject to change at any time. Any reference to specific securities or investments are for illustrative purposes only and are not intended as investment advice nor are they a recommendation to take any action. Individual securities mentioned may be held in client accounts. Past performance is no guarantee of future results.
As with all investments, there are associated inherent risks including loss of principal. Stock markets, especially foreign markets, are volatile and can decline significantly in response to adverse issuer, political, regulatory, market, or economic developments. Sector and factor investments concentrate in a particular industry or investment attribute, and the investments’ performance could depend heavily on the performance of that industry or attribute and be more volatile than the performance of less concentrated investment options and the market as a whole. Securities of companies with smaller market capitalizations tend to be more volatile and less liquid than larger company stocks. Foreign markets, particularly emerging markets, can be more volatile than U.S. markets due to increased political, regulatory, social or economic uncertainties. Fixed Income investments have exposure to credit, interest rate, market, and inflation risk. Diversification does not ensure a profit or guarantee against a loss.
The S&P 500 Index measures the performance of 500 large U.S. companies across various industries and is weighted by market capitalization, giving larger companies greater influence on the index.
Algorithmic Investment Models LLC (AIM)
125 Newbury St., 4th Floor, Boston, MA 02116 (844-401-7699)
A message from Advisor Perspectives and VettaFi: Discover something new! Click here to register for our upcoming webcasts.
Read more commentaries by Algorithmic Investment Models