Eight Disinflationary Forces
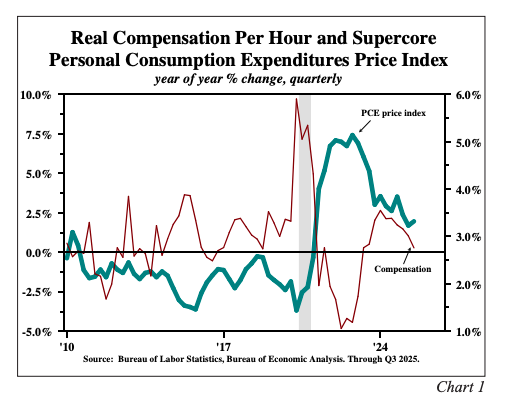
Concerns over accelerating inflation persisted throughout 2025. However, these anxieties were unwarranted as wage and price increases slowed in response to eight influential factors that also suggest that last year’s disinflation will persist in 2026 (Chart 1). First, labor markets weakened broadly, even in the face of widespread assertions of labor market resilience. Second, growth in real disposable income slowed sharply and the saving rate declined, as many low- and middle-income households faced a challenging year—signs that both current and future consumer spending power was eroding. Third, monetary conditions proved more restrictive than widely recognized, even as the Federal Reserve cut the Federal Funds rate in both 2024 and 2025. Fourth, fiscal policy unexpectedly tightened due to a notable reduction in the federal budget deficit. Fifth, more U.S. manufacturing plants outside the AI sector became idle. Sixth, major economies abroad, including China, Japan, Germany, and the UK, experienced stagnation like conditions. Seventh, a scholarly econometric study indicates that while tariff hikes initially boost inflation, their longer-term effect is to suppress demand and contribute to disinflation. Eighth, AI is disinflationary, cyclically and secularly. This case for disinflation begins with the labor market, given its central role in the inflation dynamic.

More Labor Market Slack
Household and Payroll Surveys. The U.S. unemployment rate rose to 4.4% in late 2025, up from 4.1% at the end of 2024 and up from a cyclical low of 3.4% in 2023. In a sign of an even more serious deterioration in the labor market, the broader unemployment rate jumped from 7.5% in January to 8.4% in December as full time work was not available and many took available part time jobs. In December, the Conference Board’s labor differential (the difference between consumers who say jobs are hard to get and those who say jobs are plentiful) dropped to its lowest level in more than 4 years. The ratio of part-time to full-time household jobs surged sharply this year. The high multiplier manufacturing sector dropped 68,000 jobs in 2025, with eight consecutive declines in the second half of the year.
Quarterly Census of Wages and Salaries (QCEW). In 2023 and 2024, payroll employment growth significantly exceeded the QCEW figures (which are compiled from 12 million institutions in the U.S. and reported with a six-month lag). From the second quarter of 2024 to the second quarter of 2025, the overshoot was even more massive. Based on regular monthly reporting, the Bureau of Labor Statistics (BLS) initially reported that payroll jobs rose by 1.923 million. Then, earlier in 2025, the BLS revised this gain down to 1.524 million, or about 180,000 per month. In December, the QCEW lowered the twelve-month increase to 420,000, an overshoot of 73% and a very meager average monthly increase of approximately 35,000. Since the unemployment rate rose sharply after the latest QCEW was compiled in last year’s second quarter, the overshoot has worsened. The implications of such errors are impossible to list. Based on these figures, financial markets traded, the Fed reached decisions and provided extensive forward guidance, and nonfinancial firms adjusted their decisions on hiring, capital spending, and a host of other factors.
Spending Capabilities
A leak in the circular flow. One of the foundational principles of macroeconomics is that total spending (GDP) should equal total income (GDI). Yet, Bureau of Economic Analysis data shows the level of GDP has exceeded GDI for twelve consecutive quarters. Such a sustained, one-sided gap suggests more than just random statistical error; it signals a potential structural problem in the flow of income and expenditures. The divergence was particularly severe in the third quarter, as real GDP growth rate surged to 4.3% while real GDI growth slowed to a 2.4% rate, underscoring the disconnect.
Real disposable personal income. Real disposable income was unchanged in the third quarter of 2025, a phenomenon that should not happen in a supposedly robust economy. In the first three quarters of 2025, real disposable personal income grew at a 1.4% annual rate, down sharply from 2.5% in 2024. These numbers, however, are significantly inflated because the official personal income computations are based upon monumentally overstated payroll employment figures. The faulty income levels result in corresponding inflation of household income and the personal saving rate (PSR). The drop in the PSR to a paltry 4.2% in the third quarter financed all the 3.5% rate of increase in real personal consumption expenditures. But, in reality, the PSR is even lower.
Consumers enter 2026 with exceedingly weak financial health. Large tax refunds from the 2025 tax cut are arriving early in the year. These refunds are badly needed to repair the consumer's balance sheet. As such the funds may go into saving rather than spending. This was also the case in the first and second years after the 1981 Reagan administration tax cut. The economy did not accelerate in a noticeable way until 1984, a similar lag to the one experienced after the Trump tax cuts of 2017.
Monetary Conditions
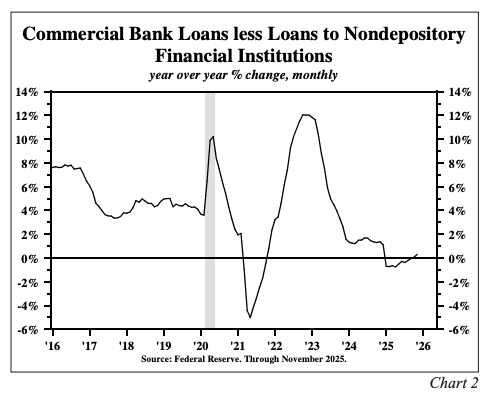
Commercial bank loans and leases, excluding lending to non-depository financial institutions, remained virtually unchanged in nominal terms in 2025 (Chart 2). Thus, banks channeled funds to high-risk areas, such as private credit and private equity which left fewer resources for consumers and small businesses even after 175 basis points in Fed rate cuts since September 2024.
Loan rates to lower-risk consumers and small business borrowers declined but stayed high. Rates for riskier borrowers barely changed. Delinquencies and bankruptcies increased, limiting credit availability. Top tier credit card rates remain above 21%. Small Business Administration loans start at 10%-12%. Further Federal Funds rate cuts may not significantly improve borrowing conditions for most consumers and small businesses.
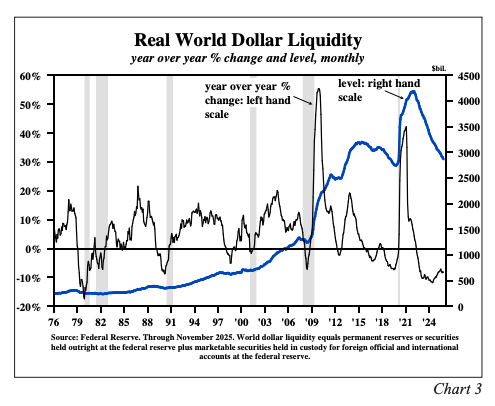
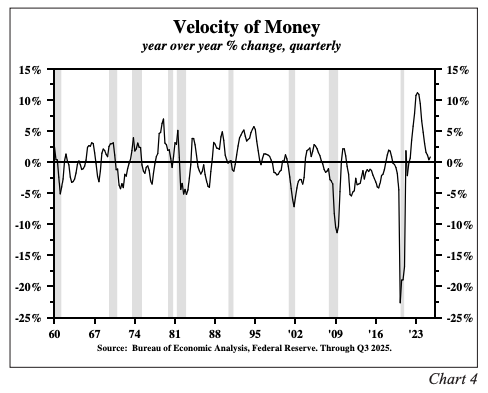
In 2025, real world dollar liquidity (WDL) fell by 8.3%, marking a fourth year of decline (Chart 3). WDL usually grows 10% a year. The Fed’s $40 billion monthly Treasury bill purchases won't restore WDL, as operating factors (currency and treasury deposits) offset them. Growth in real other deposit liabilities (ODL) at banks appears to have been the weakest quarterly growth rate of the year, based on preliminary and incomplete data. The rate of growth in M2 velocity decelerated sharply from its peak (Chart 4), signaling tighter credit conditions outside the banking system.
Federal Budget Reduction
For the twelve months ending December 2025, the U.S. budget deficit totaled $1.7 trillion, down from $2.0 trillion for the comparable year ago period. This marks a $0.3 trillion drop. As a share of GDP, the deficit was about 0.6% lower, but exact data are not yet available. Tariff revenues contributed 62% of the deficit reduction.
If the Supreme Court rules the President’s use of IEEPA (International Economic Emergencies Power Act) was illegal, other laws may enable the Trump administration to raise the same dollar amount from tariff revenues in 2026 as in 2025, providing that a refund of the tariffs already collected is not ordered by the Supreme Court.
Idle Plants and Stagnate Conditions Abroad
From their peaks in 2021-22, capacity utilization (CAPU) in the United States, the EU, and China all fell. The Chinese decline was lower than that of the U.S. and the EU. Yet redundant capacity appears much worse in China. Highly regarded macro strategist Gerard Minack described it this way: "China’s excess capacity hangs over the world. China keeps investing at a stonking rate, but domestic consumption is a low share of GDP. This is not a new story, but it is more acute. Cutthroat competition from China puts pressure on other countries. The excess capacity causes lasting domestic price declines."
While data is insufficient to isolate the situation in legacy industries from those tied to AI and related, poor performance in legacy industries can be inferred from correlated indicators. A significant drop in both trucking and rail freight occurred in 2025, with indications that the combined decline could be a hefty 5%. Weakness in S&P Global’s purchasing managers' index for the EU suggests a downturn in their legacy industries as well.
Tariffs
Many believe that tariffs are inflationary. However, Régis Barnichon and Aayush Singh, in a study of 150 years of tariff policy (Federal Reserve Bank of San Francisco Working Paper 2025), found that higher tariffs lead to lower economic activity and more unemployment. This puts downward pressure on overall prices. Their conclusion runs counter to standard trade model predictions. A four percentage-point increase in the historical average tariff rate reduces inflation by about two percentage points and raises unemployment by one percentage point. These results are consistent across time periods (pre-1913, interwar, post-WWII) and econometric methods. They conclude that tariff shocks act like aggregate demand shocks.
The responses of inflation and unemployment differ from those predicted by the standard cost-push trade model. Standard models expect tariffs to raise import costs and inflation. The authors interpret their evidence as showing that tariff shocks impact the economy through an aggregate demand channel. Barnichon and Singh write, “tariff increases may introduce uncertainty, reduce confidence, and cause asset price declines. These changes suppress demand, lower inflation, and increase unemployment.”
We conclude that Barnichon and Singh’s findings are consistent with the view that the tariff hikes of 2025 reinforce the path to a lower inflation rate in 2026.
AI
As firms shift from labor to AI, the effect is widely considered to be disinflationary. But another aspect of AI may also put downward pressure on wages and prices. Steamships, railroads, and the dot-com boom all revolutionized the economy and ultimately achieved resounding commercial success. Yet each shared a critical flaw common to breakthrough technologies: massive capital investment poured in long before sustainable profits materialized. During the boom years, capacity expanded far beyond near-term demand, sowing the seeds for the busts that culminated in the recessions of 1837–38, 1873–75, and 2000-01. As prices fell, the burden of servicing and amortizing the expansion-phase debt intensified—a classic case of “debt de/ disflation.” Economic growth remained weak well after the recessions technically ended.
If artificial intelligence follows a similar trajectory—characterized by hefty upfront investment, delayed profits, and rapid expansion— this would be an additional disinflationary force. Like its predecessors, AI could generate excess capacity, compress margins, and restrain income growth, all of which would reinforce disinflationary pressures.
Final Reflections
The Fisher equation, which states that the yield on risk-free long-term bonds equals the real interest rate plus expected inflation, is a cornerstone of macroeconomic theory, much like the circular flow model. As a result, inflation has typically shown a strong correlation with thirtyyear Treasury bond yields. Currently, a notable slowdown in labor compensation and steady productivity advances in the nonfarm sector have limited unit labor cost growth to just 1.2% over the past four quarters. Since labor makes up around 70% of total production costs, this trend reinforces ongoing disinflationary forces and points to further easing of inflation expectations in 2026. Accordingly, we believe the outlook for long term Treasury bond yields to decline appears increasingly likely.
Van R. Hoisington
Lacy H. Hunt, Ph.D.
A message from Advisor Perspectives and VettaFi: Discover something new! Click here to register for our upcoming webcasts.
DISCLOSURES
Hoisington Investment Management Company (HIMCo) is a federally registered investment adviser located in Austin, Texas, and is not affiliated with any parent company.
The information in this market commentary is intended for financial professionals, institutional investors, and consultants only. Retail investors or the general public should speak with their financial representative. Information presented is for educational purposes only and does not constitute an offer or solicitation for the sale or purchase of any securities, investment products or advisory services.
Information herein has been obtained from sources believed to be reliable, but HIMCo does not warrant its completeness or accuracy; opinions and estimates constitute our judgment as of this date and are subject to change without notice. This memorandum expresses the views of the authors as of the date indicated and such views are subject to change without notice. HIMCo has no duty or obligation to update the information contained herein. This material is intended as market commentary only and should not be used for any other purposes, including making investment decisions. Certain information contained herein concerning economic data is based on or derived from information provided by independent third-party sources. Charts and graphs provided herein are for illustrative purposes only.
This memorandum, including the information contained herein, may not be copied, reproduced, republished, or posted in whole or in part, in any form without the prior written consent of HIMCo.
© Hoisington Investment Management
Read more commentaries by Hoisington Investment Management