Hello, investors! Chuck Carnevale here—Mr.Valuation. As many of you know, my passion has always been helping investors understand company fundamentals so they can make sound, data-driven decisions.Today, I want to cover an essential accounting technique I frequently use with my Fundamentals Analyzer software: horizontal analysis.
This powerful tool allows us to evaluate financial performance over time, helping us identify trends, strengths, and potential warning signs. For serious long-term investors, it’s simply indispensable.
What Is Horizontal Analysis?
At its core, horizontal analysis isa method of evaluating financial statements across multiple periods. Instead of looking at just one year in isolation, we compare line items from consecutiveyears to determine how a company is progressing over time.
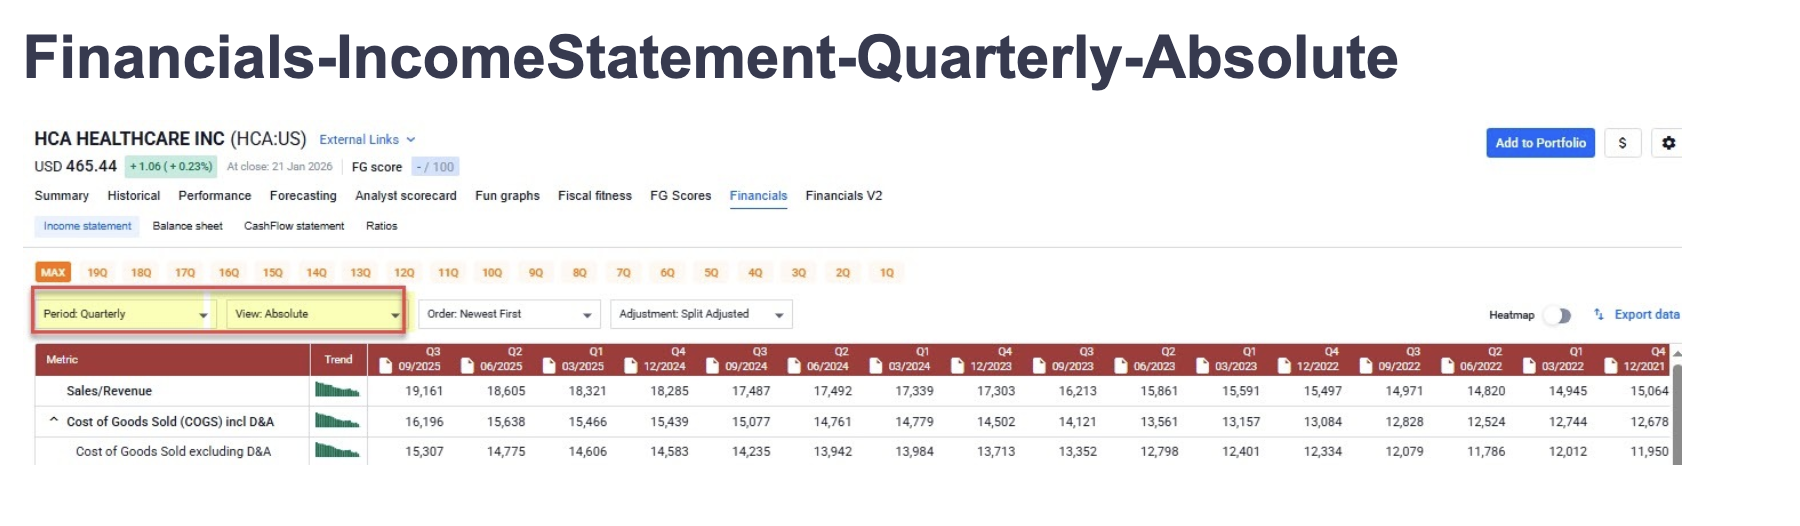
In practical terms, horizontal analysis of comparative financial statements includes the calculation of both absolute dollar changes and percentage changes from one period to the next.This approach converts static numbers into dynamic insights.
When viewed properly, a horizontal financial statement tells a story—revealing whether revenue is accelerating, margins are improving, or expenses are creeping higher. It givesinvestors a clear picture of a company’s financial trajectory.

How to Perform Horizontal Analysis
When I conduct a horizontal analysis, I begin by loading multiple years of financial data into the horizontal financial statement model inside my Fundamentals Analyzer tool.
From there, I calculate:
- Dollar changes year over year
- Percentage changes year over year
Each income statement, balance sheet, and cash flow line item is evaluated side by side. This process allows me to quickly identify trends that might otherwise remain hidden in raw financial statements.
What matters most is context. Numbers alone don’t tell the full story. As investors, we must interpret those changes within the broader business environment.
Key Metrics in Horizontal Analysis
While every line item deserves attention, I place particular emphasis on:
- Revenue growth
- Gross profit
- Operating expenses
- Net income
- Free cash flow
By examining these metrics across several periods, the horizontal financial statement model helps us assess management effectiveness, cost control, and overall business momentum.
This is where horizontal analysis truly shines. It transforms historical data into a narrative about how the business is evolving—and whether it’s moving in the right direction.
Example of Horizontal Analysis
Let’s keep it simple.
Suppose Company X reported:
- Revenue of $100 million in 2024
- Revenue of $120 million in 2025
Horizontal analysis immediately shows:
- A $20 million increase
- A 20% year-over-year growth rate
Apply this same methodology to operating income, earnings, and cash flow, and you quickly gain a comprehensive understanding of what’s driving performance.
That’s the practical power of a horizontal financial statement—it highlights both opportunity and risk.
Drawbacks of Horizontal Analysis
Although extremely useful, horizontal analysis is not perfect.
Short-term distortions can occur due to one-time events such as asset sales, acquisitions, or restructuring charges.Additionally, horizontal analysis does not automatically account for inflationor broader industry cycles.
That’s precisely why I never rely on it in isolation. Instead, I combine it with other analytical tools inside theFundamentals Analyzer to ensure a well-rounded evaluation.
Horizontal Analysis vs. VerticalAnalysis
Both techniques are valuable, but they serve different purposes.
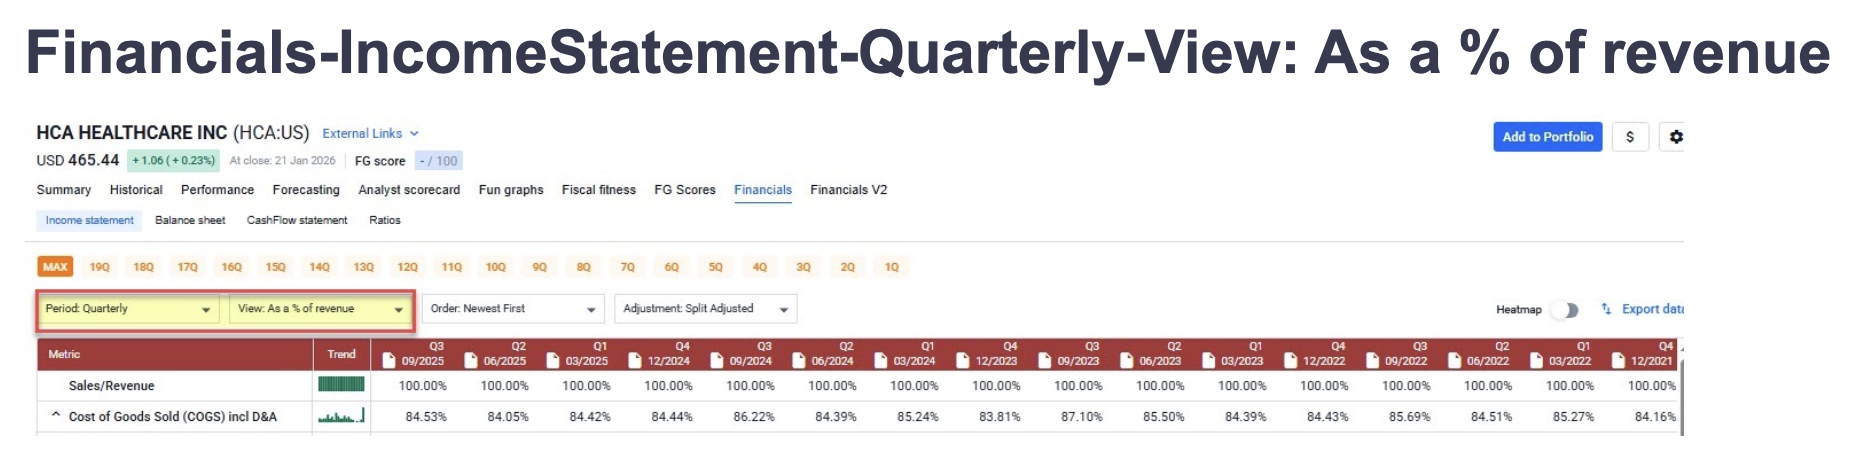
Horizontal analysis examines financialperformance across multiple periods to identify trends and growth patterns.Vertical analysis, on the other hand, looks at a single period and expresses each line item as a percentage of a base figure—such as total revenue or totalassets.
Used together, these approaches provide a multidimensional perspective. The horizontal financial statement model reveals direction over time, while vertical analysis clarifies internal structure.
Savvy investors employ both.
Conclusion
In closing, horizontal analysis remains one of the most important tools in an investor’s toolbox. By evaluating trends across time, it allows us to move beyond surface-level numbers and truly understand a company’s financial progress.
When combined with comprehensive platforms like my Fundamentals Analyzer, horizontal analysis empowers investors to make informed, confident decisions rooted in fundamentals.
Frequently Asked Questions (FAQs)
Why are horizontal and vertical analys is important in financial analysis?
Horizontal analysis reveals trends overtime, while vertical analysis shows how financial components relate within a single period. Together, they offer a complete financial picture.
Can horizontal and vertical analysis be used together?
Absolutely. Using both provides deeper insight into performance trends and financial structure.
How do investors use horizontal analys is in decision-making?
Investors rely on horizontal analysis to identify growth momentum or emerging red flags, helping determine whether a company’s financial condition is improving or deteriorating.
What industries benefit most from vertical analysis?
Industries with complex cost structures—such as manufacturing and retail—often gain the most from vertical analysis because it clarifies expense relationships relative to revenue.
Thanks for joining me on this valuation journey. Stay analytical, stay informed, and always demand the full picture before investing.
A message from Advisor Perspectives and VettaFi: Discover something new! Click here to register for our upcoming webcasts.
© F.A.S.T. Graphs
Read more commentaries by F.A.S.T. Graphs