Dispersion
Membership required
Membership is now required to use this feature. To learn more:
View Membership BenefitsWe believe we’re entering a new era of dispersion in the performance of financial assets. Behind buoyant index averages are sharply bifurcated cohorts of winners and losers. Equities are flying high but remain mostly propelled by a handful of AI superstars. Credit appears healthy in aggregate, but there’s a notable tail of unloved names. Economic growth looks robust but masks clear divergence in the experience of high- and low-income consumers, a phenomenon now termed the “k-shaped economy.” These dynamics serve as a reminder that averages shouldn’t be relied upon in a sophisticated investment process.
During the low-interest-rate environment of 2009-2021, credit was “bunched up,” with limited dispersion around the index spread. Now yields are much healthier, but a tougher backdrop (and perhaps the residual impact of the prior period being too easy) means we’re returning to a world where mistakes are punished – and potentially capitalized on. As Howard Marks recently wrote, the next phase is set to be more “interesting.”
The U.S. Economy: K-Shaped
U.S. economic data remains challenging to interpret, though the headline metrics appear mostly positive. GDP growth has certainly surprised to the upside, recording an annual rate of 4.4% in 3Q2025. Resilient consumer spending has been a big contributor, but there’s a more complex picture behind the headlines.
Aggregate consumption is reliant on a narrow cohort of high-income consumers, who’ve benefited the most from significant stock-market gains and continued to spend. (See Figure 1.) Meanwhile, the low-income consumer doesn’t look quite so buoyant. This segment benefited from strong salary growth in the wake of the pandemic, but this has now tailed off, down to 1.4% YoY compared to 4.0% for high-income households.1 Lower-income consumers have reduced their spending in several key categories, such as clothing and airlines, both categories in which high-income consumers have increased expenditure.2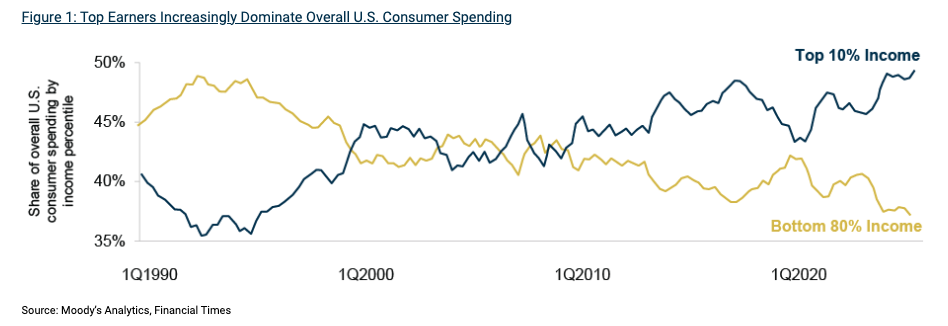
Similarly, overall capital expenditure metrics have been propped up by a dramatic increase in AI-related spending. Hyperscalers’ capex is estimated to have reached around $400 billion in 2025 amid the well-publicized AI arms race.3 This represents an astonishingly high percentage of their revenue and remains complicated by a lack of clarity regarding return on investment. But right now, these companies are still soaring.
Equities: AI and Everything Else
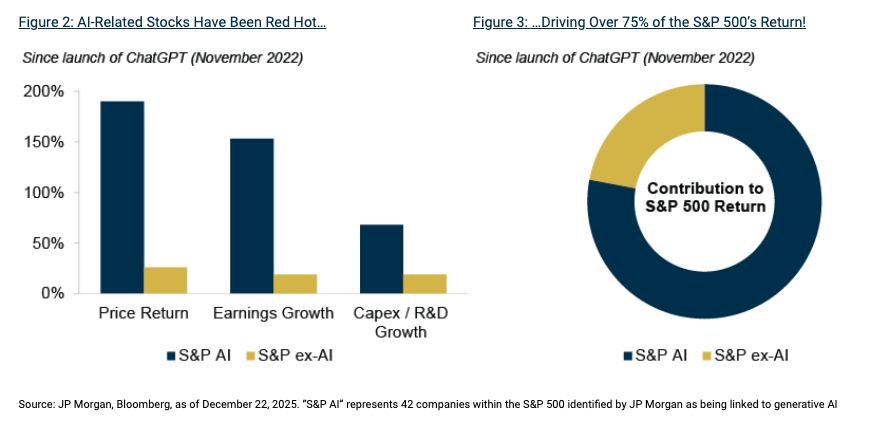
The S&P 500 once again confounded expectations to record a 16% return in 2025, marking its third consecutive year of double-digit gains. Where have the gains come from? AI: since the launch of ChatGPT in 2022, a relatively small group of AI-related stocks have driven a full three quarters of the S&P 500’s return.4 (See Figures 2 and 3.) It follows on that the major U.S. equity index has become very concentrated, with the 10 largest companies – mostly big tech – representing nearly 40% of the index.
This leaves a portion of the index comprised of many companies that haven’t dramatically increased earnings and aren’t contributing meaningfully to investor returns. It’s particularly visible when looking at the divergence in performance between sectors: the S&P 500 Info Tech index boasts a three-year annualized return of 33.8%, but Consumer Staples languishes at 6.5%, Energy at 1.8%, and Real Estate at 1.9%.5 In short, there’s only been one game in town.
Credit: Haves and Have-Nots
“Tight spreads but good yields” has become the familiar refrain in the sub-investment grade credit universe. While that’s broadly accurate, looking under the hood gives a more nuanced perspective.
Mind the Spread Gap
The senior loan index currently offers a yield of 7.9%, but BB-rated loans are at 5.7% and CCCs are at 16.1%!6 (See Figure 4.) It’s a similar story in the high yield bond universe, where index dispersion is the highest on record.7 Even within rating brackets, there’s meaningful dispersion: over 40% of CCC-rated high yield bond market value trades within a 400 bps spread – but 12% trades at over 1500 bps, reflecting the importance of a credit-by-credit investment approach.8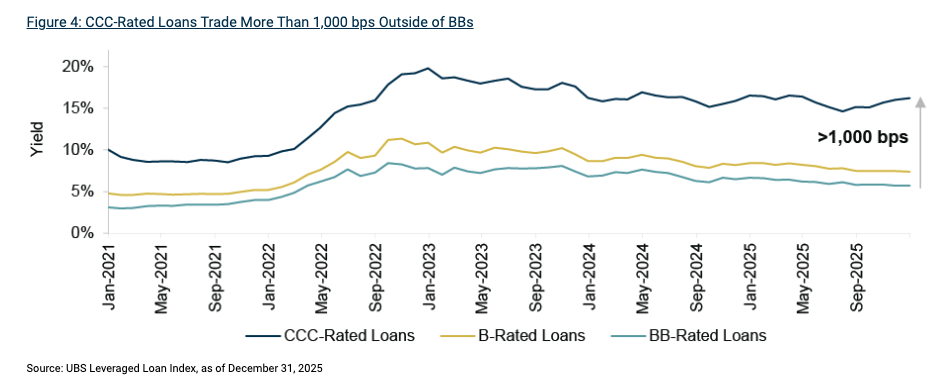
So why are unloved names falling so far through the cracks?
- Weak credit documentation has heightened fears of poor recoveries, meaning struggling names can face immediate selling pressure. The data justifies this fear. While payment default rates remain low, recoveries are well below their long-term average: the recovery rate on first-lien loans stands at 37.7% versus the 25-year average of 62.3%.9
- In the case of broadly syndicated loans, the dominant buyer – CLOs – has limited appetite for stressed loans. These managed vehicles must meet strict tests, including on CCC exposure, and must be relatively free of stress to secure economical financing from liability investors. This leads to structurally reduced demand for stressed credits.
- Aside from technical pressure (i.e., fewer willing buyers for structural reasons), some credits are trading at elevated spreads because they’re fundamentally troubled. A good portion of CCC-rated credits are genuinely under significant strain: 40% of CCC-rated borrowers have operating cash flow coverage below 1.0x.10
Combine these factors, and it’s clear why certain names become pariahs. Encouragingly, part of the problem is that solid yields on performing names mean certain investors don’t need to reach for risk: performing credit investors can construct high-income portfolios without purposefully buying heavily discounted names. Meanwhile, more specialized investors might want to access oversold names, particularly if they have the capabilities to come out on top in a potential liability management exercise or restructuring.
Performing and PIKing
In the private credit world, dispersion is harder to map out. Without a developed secondary market, true price discovery is limited. However, it seems private credit loans are also increasingly bifurcated into fundamentally solid and fundamentally struggling, reinforcing the importance of selectivity.
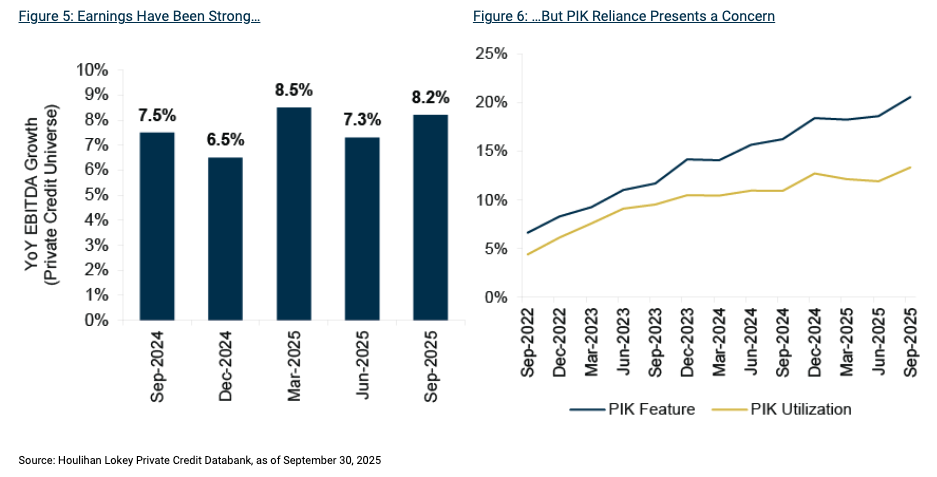
Earnings have been generally strong, with EBITDA growth of over 8% YoY in 3Q2025, and net leverage has trended down over recent quarters.11 (See Figures 5 and 6.) Default rates also remain very low, but there’s some stress under the surface, manifesting most evidently in the form of a reliance on payment-in-kind (PIK) interest as opposed to cash payment. Roughly 20% of private loans have PIK optionality and over half have ended up taking the option.12 But the good news is the instances where PIK emerges after the origination of a deal due to borrower stress remain relatively limited, representing around 4-5% of private loans.13
The direct lending market has expanded significantly (and rapidly) to reach a similar size to the more established broadly syndicated loan market. It continues to present excellent opportunities for income-seeking investors, but the next phase of direct lending is likely to be defined by selectivity and risk management as opposed to origination volume. Accessed prudently, the direct lending market remains a valuable core of private credit portfolios, augmented by less-tapped verticals such as asset-backed finance and various sectorial niches.
What Next?
A dispersed market requires a nuanced management approach, rewarding both prudent risk control and intrepid opportunism. Relying on index averages won’t be enough, as the performance of assets within the same universe drift apart. Part of the conundrum, as always, will be delineating between assets that are (a) unreasonably discounted due to psychological aversion and (b) appropriately discounted because they’re fundamentally flawed.
The vast scale of the sub-investment grade credit markets means both the performing bulk and stressed subset will each be of significant absolute volume. There’s potentially excellent income opportunity accessible through the performing side of the private and liquid credit markets, while the few percent of distress also creates a substantial dislocation opportunity.
Credit Markets: Key Trends, Risks and Opportunities to Monitor in 1Q2026
(1) Supply on the Horizon?
In today’s technically driven credit markets, the level of supply may be the defining factor determining the direction of spreads in 2026. New issuance has been limited over the past few years, putting downward pressure on credit spreads amid a sustained wave of demand from yield-seeking investors. There are positive signs that deal activity may be returning, with M&A trending upward in 2025. (See Figure 7.) However, depressed private equity activity remains the main barrier to serious credit issuance, and, consistent with our dispersion theme, timely exits remain much easier for high-quality portfolio companies, leaving less-desirable businesses held for an extended period.
We discussed the outlook for European credit supply in more detail in a recent podcast.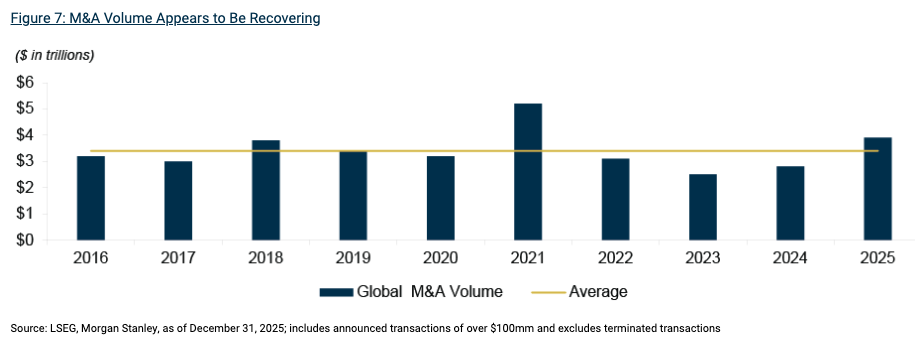
(2) Return of Term Premium
The yield curve was inverted for all of 2023 and most of 2024, with the two-year treasury yield briefly exceeding the ten-year by over 100 bps in 2023. (See Figure 8.) More recently, it’s been around 65-70 bps the other way, representing a dramatic swing. In short, it seems like term premium – the additional compensation for holding long-dated paper – has returned to the treasury market, as investors fret over sticky inflation and the potential unsustainability of the fiscal deficit.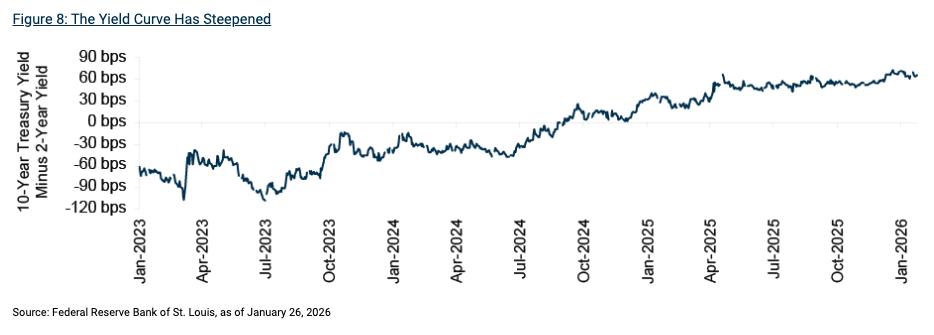
(3) Angel Watch
Nearly $55bn of investment grade debt was downgraded to high yield in 2025, the highest volume since 2020 and far outweighing the volume of rising stars. Barclays predicts an even greater volume next year, at around $70-90bn: notably, this isn’t based on predictions of systematic strife, but a handful of large BBB-rated fallen angel candidates.
Strategy Focus

Oaktree’s Performing Credit Platform
Oaktree Capital Management is a leading global alternative investment management firm with expertise in credit strategies. Our credit platform has $160 billion in AUM and encompasses a broad array of strategy groups that invest in public and private credit instruments across the liquidity spectrum.21 All Oaktree investment activities operate according to a unifying philosophy that emphasizes key principles including the primacy of risk-control and benefits of specialization.
A message from Advisor Perspectives and VettaFi: Discover something new! Click here to register for our upcoming webcasts.
Endnotes
1BofA Consumer Checkpoint, as of December 10, 2025.
2BofA Consumer Checkpoint, as of November 12, 2025.
3CreditSights, projection of $443bn in 2025 capex, as of November 10, 2025.
4JP Morgan, Eye on the Market, January 1, 2026.
5S&P 500 index data, as of January 21, 2026.
6UBS Leveraged Loan Index.
7Barclays Credit Outlook, as of December 3, 2025.
8Ibid.
9JP Morgan December Default Monitor.
10Barclays Credit Outlook, as of December 3, 2025.
11Lincoln International, as of 2Q2025.
12Houlihan Lokey, as of September 30, 2025.
13Ibid.
14ICE U.S. Corporate Index for all return data; Bank of America for all issuance data (reflects U.S. issuance).
15ICE BofA US High Yield Constrained Index for all U.S. High Yield Bonds return data; ICE BofA Global Non-Financial High Yield European Issuer Excluding Russia Index for all European High Yield Bonds data; JP Morgan for all U.S. default rates; UBS for all European default rates (including distressed exchanges); PitchBook LCD for all U.S. and European issuance data (including refinancings).
16S&P UBS Leveraged Loan Index for all U.S. Senior Loans return data; S&P UBS Western Europe Leveraged Loan Index (EUR Hedged) for all European Senior Loans return data; JP Morgan for all U.S. default rates and issuance data; UBS for all European default rates (including distressed exchanges); PitchBook LCD for all European issuance data (including refinancings).
17JP Morgan Corporate Broad CEMBI Diversified High Yield Index for all return data; JP Morgan for default rates (including distressed exchanges) and issuance (including refinancings) data.
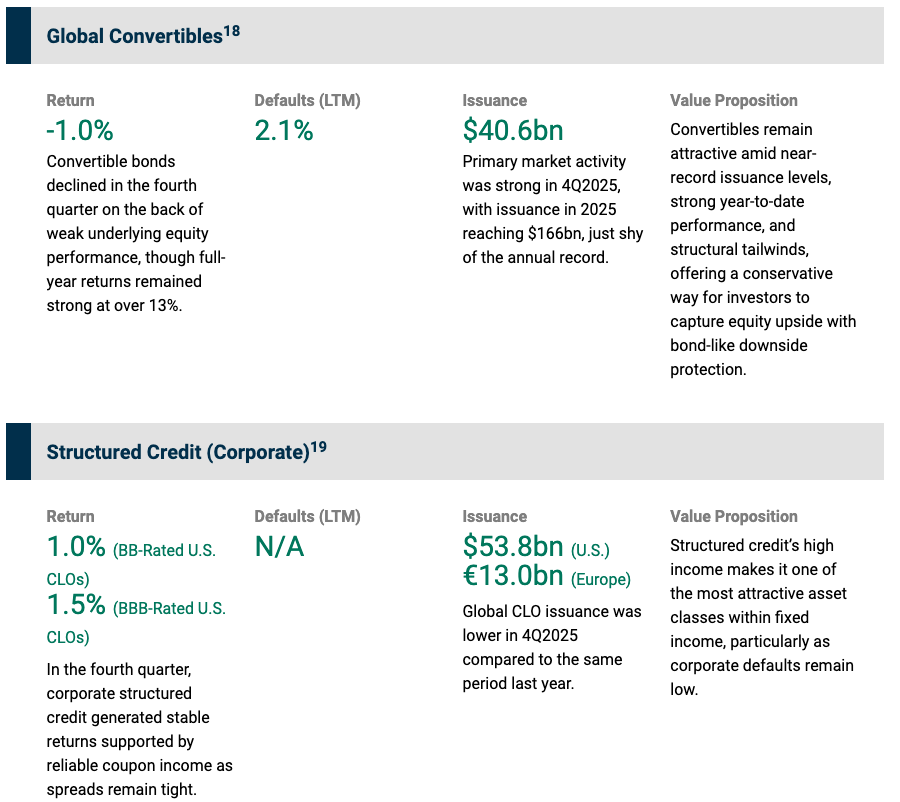
18Refinitiv Global Focus Convertible Index for all return data; Bank of America for default rates and issuance data.
19JP Morgan CLOIE BB Index and JP Morgan CLOIE BBB Index for all return data; JP Morgan Weekly CLO Issuance for all issuance data.
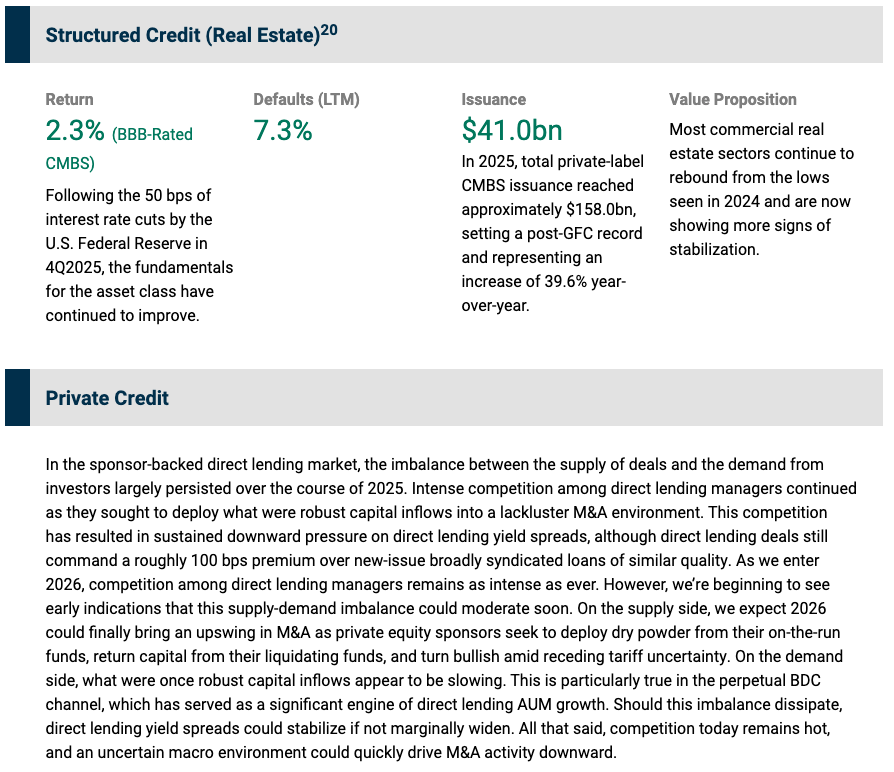
20Bloomberg US CMBS 2.0 Baa Total Return Unhedged Index for all return data; Trepp for default rates (%, 30+ day delinquency, and REO); JP Morgan for all issuance data.
21The AUM figure is as of December 31, 2025 and excludes Oaktree’s proportionate amount of DoubleLine Capital AUM resulting from its 20% minority interest therein. The total number of professionals includes the portfolio managers and research analysts across Oaktree’s performing credit strategies.
Notes and Disclaimers
This document and the information contained herein are for educational and informational purposes only and do not constitute, and should not be construed as, an offer to sell, or a solicitation of an offer to buy, any securities or related financial instruments. Responses to any inquiry that may involve the rendering of personalized investment advice or effecting or attempting to effect transactions in securities will not be made absent compliance with applicable laws or regulations (including broker dealer, investment adviser or applicable agent or representative registration requirements), or applicable exemptions or exclusions therefrom.
This document, including the information contained herein may not be copied, reproduced, republished, posted, transmitted, distributed, disseminated or disclosed, in whole or in part, to any other person in any way without the prior written consent of Oaktree Capital Management, L.P. (together with its affiliates, “Oaktree”). By accepting this document, you agree that you will comply with these restrictions and acknowledge that your compliance is a material inducement to Oaktree providing this document to you.
This document contains information and views as of the date indicated and such information and views are subject to change without notice. Oaktree has no duty or obligation to update the information contained herein. Further, Oaktree makes no representation, and it should not be assumed, that past investment performance is an indication of future results. Moreover, wherever there is the potential for profit there is also the possibility of loss.
Certain information contained herein concerning economic trends and performance is based on or derived from information provided by independent third-party sources. Oaktree believes that such information is accurate and that the sources from which it has been obtained are reliable; however, it cannot guarantee the accuracy of such information and has not independently verified the accuracy or completeness of such information or the assumptions on which such information is based. Moreover, independent third-party sources cited in these materials are not making any representations or warranties regarding any information attributed to them and shall have no liability in connection with the use of such information in these materials.
Membership required
Membership is now required to use this feature. To learn more:
View Membership BenefitsSponsored Content
Upcoming Virtual Events View All


