A couple of weeks ago, on Jan. 23, 2026, we dedicated part of the weekly commentaries to the mismatch between the economy and how American consumers feel about it. We said that measures of consumer confidence and consumer sentiment were not in sync with the strength of economic activity. After that, we presented what we call the “remain invested couple-household,” or “RIC-H,” to characterize those who retired about 10 years ago, and how they are doing today. If you missed this weekly and/or would like to revisit this argument, you can access it by following this link.
Today, we present another angle to this presumed mismatch between the economy and how Americans feel about it. In the recent past, analysts, including us, have argued that there has been a disconnect between soft data (i.e., qualitative data coming from surveys) and hard data (i.e., quantitative data). In many instances, the argument is that soft data does not reflect the truth of how American consumers are doing.
Case in point is the fact that consumer demand has been very strong over the past several years, but consumers continue to feel as if they are not benefiting from this strength in consumption. This mismatch has pushed analysts to look for explanations elsewhere.
Moody’s Analytics estimated last year that the strength in consumer spending was being driven disproportionately by higher-income households. In fact, they found that the top 10% of the income distribution accounted for roughly 49% of total consumer spending, the largest share since 1989. They framed this dynamic as evidence of a “K-shaped” economy, in which certain sectors were performing strongly while other parts of the economy continued to struggle.
The next two series shown in the chart below - a subset of the Consumer Confidence Index produced by The Conference Board, a qualitative survey, and Quits, a quantitative series produced by the Bureau of Labor Statistics - tend to confirm that what American consumers are feeling can be explained outside of consumption metrics.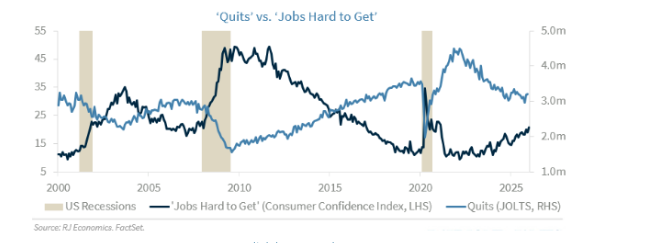
The graph above shows a clear negative relationship (with a negative correlation of 90%) between Jobs Hard to Get, coming from the Consumer Confidence Index, and Quits, coming from the Job Openings report. This means that American consumers are not that wrong, as many have suggested, on their negative view about the US economy, at least from this particular perspective. That is, in this case, there seems to be no mismatch between soft and hard data.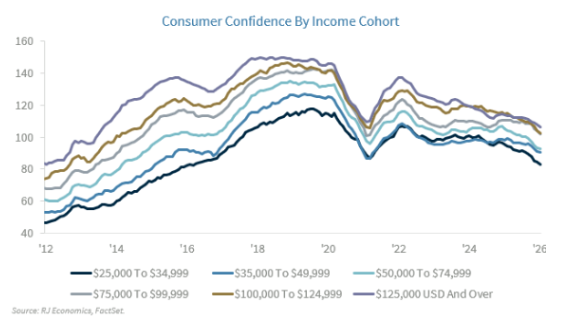
In fact, while lower‑income households have seen their confidence deteriorate more sharply than upper‑income households, sentiment is weakening across the board. Confidence levels are now approaching, or in some cases falling below, the lows reached during the COVID-19 crisis. Coupled with the January Challenger Report, which showed the highest January layoff count since the Great Financial Crisis, the data signals a labor market that has weakened considerably. Households at all income levels are feeling the strain.