The Dow Jones Industrial Average, better known as “the Dow,” closed above 50,000 points for the first time. It’s a historic milestone that comes less than two years after surpassing 40,000 in May 2024, but what does the milestone mean, and does it signal time for investors to reduce exposure?
A historic index with limitations
The Dow is the most commonly cited measure of the US stock market. Its broad recognition stems from its long history. The index was first calculated in 1896, predating the S&P 500 and Nasdaq Composite by decades. Despite its longstanding recognition, it’s not necessarily the best representation of the overall market. It has two major limitations:
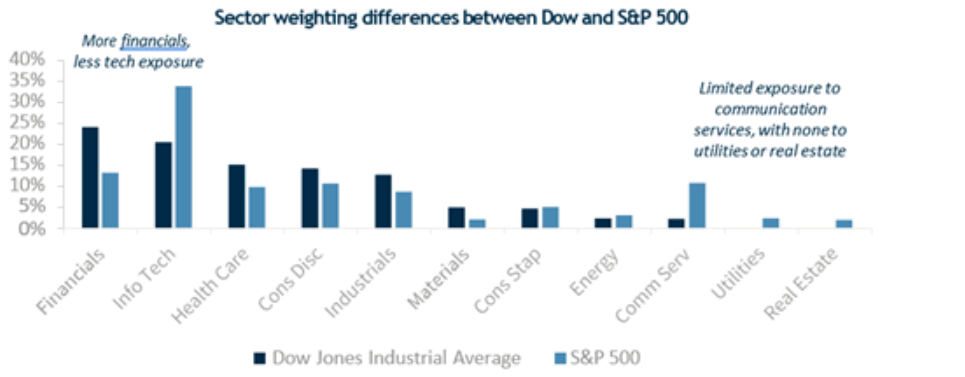
- It includes only 30 companies, making it far less diversified than the S&P 500. Its holdings span nine of the 11 major sectors, omitting real estate and utilities. In several instances, a single company can represent the entire sector – Chevron in energy and Sherwin-Williams in materials, for example.
- The Dow is price-weighted, so companies with higher share prices exert more influence, regardless of size. As a result, a stock like Goldman Sachs can carry more weight than Nvidia simply because its share price is higher, even though Nvidia’s total market value may be much larger.
Despite these quirks, the Dow offers an interesting historical lens on how the US economy has evolved. From its creation to its 50,000 milestone, the index underwent 59 changes to its membership. Longstanding names like General Electric and AT&T came and went, while more recent additions, like Amazon and Nvidia, highlight the growing importance of high-growth industries. Still, traditional “old economy” companies, like Coca Cola and Chevron, remained, keeping the Dow less tech heavy than benchmarks like the S&P 500.

Source FactSet. Data as of 2/6/2026
Reaching 50,000
Between 40,000 and 50,000, 23 of the Dow’s 30 components posted gains. Excluding the newest additions to the index during that period – Nvidia and Sherwin-Williams – the biggest contributors were Goldman Sachs, Caterpillar, IBM, JP Morgan and American Express. On the other side of the ledger, UnitedHealth and Salesforce were the two largest detractors from performance.
Although it has trailed the S&P 500, the Dow’s performance has been impressive by historical standards. After closing above 40,000 in May 2024, the Dow needed only 21 months to climb another 10,000 points. This recent advance is an annualized rate of ~14%, the strongest pace between 10,000 milestones in its history.
Should investors fear milestone events?
History suggests no. Although the Dow’s move above 10,000 in March 1999 eventually came before the dot-com bubble burst, hitting a 10,000 milestone has typically been followed by strong returns. In fact, in the 12 months after previous 10,000 milestones, the Dow delivered an average gain of ~17%. That compares to a ~5% average annualized return since the Dow was created in 1896.
Bottom line
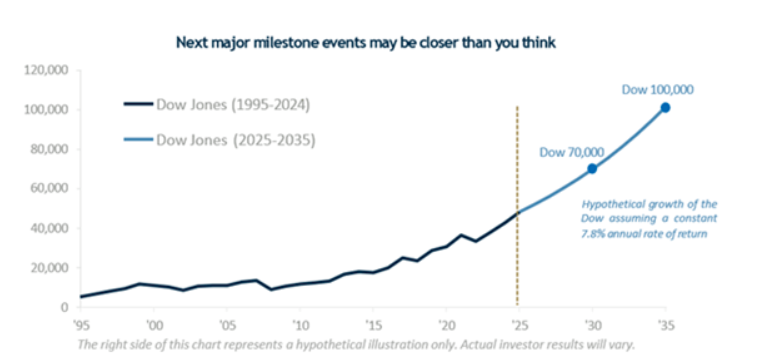
Looking ahead, solid economic and earnings growth should support further gains. While past performance never guarantees future results, it’s worth noting how quickly milestones can arrive as the index gets larger. Each 10,000-point jump represents a smaller percentage increase than the one before it, meaning big round numbers can come faster than many expect. For example, over the past 20 years (January 2006 to January 2026), the Dow has returned ~7.8% annually. If that pace continued, the index could reach 70,000 by 2030 and even 100,000 by 2035. This underscores a key point: the importance of staying invested for the long term.
Source: FactSet The information contained in this (insert) does not purport to be a complete description of the securities, markets, or developments referred to in this material. The information has been obtained from sources considered to be reliable, but we do not guarantee that the foregoing material is accurate or complete. Any opinions are those of the author and not necessarily those of Raymond James. Expressions of opinion are as of this date and are subject to change without notice. There is no guarantee that these statements, opinions or forecasts provided herein will prove to be correct. Investing involves risk and you may incur a profit or loss regardless of strategy selected, including diversification and asset allocation. Past performance does not guarantee future results. Future investment performance cannot be guaranteed, investment yields will fluctuate with market conditions.
Indices are not available for direct investment. Index performance does not include transaction costs or other fees, which will affect actual investment performance. Past performance is not indicative of future results.
S&P 500: This index is a broad-based measurement of changes in stock market conditions based on the average performance of 500 widely held common stocks. It consists of 400 industrial, 40 utility, 20 transportation, and 40 financial companies listed on U.S. market exchanges. This is a capitalization-weighted calculated on a total return basis with dividends reinvested. The S&P represents about 75% of the NYSE market capitalization.
Dow Jones Industrial Average Total Return: This index covers 30 major NYSE industrial companies. The Dow represents about 25% of the NYSE market capitalization and less than 2% of NYSE issues. It is a priced-weighted arithmetic average, with the divisor adjusted for stock splits. This Index includes the effects of reinvested dividends.
This is not a recommendation to purchase or sell the stocks of the companies pictured or mentioned. Sector investments are subject to fierce competition and their products and services may be subject to rapid obsolescence. There are additional risks associated with investing in an individual sector, including limited diversification.
A message from Advisor Perspectives and VettaFi: Discover something new! Click here to register for our upcoming webcasts.
J.D. Power 2025 U.S. Investor Satisfaction Study, which measures overall investor satisfaction with investment firms, was released 3/20/25, based on investors surveyed 1/24-12/24, who may be working with a financial advisor. Based on 7,876 responses from Advised Investors, 1 company out of 24 was chosen as the winner. The award is not representative of any one client’s experience, is not an endorsement, and is not indicative of an advisor’s future performance. The study is independently conducted, and the participating firms do not pay to participate. Use of study results in promotional materials is subject to a license fee. J.D. Power is not affiliated with Raymond James. For J.D. Power 2025 award information, visit jdpower.com/awards.
Links are being provided for information purposes only. Raymond James is not affiliated with and does not endorse, authorize or sponsor any of the listed websites or their respective sponsors. Raymond James is not responsible for the content of any website or the collection or use of information regarding any website's users and/or members.
© 2026 Raymond James Financial, Inc. All rights reserved.
© Raymond James
Read more commentaries by Raymond James