How I Learned To Love the Bubble (Even Before it Bursts)
Membership required
Membership is now required to use this feature. To learn more:
View Membership BenefitsIn seventh grade science class, we studied how things are classified – the systems used to organize various kinds of rocks, elements, species, different types of clouds. I’ve always liked the name “cumulonimbus” – the sort of big billowy heap of a cloud that has a dark grey underside – full of water, not yet transformed into rainfall. If you see those clouds and suddenly feel a cool breeze, that’s often the storm’s “gust front” racing ahead of the rain – and a good time to head for cover.
You wouldn’t look at the rainfall and think it has come from nowhere. Looking at the cloud, you know the rainfall was already there – just waiting for enough conditions to show itself. As warm, humid air rides up over the wedge of cooler air, the cloud builds – water vapor beading into droplets, gathering weight until they finally let go as rain.
We call rainfall a “conditioned” phenomenon because it depends on many other factors. When causes and conditions are sufficient, the rainfall manifests. When causes and conditions are no longer sufficient, the rainfall ceases to manifest.
We should be careful, when talking about rainfall, to consider the causes and conditions that produce rain. We might say the average amount of rainfall is this, or the average frequency is that, but if we don’t change our estimate even when there’s a cumulonimbus cloud over our head and a cool breeze in our hair, we may get soaked.
Likewise, suppose we look at historical stock market returns over any particular horizon, whether daily, weekly, or annual – regardless of valuations, market behavior, investor sentiment, monetary policy and other factors. We can collect all of those returns in a heap called an “unconditional” probability distribution. Historically, average annual market returns on the order of 10%, more or less, have been most common, so the heap is highest at that point, with progressively smaller “tails” for returns that are wildly positive or wildly negative. The overall profile looks roughly like a “bell curve.”
We might say the average market return is this, or the average frequency of a crash is that, but if we don’t change our estimate even when valuations are at the highest levels in history and market internals are ragged and divergent, we may get soaked.
It would be incorrect to say that the market plunges of 2000-2002 and 2007-2009 came from nowhere. Looking at a bubble, you know the crash is already there – just waiting for enough conditions to show itself.
Whatever market conditions may be, it can help to look at the probability distribution of returns, “conditional” on some important factor, or a combination of them. We can then ask questions like “What’s the profile of likely market returns and risk, given this or that set of conditions?” That’s what we call the “conditional” probability distribution. In nearly every case, the distribution includes both positive and negative outcomes. The average outcome may be higher or lower than the “unconditional” average, but even then, we typically can’t rule out outcomes on the opposite side. The best we can do is talk about the likely distribution of returns, rather than specific “point forecasts.” To interpret a distribution as a forecast is far too demanding about what’s possible.
That’s part of the reason we talk about the “return/risk profile” of the market, rather than relying on forecasts or scenarios. Nearly every market condition we identify is characterized by a distribution that includes both positive and negative returns, often quite large ones in both directions. To imagine that a probability distribution is a “forecast” is to be caught in a concept of reality. A classification or label – overvalued, undervalued, constructive, defensive – is only a tool that describes a distribution. It’s not something to take literally as a forecast.
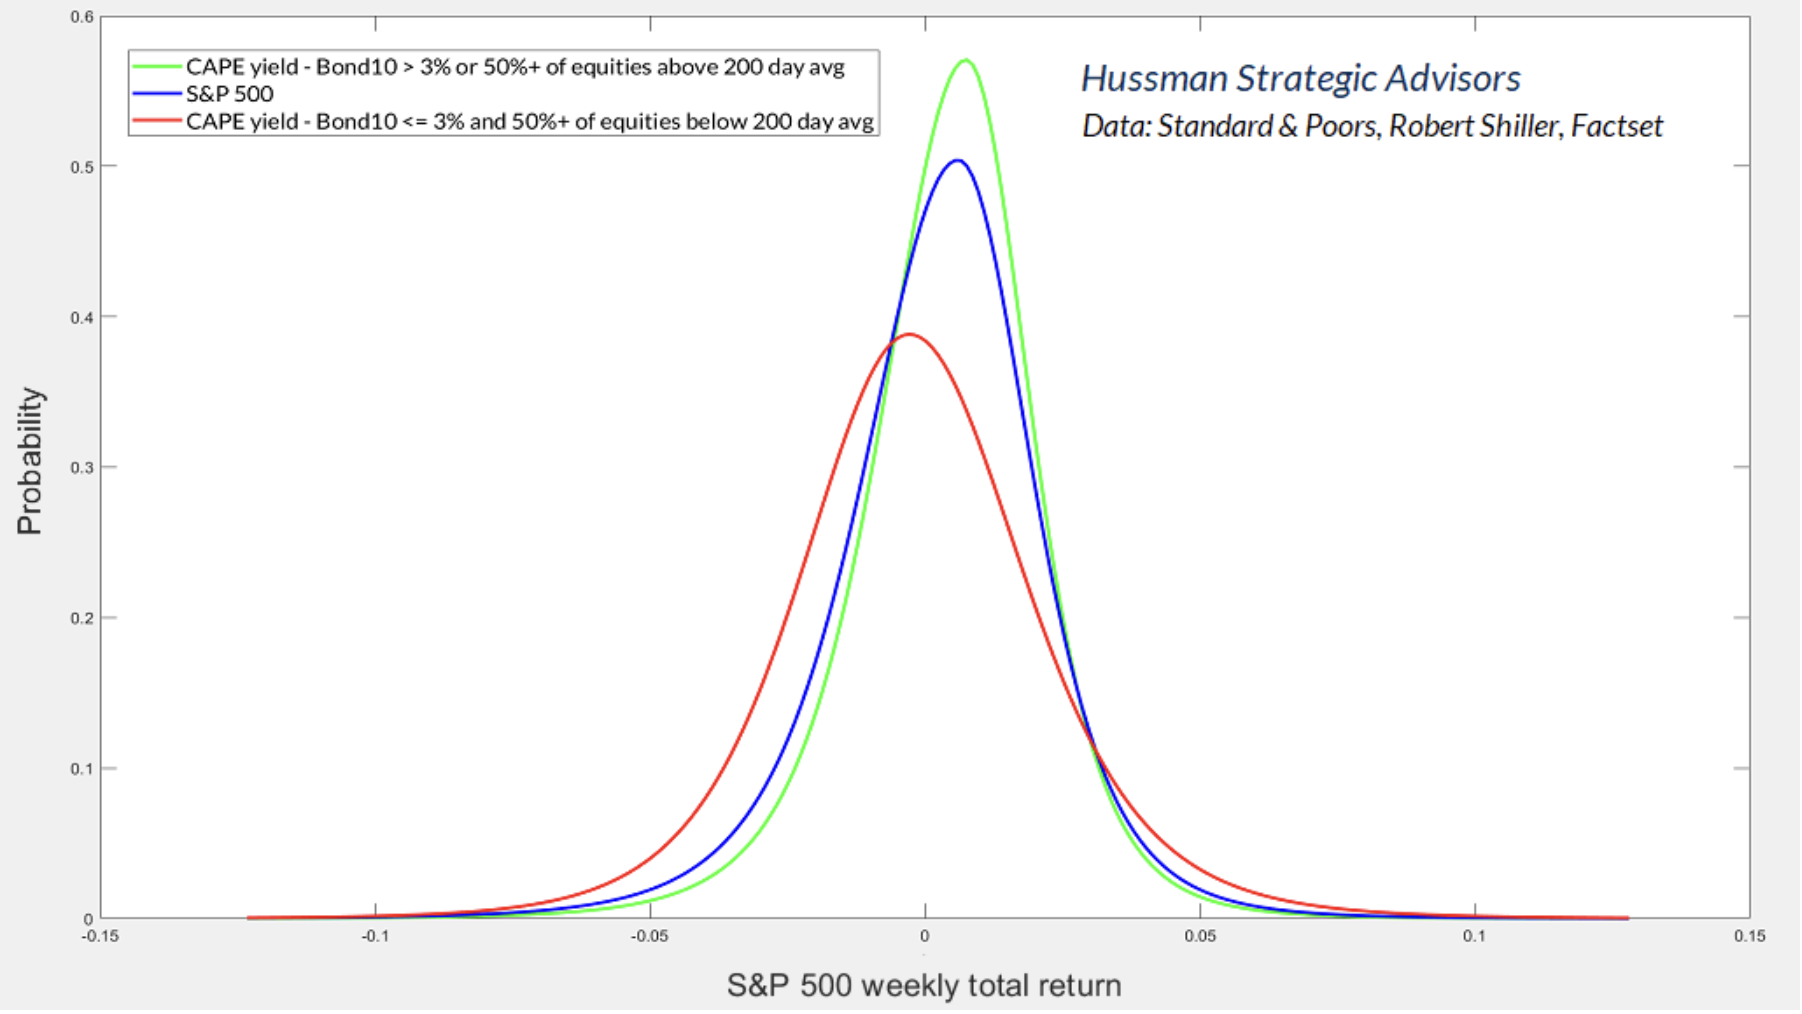
The bell curves below show fitted probability distributions of actual weekly S&P 500 total returns since 1940. They’re not quite “lognormal” curves. The full distribution of S&P 500 returns has a slightly narrower peak, a bit of skew, and fatter tails than a classical bell curve. That, by the way, is why implied option volatilities have a “smile” if you plot them by strike price. I’ve also included two “conditional” probability distributions – not because they’re great models, but simply to partition market conditions by a crude version of “valuation and market action” using commonly available indicators.
The blue curve is the “unconditional” probability distribution of weekly S&P 500 total returns. In contrast, the green and red curves are “conditional” – based on the “yield” implied by Shiller cyclically-adjusted P/E (CAPE) relative to 10-year bond yields, and the percentage of U.S. stocks “participating” in a market advance, as measured by their position relative to their own 200-day average.
Notice that the conditional distributions include both positive and negative returns. For the red distribution, the average S&P 500 weekly total return is slightly positive, but lags T-bill returns by about 2% annually. In contrast, the average weekly return in the green distribution exceeds T-bill returns by close to 12% annually. The red distribution is the widest (has the highest “standard deviation”), while the green distribution is the narrowest. That means that unfavorable market conditions generally involve much greater volatility than favorable market conditions. Observe in particular how fat the tail of the red distribution is on the right side. When people say how much investors would lose by “missing the 10 best” days or weeks of market returns, keep in mind that these “rewarding” instances generally occur during periods when the market is crashing.
The chart below shows the conditional distributions that we estimate based on our actual classification of market return/risk profiles – reflecting our adaptations in recent years – particularly in 2021 and 2024. I’ve condensed them into just two groups – bearish/hard-negative (which includes neutral positions) and leverage/constructive. There are more subtle variations in practice, but two “conditional distributions” are enough to illustrate the key idea. Geek’s note: each curve is defined by its own data subset so the area under each is 1.
While the overall profile of these distributions is similar to the previous ones that use crude gauges to classify market conditions, the average returns are profoundly different. In the red distribution, average S&P 500 total returns are negative, and lag T-bills by about -22% annualized. In the green distribution, average total returns exceed T-bills by about 28% annualized. There’s no assurance that future returns will be similar, but we see the same overall profile in subsets of the data across history, from the recent bubble all the way back to the Great Depression.
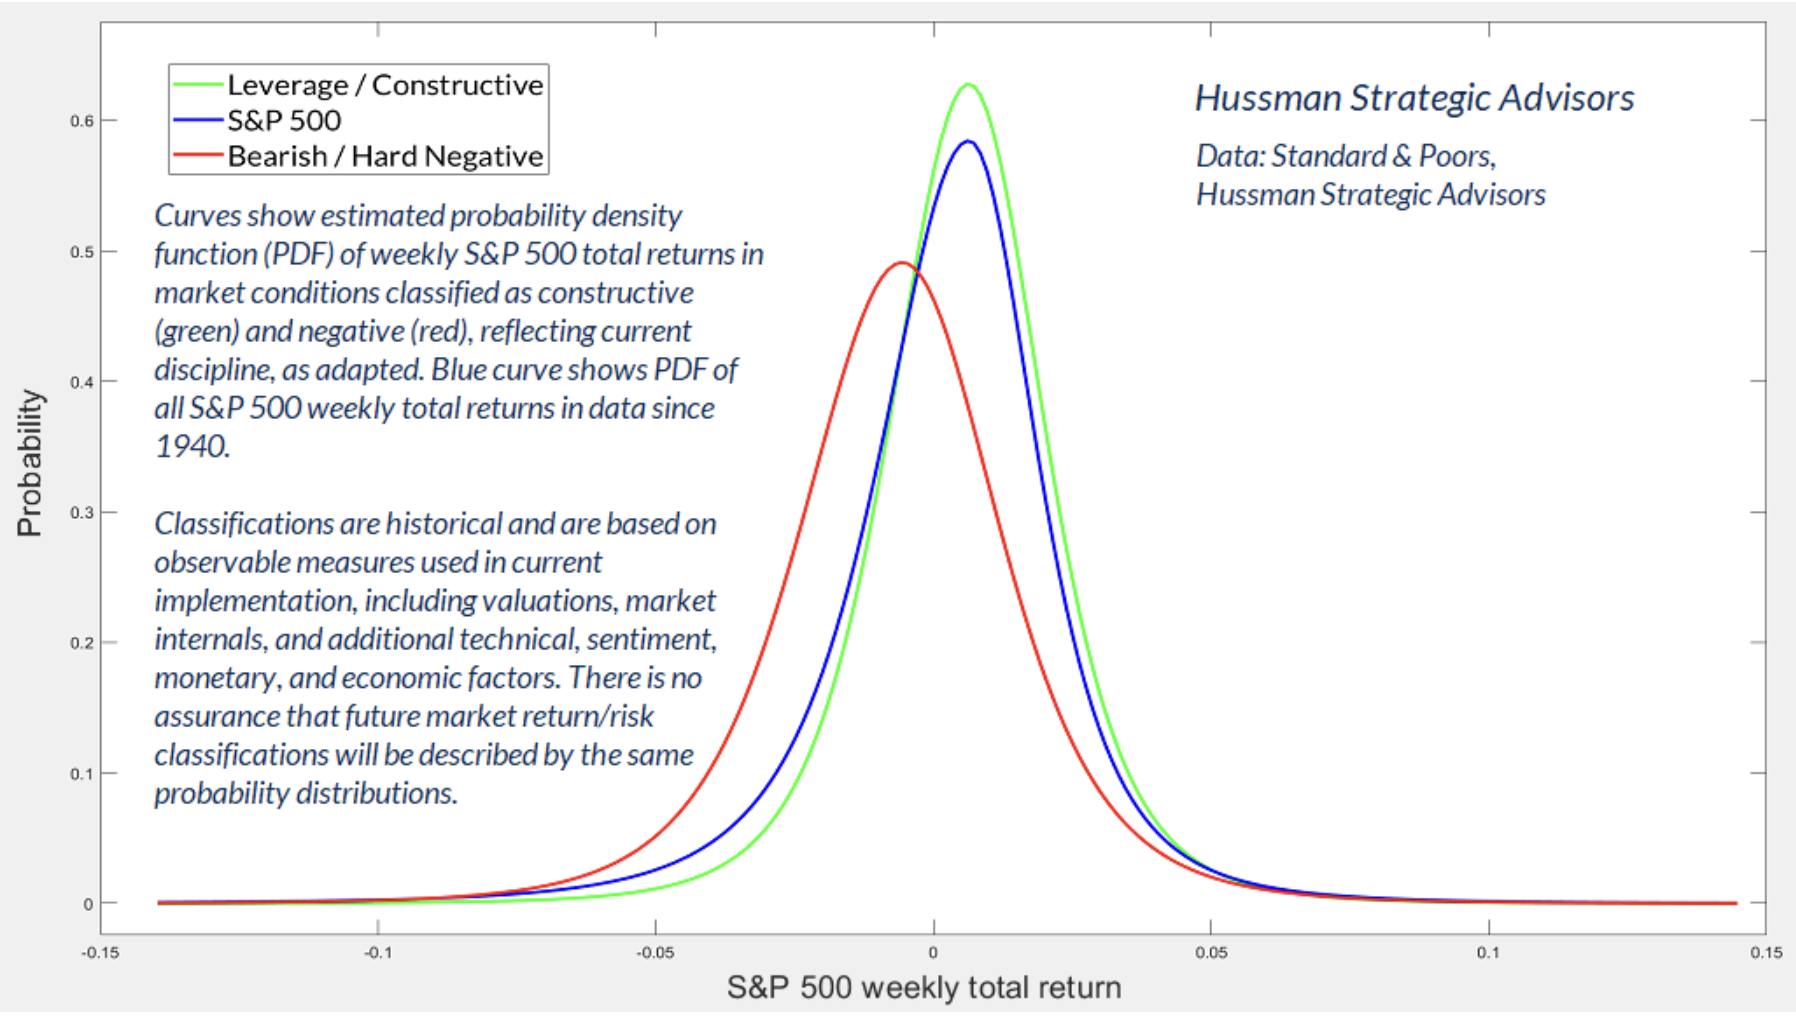
Every market return/risk profile we define maps into a probability distribution that includes both positive and negative outcomes. The average returns may be extremely different, but any individual outcome is largely unpredictable. It’s only by aligning our outlook with prevailing market conditions – again, and again, and again – that we have an expectation that our returns will capture some of those differences as investment returns.
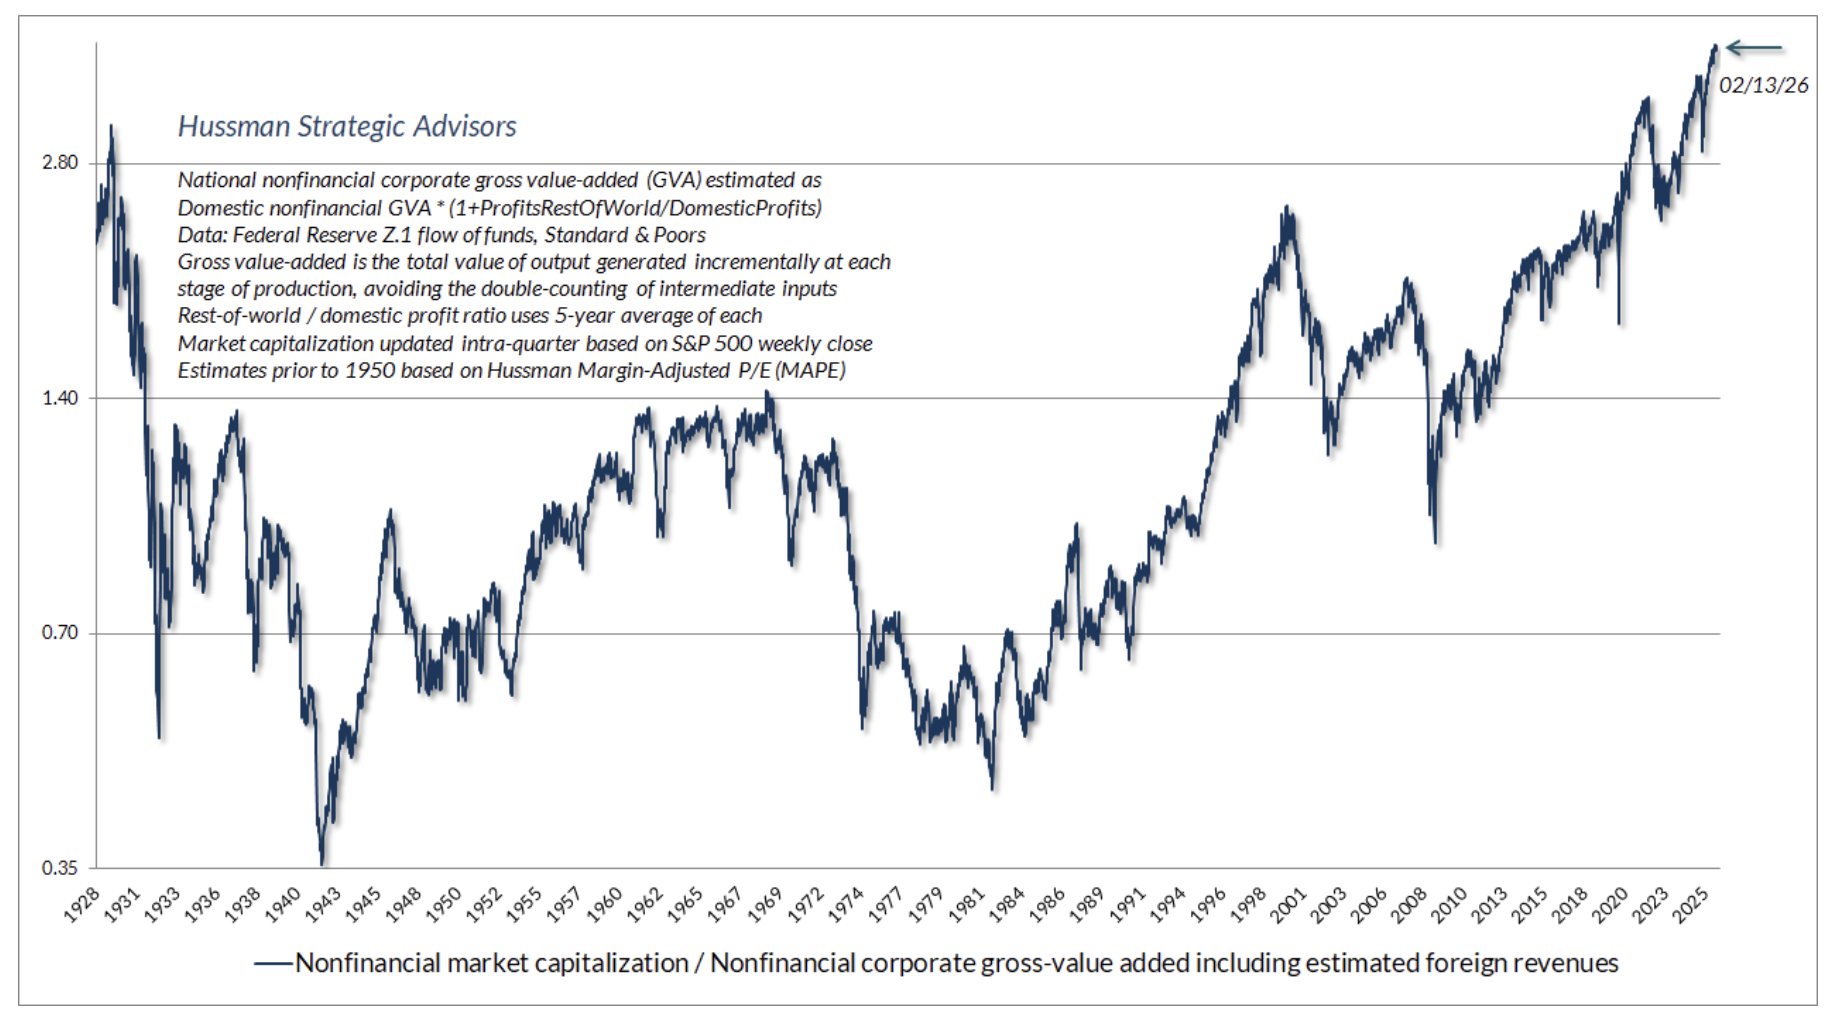
Presently, the U.S. equity market stands at the most extreme valuations in history, on the measures we find best correlated with actual subsequent market returns across a century of market cycles. The chart below shows our most reliable gauge of market valuations in data since 1928: the ratio of nonfinancial market capitalization to gross value-added (MarketCap/GVA). Gross value-added is the sum of corporate revenues generated incrementally at each stage of production, so MarketCap/GVA might be reasonably be viewed as an economy-wide, apples-to-apples price/revenue multiple for U.S. nonfinancial corporations.
As I’ve detailed in multiple market comments (see in particular How the Bubble Manipulates Time), U.S. corporate profit margins have been unusually elevated in recent years – which over the shorter term makes price/earnings multiples appear less extreme than their more reliable cousins based on revenues and gross value-added.
These record corporate profits are the precise mirror image of record deficits in other sectors – primarily households (especially the 90% that collectively own less than 13% of U.S. equities), and government, where two thirds of spending comprises transfer payments that help households bridge the gap between their spending, retirement, and health care needs and their wages and salaries – that currently comprise a record low share of GDP. That mirror image relationship, as we’ve seen, is an accounting identity.
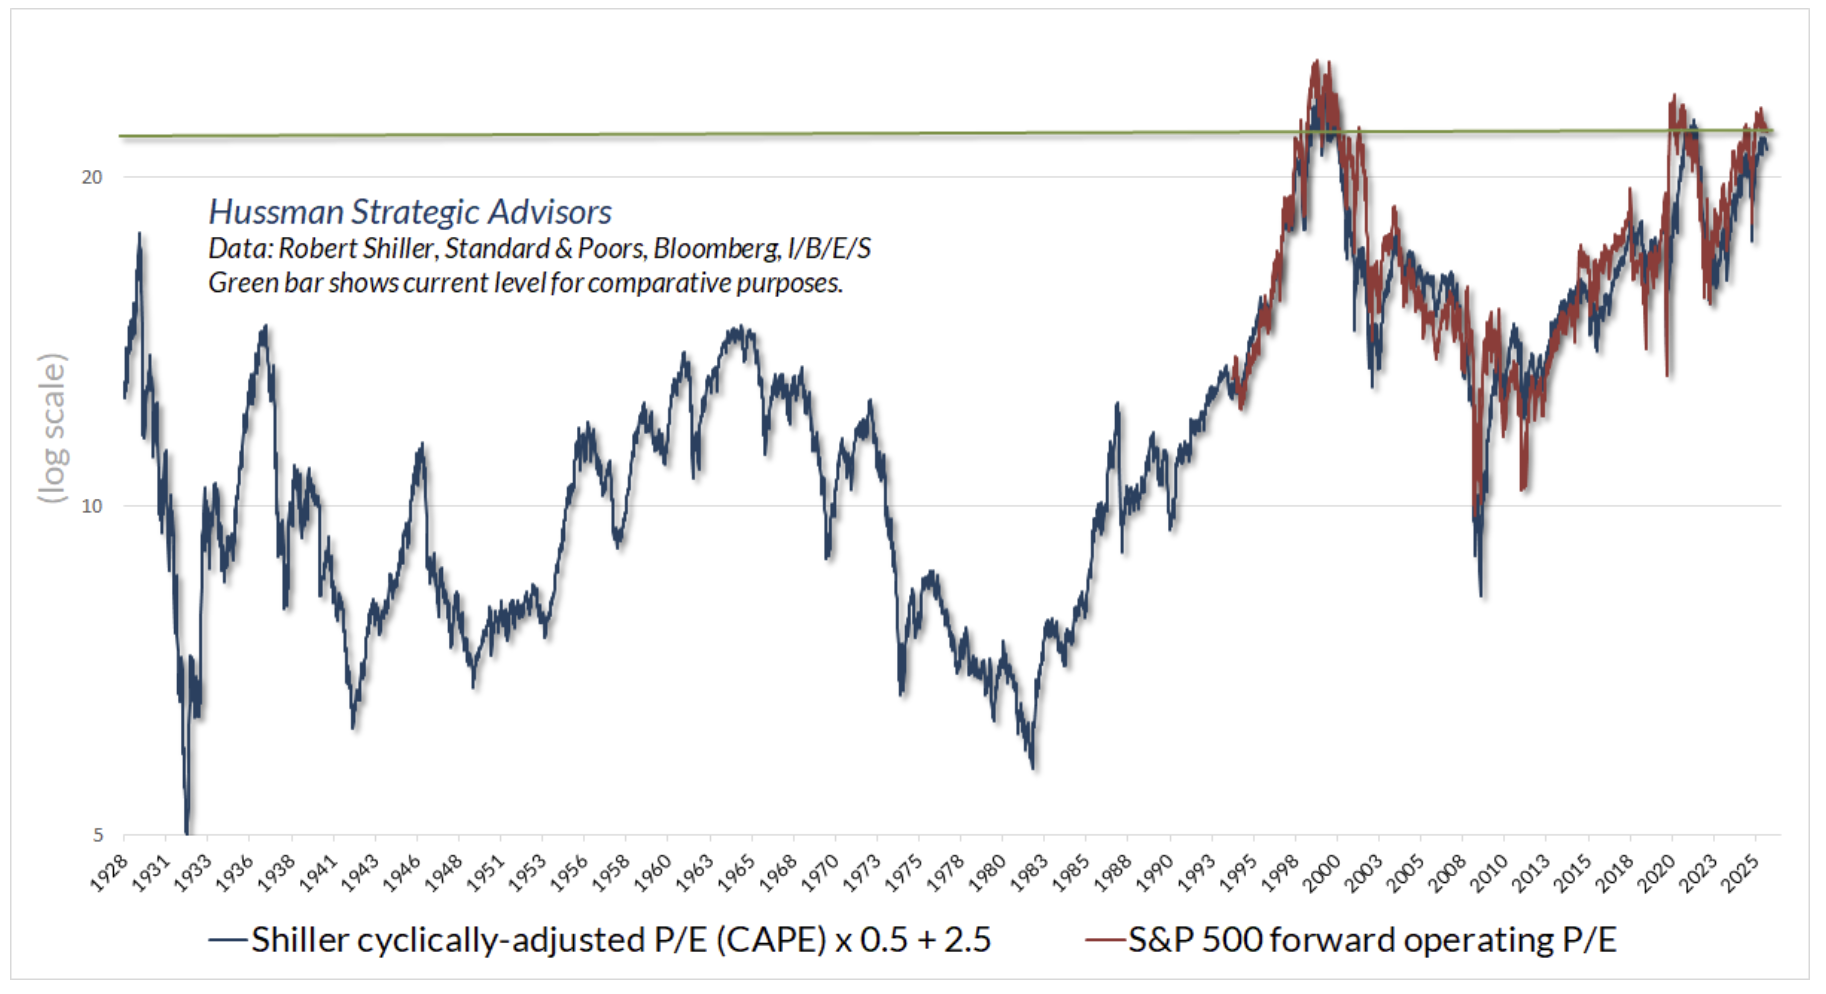
Still, even if we take these record profit margins as permanent and impervious to erosion, and we take the wildly optimistic “forward earnings estimates” of Wall Street analysts at face value, the S&P 500 price to forward-operating-earnings ratio still rivals the most extreme levels in history. Though forward operating earnings only came into common use in the 1990’s, the forward P/E is sufficiently correlated with the Shiller CAPE (appropriately scaled) that we can reasonably impute its longer-term profile.
As always, our investment discipline is to align our investment outlook with the prevailing condition of valuations, market internals and other factors as they change over time. Emphatically, however, nothing in our discipline relies on valuations to approach historical norms again. In fact, as we’ll discuss, we’ve adapted to the point where we can embrace a never-ending speculative bubble just as easily as an immediate market collapse below historical valuation norms.
Our present outlook continues to fluctuate mostly on the defensive side, and there’s no chance that we would operate without a defense against a potential market collapse – which at current valuation extremes would require a market retreat of more than 70% simply to reach historical norms. Still, taking a safety net as essential amid current valuations, we’ve been able to enhance our September 2024 hedging implementation in a way that markedly increases our expectation for “upside capture” regardless of where we stand in the market cycle. I’ll detail that enhancement later in this comment.
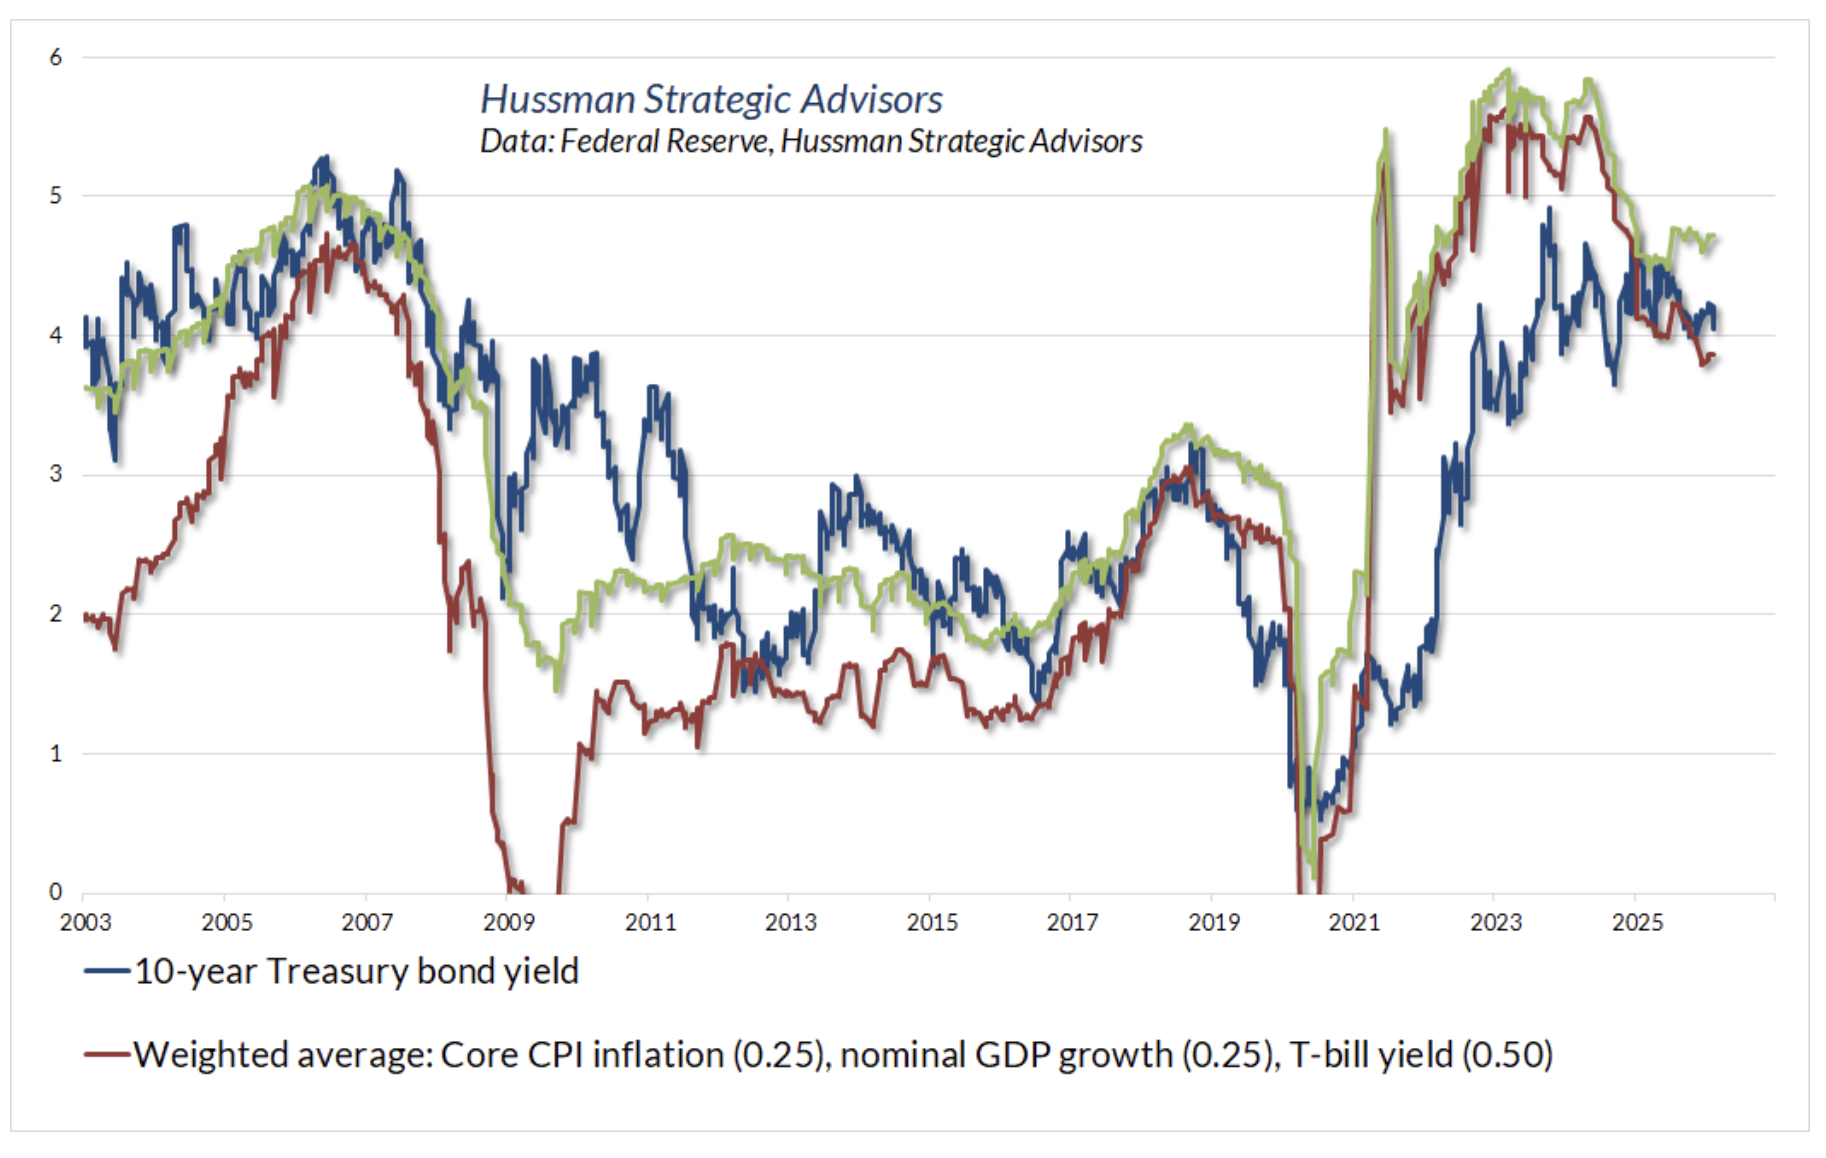
In the bond market, we presently view 10-year Treasury yields as only marginally adequate – providing no material edge relative to T-bills on a risk-adjusted basis. The chart below shows the 10-year yield relative to simple, observable benchmarks that we often use to classify adequacy. Our actual methods are more extensive, of course, but it’s useful to recognize that the entire historical total return of Treasury bonds, over-and-above T-bill returns, has accrued when yields were above both benchmarks. Overall, our present view of bonds is marginally constructive.
Similarly, in the precious metals market, the entire total return of the Philadelphia Gold & Silver Index (XAU) has accrued in periods when bond yields have been falling, even on gauges as simple as a comparison of 10-year Treasury yields versus their levels 6 months earlier. Given the significant runup over the past year, coupled with a firming of the NAPM purchasing managers index and the absence of clear upward pressure on jobless claims, our view is not as constructive than it was during most of 2025, but we maintain a modestly constructive outlook here as well.
Our outlook will continue to change as measurable, observable market conditions change. In our view, the best way to take good care of the future is to take good care of the present moment – again, and again, and again. No forecasts or scenarios are required.
Mathematics as a tool, versus mathematics as a dogma
I ran across an article in recent weeks proposing that nearly all mathematics in the field of investment is “sham” and “almost 100% phony.” I typically don’t cite writers if I’m not complimenting or drawing on their work, but my impression is that the phrase “almost 100%” may be the best example of sham mathematics in that particular article.
Now, yes, if one’s use of mathematics in finance assumes that stock prices follow Brownian motion (a pure “random walk”), that price distributions are best characterized as perfect (lognormal) “bell curves” without skew (lopsided shape) or kurtosis (fat tails), or that the correlations across assets will be reliably well-behaved even in a crisis – leading you to lever your portfolio up 40-to-1 (which is what blew up Long-Term Capital Management), or to slice up mortgage risk into securities that you imagine will be well behaved when it all hits the fan (which is what blew up Lehman and many banks during the GFC), then yes, your application of mathematics may be a reckless sham.
But it’s not math that’s the problem. Math just allows one to approach problems in ways that require structured, deliberate, systematic thinking – to understand how variables interact, and how this changes when that changes. Mathematics is merely well-structured thought. It’s the assumptions one uses when doing the math that may or may not be garbage.
For example, if you take seriously the idea that securities are claims to a stream of future cash flows that will be delivered to investors over time, you can productively use math to figure out how to price a bond, how to calculate the yield-to-maturity given the price, and how changes in growth rates and risk-premiums affect stock prices. You can examine prevailing valuations and ask what assumptions about future cash flows are needed for an investment at those valuations to actually produce an adequate long-term return. All of that is just arithmetic.
You can go further, for example, and accurately price more complicated securities like options, allowing you to study the implications of various investment strategies. All of that is a useful application of mathematics – provided you don’t take probability distributions (“bell curves”) literally, and you instead realize that the main thing any good option model does is to allow you to add up various option payoffs times their respective probabilities. You don’t have to use a lognormal distribution at all. As long as the probabilities add up to 1 and the expected value of the distribution rules out arbitrage, you can use whatever distribution you like – you just have to use a more creative integration method.
The fact that actual financial markets don’t obey simplifying assumptions like perfect bell curves doesn’t make “almost 100%” of financial mathematics a sham, unless your understanding of mathematics is that objects like probability distributions, correlations, covariance matrices, stock betas, expected returns, or other parameters are literal, fixed, and “unconditional” regardless of valuations, and regardless of whether investors are optimistic or risk-averse. The “sham” emerges if we stumble into dogma – if we assume that prices are produced by a random number generator rather than the expectations, hopes, and fears in the heads of investors. The use of mathematics doesn’t force anyone to make such dogmatic assumptions – the math is just a tool for systematic thinking.
The making of a permabear
Last month, Jeremy Grantham generously sent me a copy of his new book, The Making of a Permabear – The Perils of Long-term Investing in a Short-term World. The title alone – disarm your critics by owning their diss – felt very B-Rabbit in the last rap battle at the end of Eminem’s 8 Mile.
Jeremy’s book, which I greatly enjoyed and recommend, is partly an autobiography; partly a history-rich journey that combines investment wisdom with lessons in entrepreneurship; partly a deeply principled examination of our relationship with the environment that humanity relies on for its existence; and from cover to cover, an example of what it looks like to live an interesting, constantly curious life that has purpose beyond oneself.
For veterans of market cycles from the Nifty Fifty, the late-1970’s “death of equities”, the deep undervaluation of the early 1980’s (when my own career began), the 1987 crash, the dot-com bubble, the tech collapse, the global financial crisis, and on into the current bubble, Jeremy’s book provides a fascinating look at what was going on in his head while whatever-it-was happened to be going on in your own head. That is a joy. He shares countless stories involving ideas and entrepreneurship, across a sequence of investment companies and new investment products, including the earliest index funds. As Zig Ziglar often said, “You can have everything you want in life, if you’ll just help enough other people get what they want.”
Business, well pursued, should be inseparable from character. Jeremy has always struck me as fundamentally kind and interested in benefiting others. That quietly runs through the whole book. Jeremy’s remembrance about Jack Bogle reflects his own character – “He was more concerned about the long-term benefits for society. There were so few in that group, and he was a patron saint.”
One definitely gets the sense that Grantham likes to win in the end, but that he’s not at all impatient about it. Having been among the few investment managers who shared nearly identical experiences anticipating the collapses of both the tech bubble and the mortgage bubble, and prospering across full cycles in both, I’m a bit too familiar with his description of the vindication that follows an extended period of discomfort:
“Our business exploded … yet of the clients who fired us, not one came back. We had done the right thing for the right reasons and won. They had done the wrong thing for the wrong reasons and lost. Nobody came back. A few years later, I was asked … what the secret was to our rapid growth of assets. I replied, ‘We were simply willing to lose more business than the other guys.’”
The book is strewn with wonderfully useful observations and investment wisdom. My only concern is that because they don’t dance onstage crooning “Hello my baby!” with top hats and canes, or come with explicit arithmetic, many readers may not realize how much valuable investment content is there.
Many of the side-comments are worth vastly more than the cost of the book. For example, he discusses many details of GMO’s early equity rating system, and scatters thoughtful analytical observations throughout the text. In discussing the strong historical real return of stocks, Grantham reminds readers that the average historical return is a function of average historical valuations: an average trailing P/E of 14 (and that’s on reported earnings, not forward operating earnings). That’s worth considering today, because even if you take recent record profit margins as permanent, the trailing P/E of the S&P 500 currently stands at 30.
Among countless chestnuts – “Our research, however, showed that there is no stable relationship between economic growth and stock returns.” That’s because valuation multiples already take expected growth and likely payout rates into consideration. Paying up for rapid, anticipated growth doesn’t buy you a free lunch. “If the assets you bought got pushed up in price simply because they were in favor with investors, then you are not going to be rewarded for taking a risk; you are going to be punished for it.”
Yet another – “The stock market, by and large, doesn’t give a rat’s tail about the future. What it cares about is the present… Things will get worse when they’re perfect and get better when they’re ugly.” That perspective was clearly evident in Grantham’s constructive shift in his March 2009 piece Reinvesting when Terrified, at the bottom of the global financial crisis.
On the current situation in the financial markets, he writes, “The long-run prospects for the broad market look as poor as almost any other time in history. Simple arithmetic suggests you’ll either have a dismal return forever or a hefty bear market followed by a normal return.”
That’s the genius of Jeremy’s putting “permabear” in the title of his book. He’s not writing it just for readers this year, or next year. He’s writing it for investors far into the future, who will look back on this bubble and ask, “What could they have possibly been thinking?” Those future investors will be reminded that long-term investing is difficult. Beyond inviting derision and career risk, it requires the willingness to be wrong today and right tomorrow, in a world where everyone else is eager to do the opposite.
From his work to protect the future of our environment, it’s clear that he carries that same long-term wisdom well beyond the financial markets.


One of the great influences in my life has been my teacher, Thich Nhat Hanh (“Thay”), a revered Vietnamese Buddhist monk. We were friends for decades. He’s still here, in his monastics, his students, and countless other forms.
Many of the talks Thay shared over the years have relevance in every aspect of life – even the financial markets. Teaching brought Thay a lot of joy, and he was always happy seeing that the insights he shared could be found in everything. We never look to make them into tools, but those insights can’t help but benefit our work.
In the next section, I’ll share a strikingly useful enhancement to the hedging implementation we introduced in September 2024 – that emerged directly from meditating on the “nonduality” between roses and garbage. With your indulgence, I’d like to share a little bit of Thay’s wisdom first. It will help the explanation, and even if you’re only here for the finance, it may bring some new perspective.
In the financial markets, we constantly make distinctions, separating the world into different compartments – bullish vs. bearish, overvaluation vs. undervaluation, advancing vs. declining, improving vs. deteriorating, and so forth. We do the same in our daily lives – pleasant versus unpleasant, kind versus unkind, us versus them.
Some distinctions have their place in choosing the direction we want to go, which actions to take, and which actions not to take. But the labels we apply to reality can also become a hindrance. The moment we label something, we often feel like we know all we need to know, and we cut off our ability to understand more. So we have to be careful with our labels. Our tendency to separate this from that can become a source of tremendous damage if our discrimination makes us intolerant or impatient, wishing we could just eliminate what we dislike.
Thay often said that if you look at a flower, you can easily see the rain in it, the sunshine in it, the earth in it. If you continue to look, you can see that the flower has been on a journey of transformation. You might see the seed, the little girl who planted it, her mother, her father, her friends, the community she grew up in. If you look deeply enough, you can see the whole world, even the universe, in the flower. There’s nothing that’s not there somehow. A flower is made only of non-flower elements. It’s empty of only one thing – a separate existence.
When we approach the world by labeling everything, discriminating “this” from “that,” it’s tempting to want to eliminate the garbage, and surround ourselves with roses. But there will always be difficulties – in our day-to-day lives, our in relationships, in the financial markets, in the world. When we’re faced with the garbage, our happiness isn’t a matter of rejecting the garbage, looking for roses elsewhere, or hoping and waiting for roses in the future. It becomes a matter of accepting and transforming the garbage – so that we can find and cultivate the roses that are already there, on their journey of becoming.
For a parent or teacher of someone with autism, for example, one of the most helpful things we learn is that challenging behaviors aren’t “garbage.” To someone who can’t speak, those behaviors may be the only “words” they have to get their underlying needs met. The attempt to “eliminate” challenging behaviors will nearly always be unsuccessful – you can only transform them by looking to understand the underlying need, and teaching and reinforcing an alternative behavior or mode of communication to get that need met in a better way. Changing the behavior is inseparable from addressing the need.
There are clearly times we need to remove something – to stop an illness, or defend against harm of some form. But imagining that what we remove is truly “separate” takes away our opportunity to understand it, to discover how we might have contributed to the situation, and to improve the future. Removing what we dislike with hatred and violence is worse – because it creates a never-ending cycle.
The same applies to difficulties we’ve encountered in our own life story. Each of us is made of non-us elements. When we remember that, we can feel a bit more compassion not just toward other people, but also toward ourselves. Thay often said “A lotus flower doesn’t grow on a slab of marble. It grows in the mud. No mud, no lotus. There is no need to push anything out of existence. If we could push one thing out, we would have to push everything out, because the one contains the all.”
The labels we apply to other people are particularly dangerous, because they encourage us to depersonalize and even dehumanize them. Our internal alarms should sound off when we hear labels like animal, dog, extremist, insurgent, illegal, radical, thug, trash, and garbage being applied to human beings. Labels encourage us to leap to judgement and can terribly desensitize us to the idea of “wiping out” or “mopping up” human life that sounds untidy to us.
Simply put, nothing in the universe exists by itself, alone. Everything we’re tempted to eliminate is made of the same common substance as the things we love and hope for in the world. The task isn’t to eliminate things as if they’re outside of ourselves, but to transform them as if they’re part of us – to cultivate the positive, constructive seeds and refrain from watering the negative, destructive ones – in ourselves, in our relationships, in our nation, in total strangers who share our common humanity, and in whatever situation we find ourselves in.
How I learned to love the bubble (even before it bursts)
I recently came to the realization that I’ve been discriminating against the bubble.
Yes, we know that speculative bubbles can be filled with delusion, and their eventual collapse can cause a great deal of suffering, so when we see conditions that have inevitably led to that sort of outcome, it’s natural to hope for – and look forward to – better investment conditions elsewhere, in the future. But I decided we might be able to do better by finding and cultivating roses here and now, even amid what we are convinced is garbage.
Taking that perspective, I quickly discovered that the best and most fertile place to look for flowers was in exactly those conditions when our September 2024 hedging implementation already encourages us to reduce the “intensity” of bearish hedge positions (for a broad discussion, see the section titled “The Martian” in The Turtle and the Pendulum).
I still find it difficult to contain my enthusiasm about that implementation, which significantly increased our ability to vary our market exposure even during extreme market conditions. As a result, we’ve been able to benefit from an advancing market since late-2024, despite a continued “bearish” outlook – driven by extreme valuations and persistently divergent market internals – in a speculative bubble at record highs. The low-volatility market advance in recent months to record valuation extremes – a 5% pullback in the S&P 500 being the deepest loss since April – hasn’t provided much opportunity to vary our investment exposure. But that’s a temporary obstacle.
That September 2024 hedging implementation allows us to better navigate and welcome any trajectory that valuations may take, provided only that the market fluctuates. As I discovered last month, it’s also the gift that keeps on giving.
We know that conditions that join extreme valuations with unfavorable internals – particularly with lopsided bullish sentiment – have generally been followed by very poor market returns, on average. I’ve often referred to these as “trap door” conditions. But looking at our 2024 hedging implementation, I asked – what if we extend that implementation a bit further to see if we can cultivate roses even there? Not only opportunities to vary the intensity of our downside hedges, but opportunities to adopt a constructive stance, albeit with a safety net, even in conditions that we’ve labeled as bearish “garbage.”
Strikingly, just over two percent of market conditions across history are roses –blooming amid garbage – often surrounded by the most speculative and seemingly dangerous conditions. Not surprisingly, they bloom from patches of soil that are already “indeterminate” – periods when our September 2024 implementation already reduces the intensity of our downside hedges.
Taken together, 2% of market history may not seem like much, but the consistency of market gains in these periods provides a clear benefit in reversing the hedge from mildly bearish to “constructive with a safety net” – removing the “upside cap” on potential returns, while setting a safety net at modestly lower level. There’s still risk, of course, but that’s why the safety net is there. Because “trap door” conditions have been more frequent in recent years, these “roses” appear in close to 15% of weekly periods during most recent 1-, 3-, and 5-year horizons. Yet they easily account for more than half of the S&P 500 total return over these horizons.
As an example – in certain conditions that one would otherwise classify as quite risky, there can be selloffs amid very high levels of bullish sentiment and low bearish sentiment; where the lopsided bullish sentiment acts not as a negative “contrary” indicator, but as a signal that speculators simply can’t shake their optimism. These selloffs are followed by “fast, furious, prone-to-failure” rallies with striking regularity, even though they often occur near bubble peaks.
These “roses in the garbage” tend to reflect “stubborn optimism” rather than panic, and are much more frequent than the “compression syndromes” that periodically develop during steeply oversold declines (see The Fast and the Furious). The S&P 500 does often encounter a drawdown of 15-25% over the following months, so they’re not appropriate opportunities to take risk without a safety net, but over short horizons, these brief, explosive advances are clearly useful opportunities.
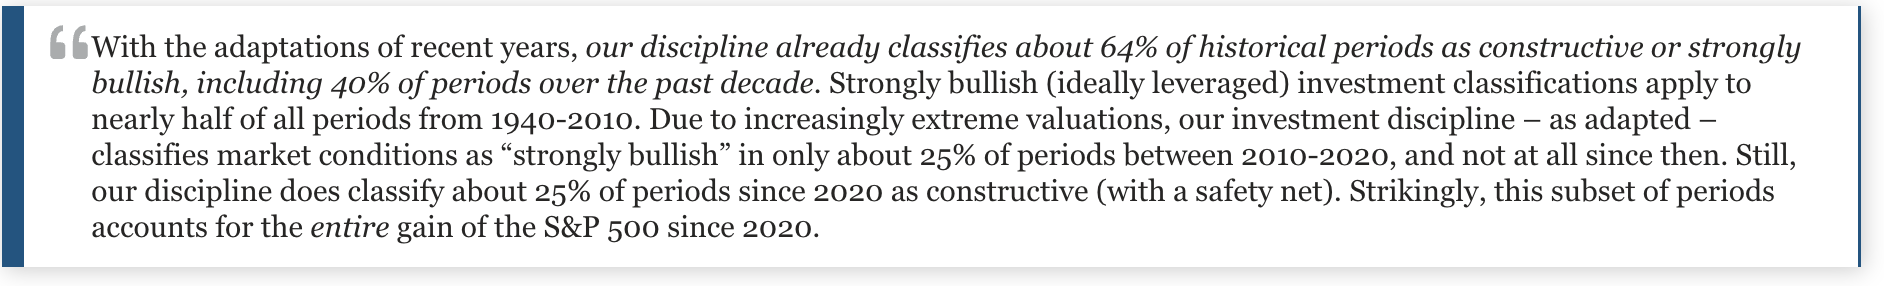
Keep in mind that our most important adaptations to the recent bubble have been in place for some time now (for a discussion of those, see Asking a Better Question). My impression is that the extreme valuations of recent years have obscured the fact that our discipline already classifies about 64% of historical periods as constructive or strongly bullish, including 40% of periods over the past decade.
As our investment discipline stands today, strongly bullish (ideally leveraged) investment classifications apply to nearly half of all periods from 1940-2010. Very long-term followers may recall that I was a leveraged bull for years in the early 1990s. Or present methods lean toward bullish classifications even more frequently, though you’ll never see us leveraged or fully unhedged in a steeply overvalued market, or one with unfavorable internals.
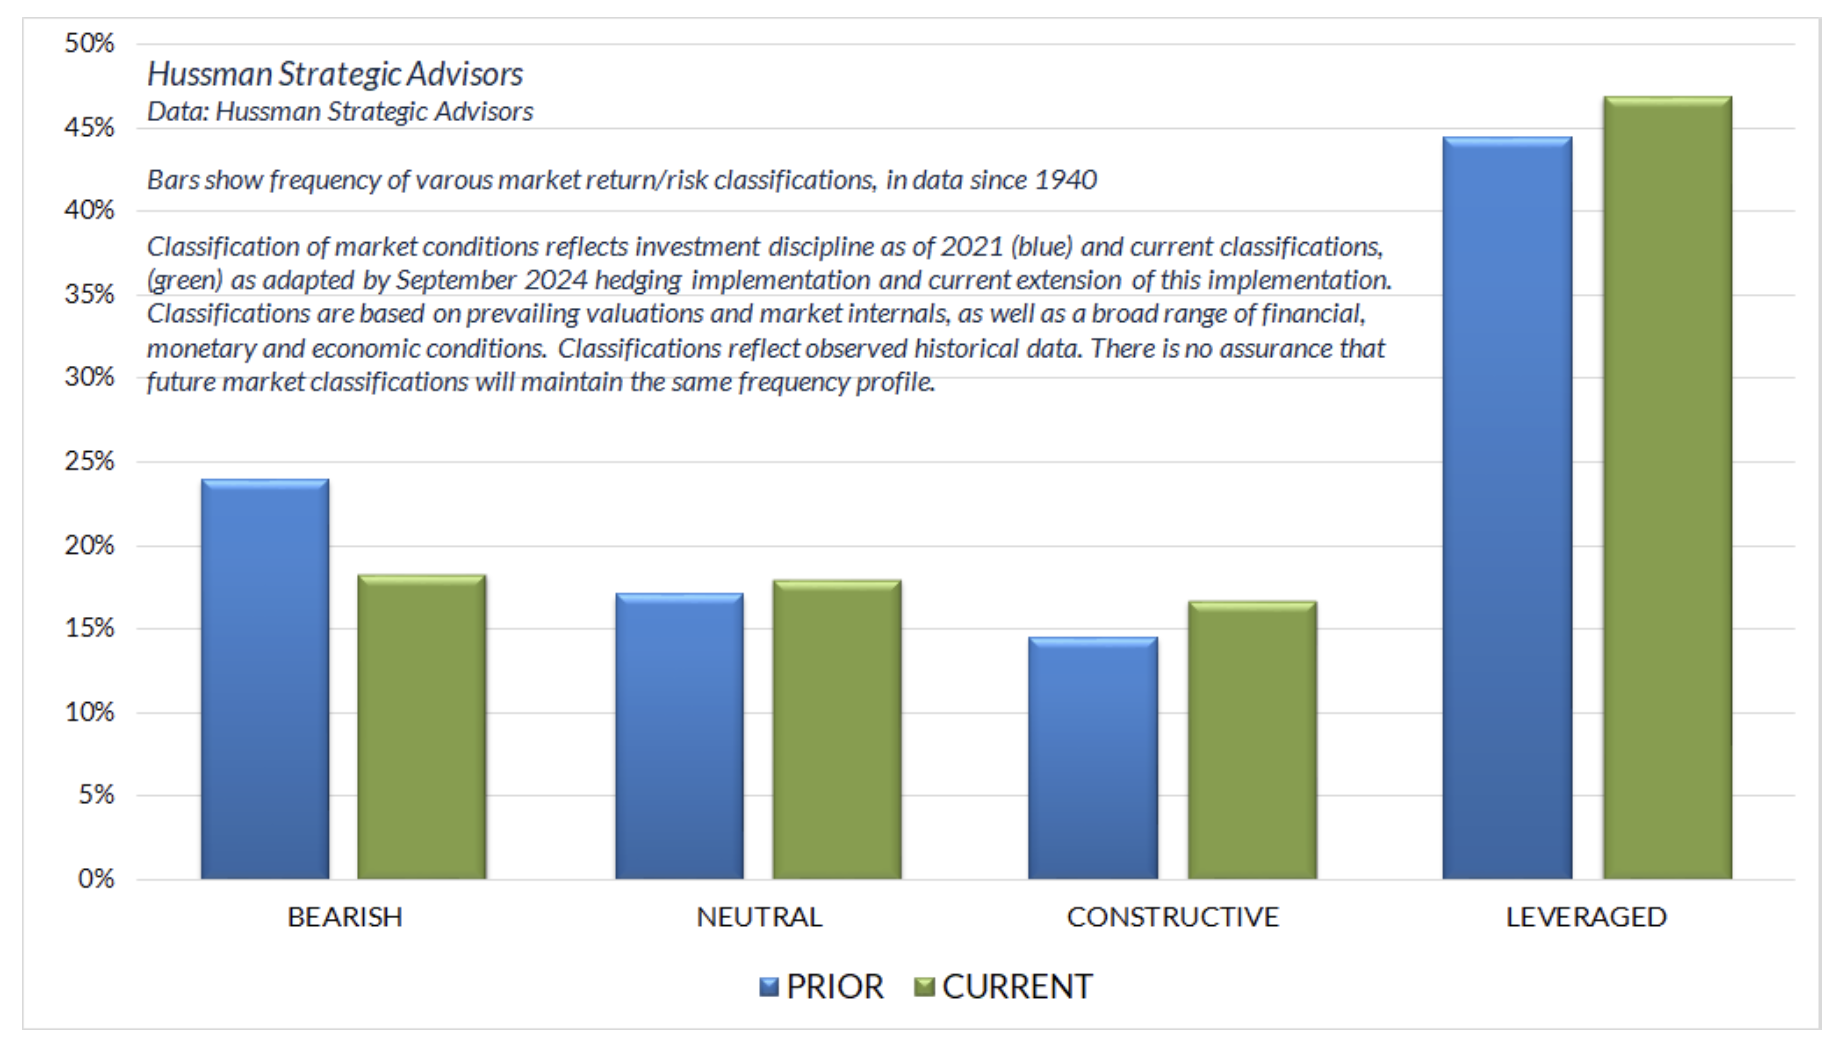
Due to increasingly extreme valuations, our investment discipline – as adapted – classifies market conditions as “strongly bullish” in only about 25% of periods between 2010-2020, and not at all since then. Still, our discipline does classify about 25% of periods since 2020 as “constructive (with a safety net)”. Strikingly, this subset of periods accounts for the entire gain of the S&P 500 since 2020. Even the variation in bearish hedges since our September 2024 adaptation has been helpful to us. Clearly, I’m looking forward to the substantially increased – though still underappreciated – flexibility of our investment discipline becoming more obvious as market conditions fluctuate over time.
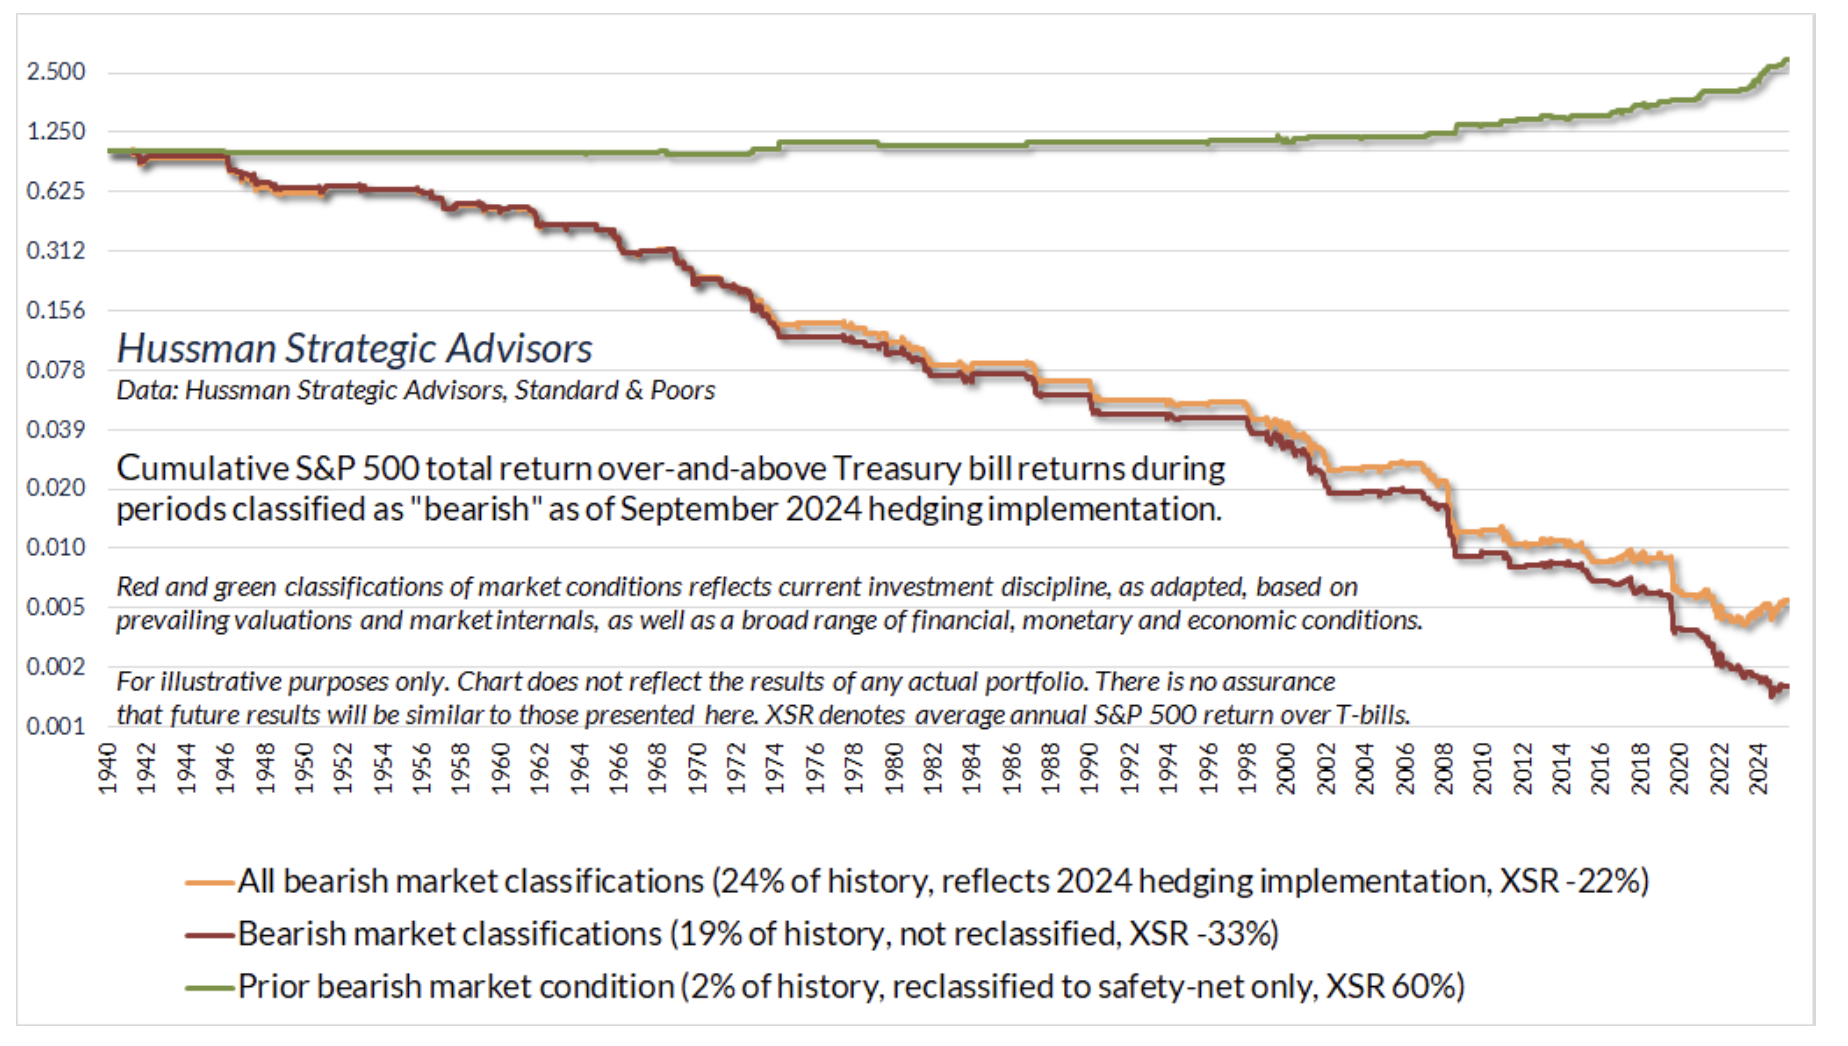
The orange line in the chart below shows market outcomes in the 24% of historical periods that our discipline classified as “bearish” as of 2024. The orange line shows the cumulative S&P 500 total return, over and above Treasury bills, across all periods we had classified as “bearish.” The hedging implementation we introduced in September of 2024 backed about 5% of this history off to a much more neutral hedge (which has been helpful), but we still classified them as “bearish.”
The red line shows the cumulative market return in the 19% of history that our discipline continues to classify as bearish (I sometimes describe these conditions as “hard negative”). The green line, representing just over 2% of total market history, shows the cumulative S&P 500 total return, over-and-above T-bills, in periods that we’ve reclassified as constructive (with a safety net) – by extending our September 2024 hedging implementation. It gives a sense of how much market impact is concentrated in “fast, furious” rallies that systematically emerge as roses in the garbage.
The remaining 3% of historical periods have a “bearish” but essentially neutral hedge, with flat overall returns (not shown on the chart). Because those periods are flat, the green line – the roses – capture the difference in performance between the former orange “bearish” classifications and the current red “bearish” classifications. While we see these instances across history – even near the 1973, 1987, and 2000 market peaks – they’ve been more frequent in recent years precisely because a longer span of time has been characterized by “bearish” conditions.
The green periods often persist for only a week or two, but they tend to have high impact. In 2025, most of the overall gain in the S&P 500 was concentrated in just 7 weeks that are among the roughly 2% of history captured in that green line. Even our September 2024 adaptation allowed us at least to back our hedges off at those times, which was already helpful. The impact of the reclassification is to extend a handful of these more neutral stances all the way to the constructive side.
Now, there’s no assurance that future outcomes will be similar. But provided whatever market risk we take in these conditions continues to have a “safety net” in case things break down, we can use index call options (or reduction of the short-call side of our hedges) to allow those “fast, furious, prone-to-failure” rallies to become part of our return.
Just over 19% of historical market conditions, and the majority of conditions during the past year, are classified in our investment discipline as “hard negative.” That 19% block of conditions is the only portion of my well-earned “permabear” label that remains accurate – and can reasonably be expected in the future. The red line gives the impression that these periods are horrifyingly garbage-like, but they’re actually just opportunities to cultivate a different type of flower. I expect we’ll be able to make good use of them regardless of whether the bubble continues or collapses.
A bubble is a crash on its way to becoming
At every moment, the market is a constantly changing object made up of thousands of stocks and the collective beliefs of millions of investors. Likewise, the conditions we identify – bullish, constructive, neutral, bearish – are only labels. The labels we apply help us to choose the best way to respond as conditions change over time. It’s safe to use terms like “bull market” and “bear market” only if we keep in mind that the map isn’t actually the territory – we can’t get so caught in our labels that we stop examining reality. Our staff often hears me say, “lean into the data, but use your best mindfulness.”
If we follow the journey of a drop of water, we can label it as cloud, raindrop, coffee, ocean, or whatever other words describe its current form, but it’s really just a drop of water moving through different aspects of being. The market is like that. To love a bubble but hate a crash is to misunderstand the market. A bubble is a crash on its way to becoming. A crash is a bull market on its way to becoming. All we can do is to accept, and as difficult as it may be – embrace – whatever form we have in each moment, so we can do our best with each of them.
“Loving the bubble” doesn’t mean taking risks that rely on the bubble to be permanent, or that assume it won’t immediately collapse. Instead, it means finding enough flexibility in our outlook, ideally with a safety net in periods we’re able to be constructive, so that we aren’t at war in our day-to-day investment discipline.
For us, this flexibility has been progressive. Having thrived for decades as “value investors” driven by historical research, the unprecedented shift to yield-seeking speculation in this bubble knocked us off our foundations. After a wicked experience during the first several years of zero interest rate policies, we stopped tumbling down the stairs in 2017, and have progressively extended our flexibility – most responsively to market internals in 2021, and most tolerant of bubble conditions in September 2024.
The remaining scope for flexibility was in conditions we typically label as “trap door” situations, combining extreme valuations with ragged market internals. Looking at these conditions without discrimination, we find we can further extend and enhance our 2024 implementation in a way that markedly increases our ability to benefit from periodic market advances even in these conditions – the very “garbage” we’ve been surrounded by – without the need to abandon a safety net.
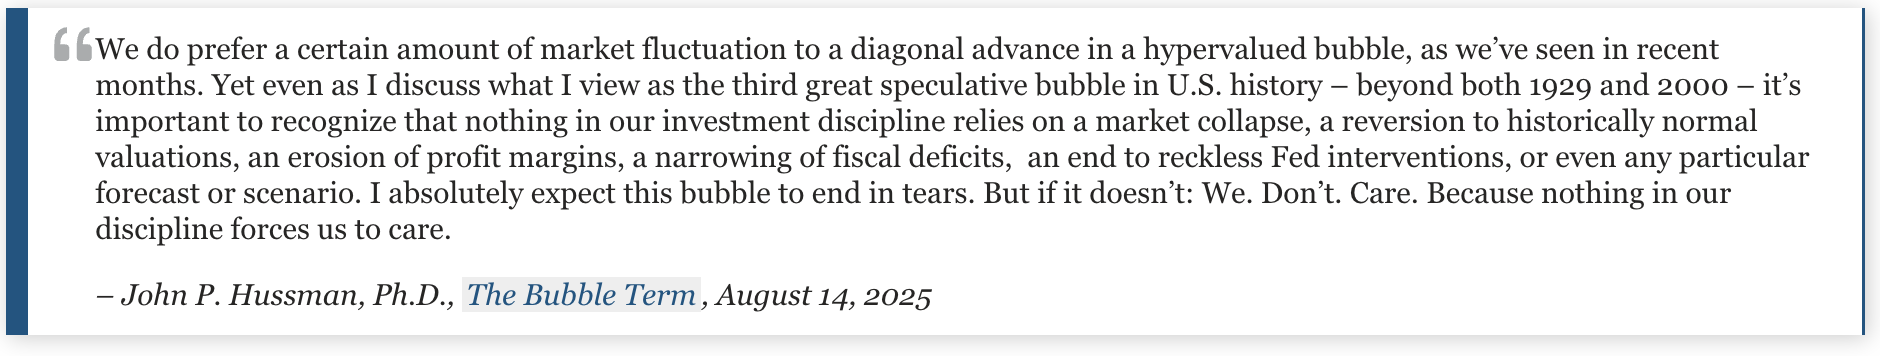
Presently, I’m comfortable that we can embrace a permanently rising bubble, an immediate crash, or a sideways market forever. There’s no question that we prefer a certain amount of market fluctuation to an uncorrected diagonal ramp. Yet as much as historical valuation norms suggest a market loss on the order of 70% on the other side of this bubble, I expect we can just as easily welcome a future in which the bubble never ends.
Again, market conditions we classify as “constructive” or “bullish” prevail across about two-thirds of market history, and well over half of those periods are amenable to the use of leverage (particularly when our key gauge of market internals is favorable). The impact of many of our adaptations has been virtually invisible in recent years, because the market has been locked into a combination of extreme valuations and divergent market internals. I expect we’ll see a more typical profile over time, but we’ve adapted to the point that we don’t need to rely on any normalization of valuations, nor any broad improvement in market internals. Even amid extreme valuations with divergent internals, there are conditions we can treat as neutral or even constructive.
In short, last month, we further extended our September 2024 hedging implementation, with the expectation of benefiting to a greater degree from market advances even if recent extremes persist, while retaining defense against a potential speculative collapse.
Don’t get me wrong. I remain convinced that we continue to trace out the extended peak of the third great speculative bubble in U.S. financial history, and expect that the eventual bursting of this bubble will indeed cause a great deal of distress for investors, as we anticipated prior to the 2000-2002 and 2007-2009 collapses. Still, we’ve made enough adaptations to expect the bearish stances we do take to be generally beneficial even in a perpetual bubble that never bursts. Purely diagonal advances at record valuations aren’t helpful, but even moderate market fluctuation should be enough.
We don’t need the bubble to be eliminated. We don’t need to grind our teeth until the future arrives to replace the present. There’s nothing we need to discard. Taken together, I expect we have more than we need to benefit – happily – in the event of a never-ending speculative bubble, and that we’ve retained all the proper defense we need to defend against whatever collapse may eventually arrive.
For anyone waiting for me to turn bullish as their signal to sell at the bubble highs, I’ll gently suggest that the title of this comment may be as much as you can ever hope to get.
Disclosure Notice
Performance data quoted represents past performance. Past performance does not guarantee future results. Investment return and principal value of an investment will fluctuate so that an investor’s shares, when redeemed, may be worth more or less than their original cost. Current performance may be lower or higher than the performance data quoted. More current performance data through the most recent month-end are available at the Fund’s website www.hussmanfunds.com or by calling 1-800-487-7626.
Investors should consider the investment objectives, risks, and charges and expenses of the Funds carefully before investing. For this and other information, please obtain a Prospectus and read it carefully.
The Hussman Funds have the ability to vary their exposure to market fluctuations depending on overall market conditions, and they may not track movements in the overall stock and bond markets, particularly over the short-term. While the intent of this strategy is long-term capital appreciation, total return, and protection of capital, the investment return and principal value of each Fund may fluctuate or deviate from overall market returns to a greater degree than other funds that do not employ these strategies. For example, if a Fund has taken a defensive posture and the market advances, the return to investors will be lower than if the portfolio had not been defensive. Alternatively, if a Fund has taken an aggressive posture, a market decline will magnify the Fund’s investment losses. The Distributor of the Hussman Funds is Ultimus Fund Distributors, LLC., 225 Pictoria Drive, Suite 450, Cincinnati, OH, 45246.
The Hussman Strategic Market Cycle Fund has the ability to hedge market risk by selling short major market indices in an amount up to, but not exceeding, the value of its stock holdings. However, the Fund may experience a loss even when the entire value of its stock portfolio is hedged if the returns of the stocks held by the Fund do not exceed the returns of the securities and financial instruments used to hedge, or if the exercise prices of the Fund’s call and put options differ, so that the combined loss on these options during a market advance exceeds the gain on the underlying index. The Fund also has the ability to leverage the amount of stock it controls to as much as 1 1/2 times the value of net assets, by investing a limited percentage of assets in call options.
The Hussman Strategic Allocation Fund invests primarily in common stocks, bonds, and cash equivalents (such as U.S. Treasury bills and shares of money market mutual funds, aligning its allocations to these asset classes based on prevailing valuations and estimated expected returns in these markets. The investment strategy adds emphasis on risk-management to adjust the Fund’s exposure in market conditions that suggest risk-aversion or speculation among market participants. The Fund may use options and futures on stock indices and Treasury bonds to adjust its relative investment exposures to the stock and bond markets, or to reduce the exposure of the Fund’s portfolio to the impact of general market fluctuations when market conditions are unfavorable in the view of the investment adviser.
The Hussman Strategic Total Return Fund has the ability to hedge the interest rate risk of its portfolio in an amount up to, but not exceeding, the value of its fixed income holdings. The Fund also has the ability to increase the interest rate exposure of its portfolio through limited purchases of Treasury zero-coupon securities and STRIPS. The Fund may also invest up to 30% of assets in alternatives to the U.S. fixed income market, including foreign government bonds, utility stocks, convertible bonds, real-estate investment trusts, and precious metals shares.
The Prospectus of each Fund contains further information on investment objectives, strategies, risks and expenses. Please read the Prospectus carefully before investing.
The Market Climate is not a formula but a method of analysis. The term “Market Climate” and the graphics used to represent it are service marks of Hussman Strategic Advisors (formerly known as Hussman Econometrics Advisors). The Fund Manager has sole discretion in the measurement and interpretation of market conditions. Information relating to the investment strategy of each Fund is described in its Prospectus and Statement of Additional Information. A schedule of investment positions for each Fund is presented in the annual and semi-annual reports. Except for articles specifically citing investment positions held by the Funds, general market commentary does not necessarily reflect the investment position of the Funds.
A message from Advisor Perspectives and VettaFi: Discover something new! Click here to register for our upcoming webcasts.
Membership required
Membership is now required to use this feature. To learn more:
View Membership BenefitsSponsored Content
Upcoming Virtual Events View All


