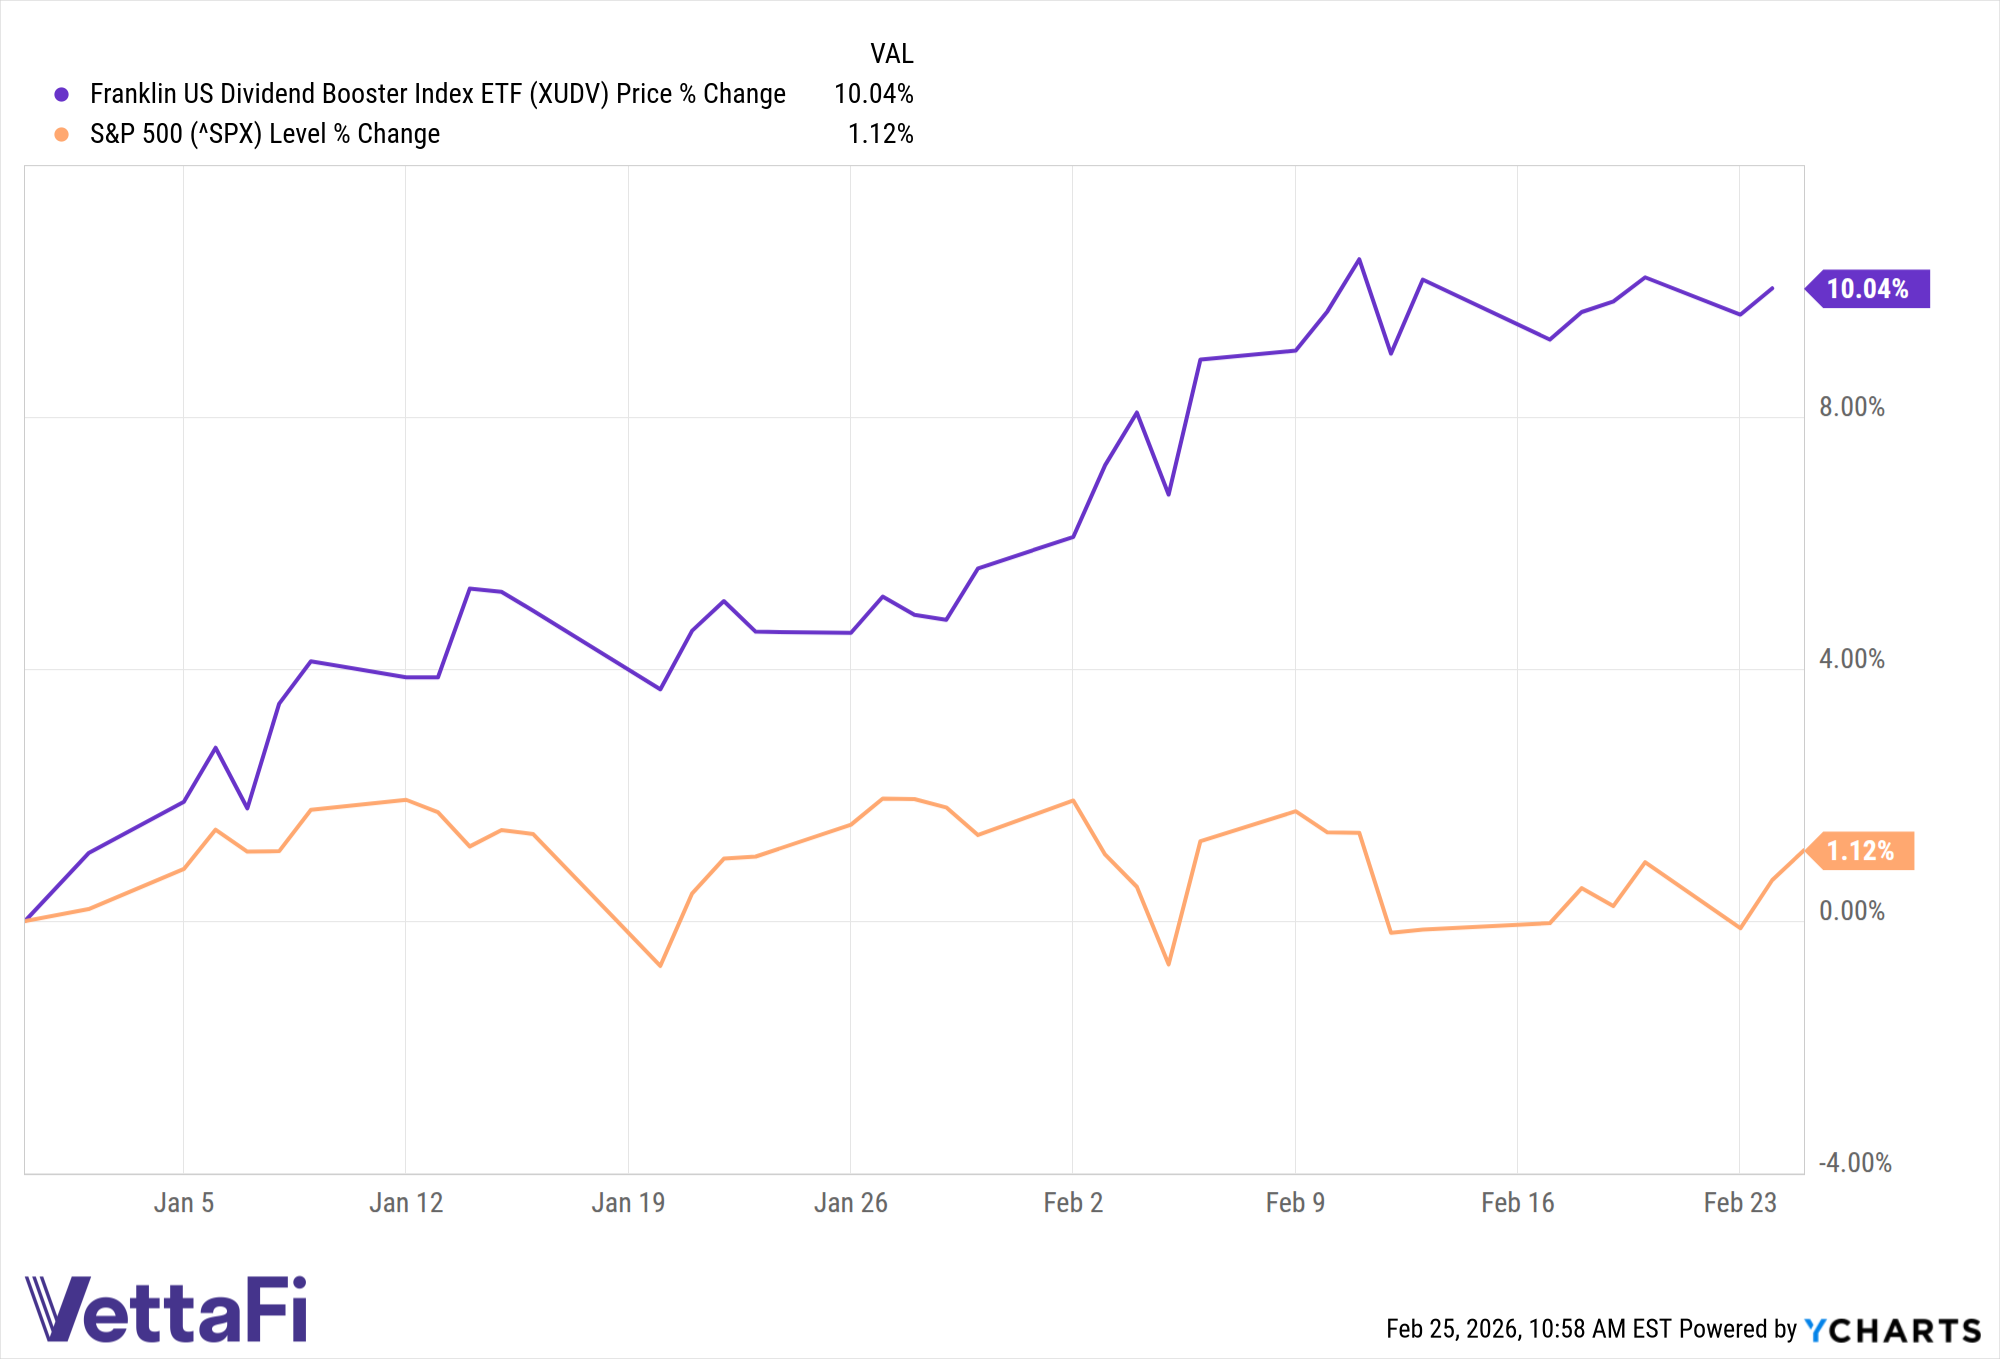
Strong performance and dividend yields amid volatility — typically, an investor may need to sacrifice one in order to maximize the other. However, the Franklin U.S. Dividend Booster Index ETF (XUDV) is proving otherwise. With a year-to-date gain of just over 10% and a 30-day SEC yield of 4.55% (as of January 31), it’s a viable option for investors looking to meld performance and maximized quarterly dividend distributions while limiting volatility.
Strong YTD Performance
The engine moving the fund’s performance is the underlying index: the VettaFi New Frontier US Dividend Select Index. This results in a systematic, rules-based strategy managed by VettaFi that seeks to provide excess yield without sacrificing stability.
The strategy begins with the VettaFi US Equity Large-Cap 500 Index (the parent index), onto which a sophisticated optimization screener is applied. The ultimate goal is to provide a “boosted” dividend yield that minimizes volatility relative to the parent index. In essence, the fund doesn’t just choose the highest-yielding stocks. Rather, it applies a discerning screener that selects and weight securities based on:
- Yield maximization: achieving the highest income return possible;
- Volatility mitigation: limiting market fluctuations relative to the broad market; and
- Diversification: applying individual stock and sector weighting limits to prevent over-concentration.
The index is reconstituted quarterly, ensuring the fund remains aligned with current market conditions.
While major market indexes are heavy on technology names, XUDV tilts towards financials (19.85%), consumer staples (15.67%), healthcare (10.49%), industrials (10.17%), and energy (9.71%) to round out the top five sector exposures (as of February 24). With tech seeing heavy volatility as investors question AI valuations relative to their fundamentals, XUDV has been easily outpacing the S&P 500. Tech is still part of the fund’s portfolio, but kept to 7.71% as opposed to the S&P’s over 30%.