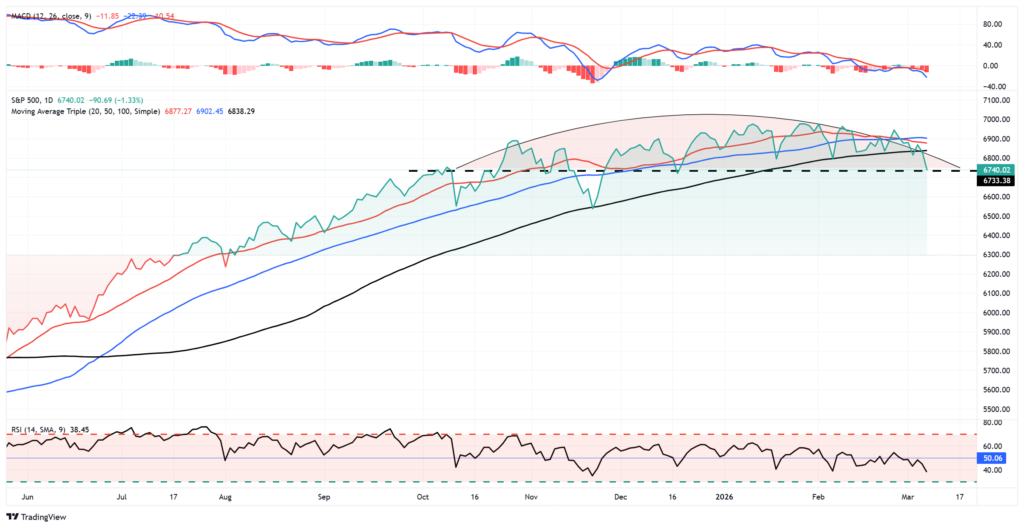
The S&P 500 closed at 6,740 on Friday, its lowest level since mid-December, as technical deterioration, collapsing payrolls, and $100 oil converged on the charts. Every major moving average has broken. Here’s what comes next.
The S&P 500 closed at 6,740.02 on Friday, down 90.69 points or 1.33%, capping a week that delivered the index’s worst performance since mid-October and its lowest closing level since mid-December. The technical deterioration that had been building beneath the surface for weeks is now impossible to ignore. With the Dow off 453 points, the Nasdaq down 1.59%, the Russell 2000 shedding 2.33%, and the VIX surging 24% to close at 29.49, Friday’s session carried the unmistakable signature of institutional distribution, not a garden-variety pullback. But the headline risk merely accelerated a breakdown we have discussed over the last few weeks.

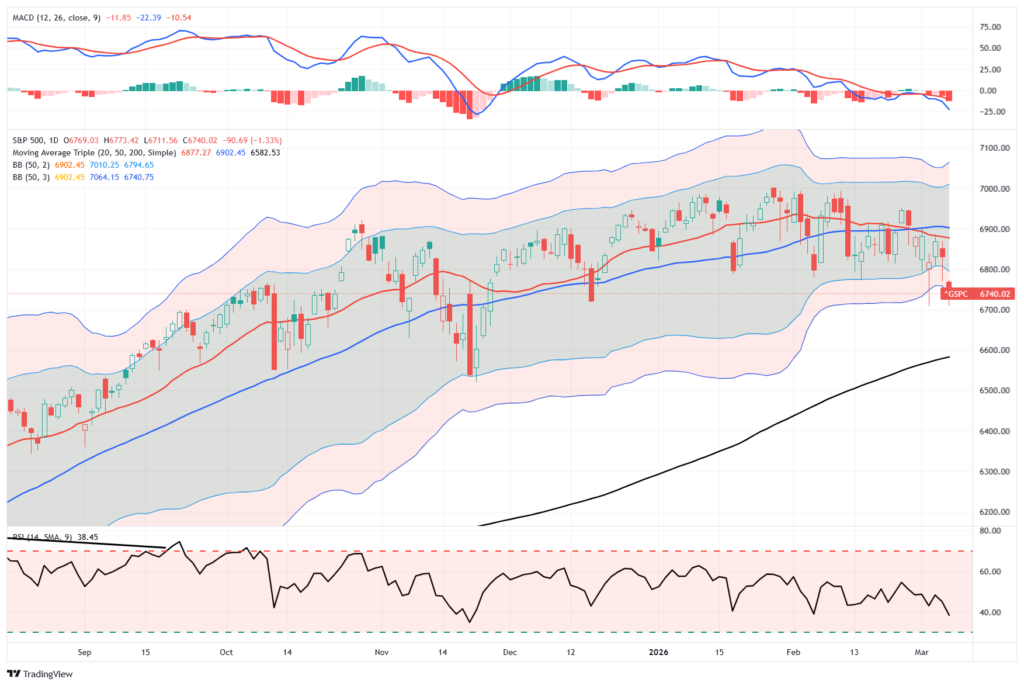
Chart updated through Friday.
On Friday, the market did indeed break support, and selling pressure accelerated. The catalyst cocktail was potent: February non-farm payrolls shocked at negative 92,000 against expectations of positive 70,000, unemployment ticked up to 4.4%, and WTI crude broke above $90 per barrel to post a 35% weekly gain, the largest since oil futures trading began in 1983, as the Strait of Hormuz effectively shut down amid the escalating US-Iran conflict. But the macro headlines merely accelerated a breakdown the charts had been telegraphing since the failed all-time-high attempt at 7,002 in late January. The technical deterioration is now the story, and risk management is the only rational response.
Systemic Breakdown
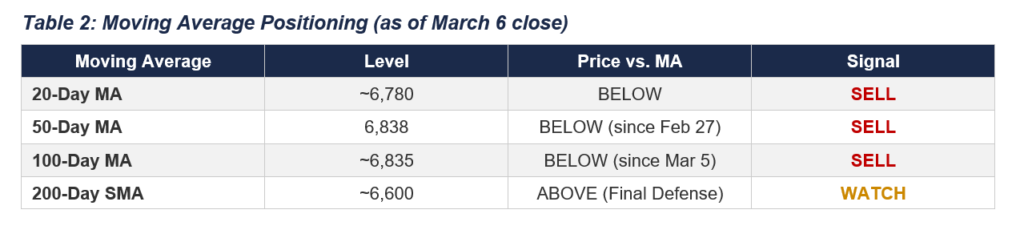
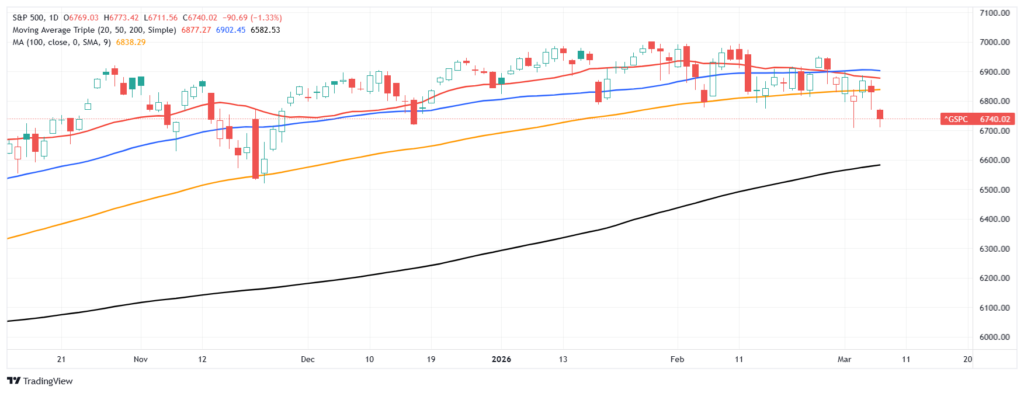
The most critical development is the systematic breakdown of every short-term moving average. The S&P 500 has been trading below its 50-day moving average at 6,838 since February 27. On March 5, it cracked the 100-day moving average near 6,835. Friday’s close at 6,740 now places the index roughly 100 points below that entire cluster. With the broken averages now converting from support to resistance. Of the 12 moving average signals we track, 10 are on a sell signal. A degree of alignment that does not occur in routine corrections.
The 20-day moving average has also crossed below the 50-day. The “death cross” adds additional resistance and increases selling pressure on rallies. As Pink Floyd notes, it’s “another brick in the wall” of the deterioration since the market’s high of 7,002. Notably, the 200-day moving average, now approximately 6,582, looms as the final line of defense. Historically, when the index trades below its 100-day average during a period of rising oil prices, the probability of mean-reverting to the 200-day average increases significantly.
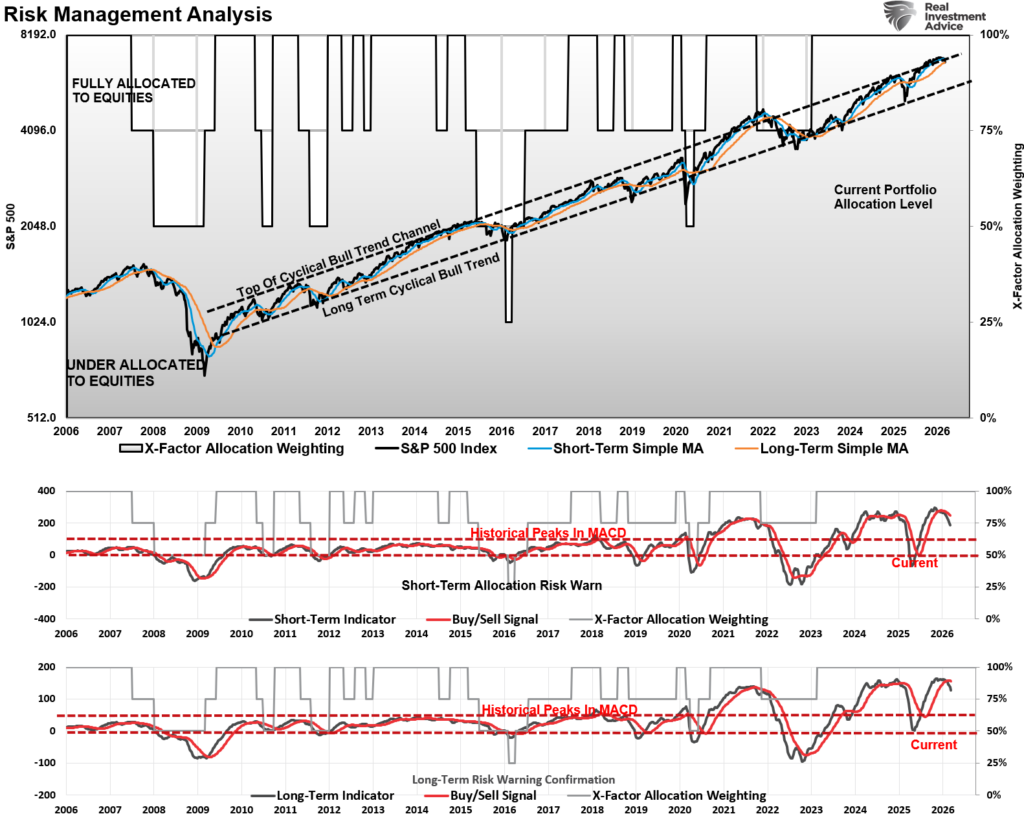
The weekly chart structure reinforces the bearish case. As shown, with the market trading at the top of its long-term bullish trend, the combined “sell signals” of the short and intermediate-term momentum indicators were last seen in 2022. With the long-term trend supports substantially lower, the risk calculus of equities is shifting away from investors.
The consolidation pattern and the market’s bifurcation were signaling that risk was building. The recommendation has been to reduce and rebalance risk over the last few weeks. Failed bullish patterns are often more bearish than outright bearish patterns, because they trap committed longs who become forced sellers. The technical deterioration in the pattern structure has shifted the burden of proof squarely onto the bulls.
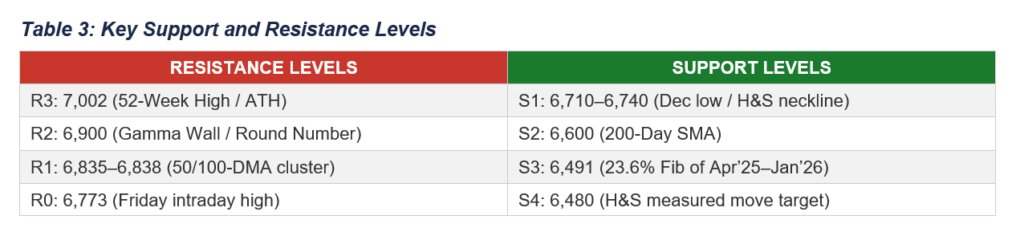
Key Levels To Watch
For longer-term investors, key support and resistance levels are worth watching. What the markets do next will determine whether the bulls can maintain control of the market.
Notably, the near-term story is not all bad. The 14-day Relative Strength Index is at 38.45, approaching oversold levels in absolute terms. More importantly, the RSI exhibited a textbook bearish divergence at the all-time high: price made a new peak, but momentum did not confirm. We repeatedly discussed that divergence was the earliest signal of the distribution phase now unfolding. With the RSI not in oversold territory below 30, there is room for more pressure before a technical bounce becomes probable.
The MACD reading of -10.54 is also bearish, but approaching more oversold levels. The MACD line crossed below the signal line in late February while still above the zero line, a configuration that historically produces the highest-conviction sell signals. The histogram shows six consecutive deeper negative bars with no visible convergence, keeping downward pressure on markets near-term.
Bollinger Bands add a volatility dimension to the technical deterioration. After compressing to some of the tightest readings since October 2025, a classic squeeze formation, the bands expanded sharply to the downside. Price is now three standard deviations below the 50-DMA and is a levels that generally support a reflexive rally. The squeeze resolution to the downside suggests volatility will remain elevated through mid-March, a timeframe that coincides with historical seasonal weakness and pre-tax-season liquidity drains.
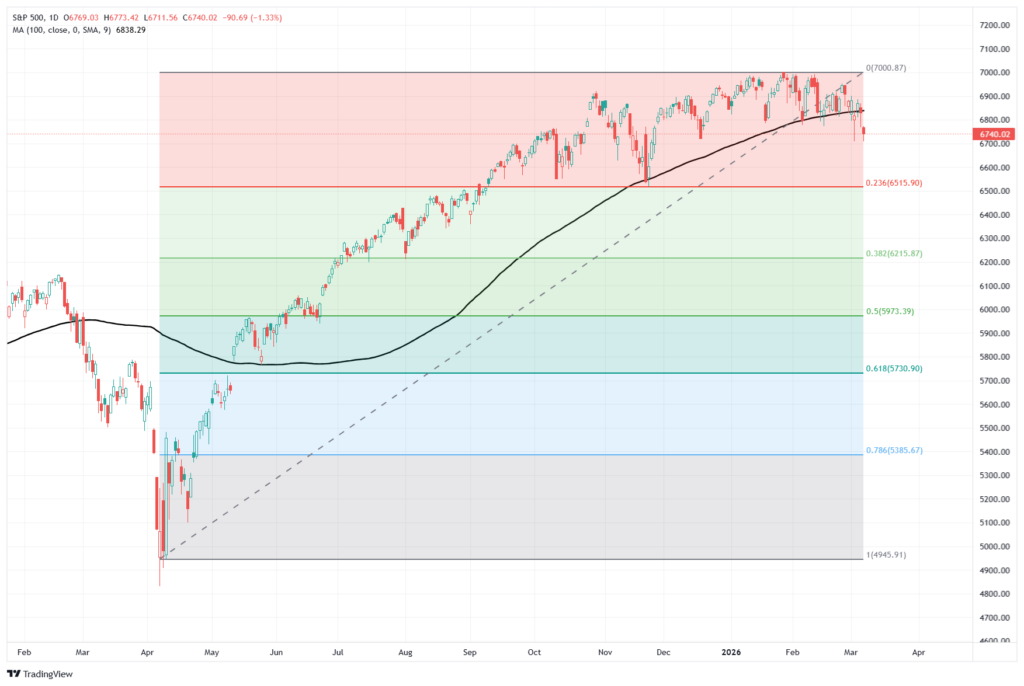
Fibonacci, Volume and Breadth
Fibonacci retracement levels both confirm the market’s bearish break and confirm that downside risk has increased. From the current rallies’ April lows, the first retracement level is 6,515, which represents a 23.6% retracement from the peak. If the market fails to hold those levels, we will be in a much more bearish “risk off” environment, with the next targets of 6,215 (38.2%) and 5,973 (50%) retracement levels becoming more viable.
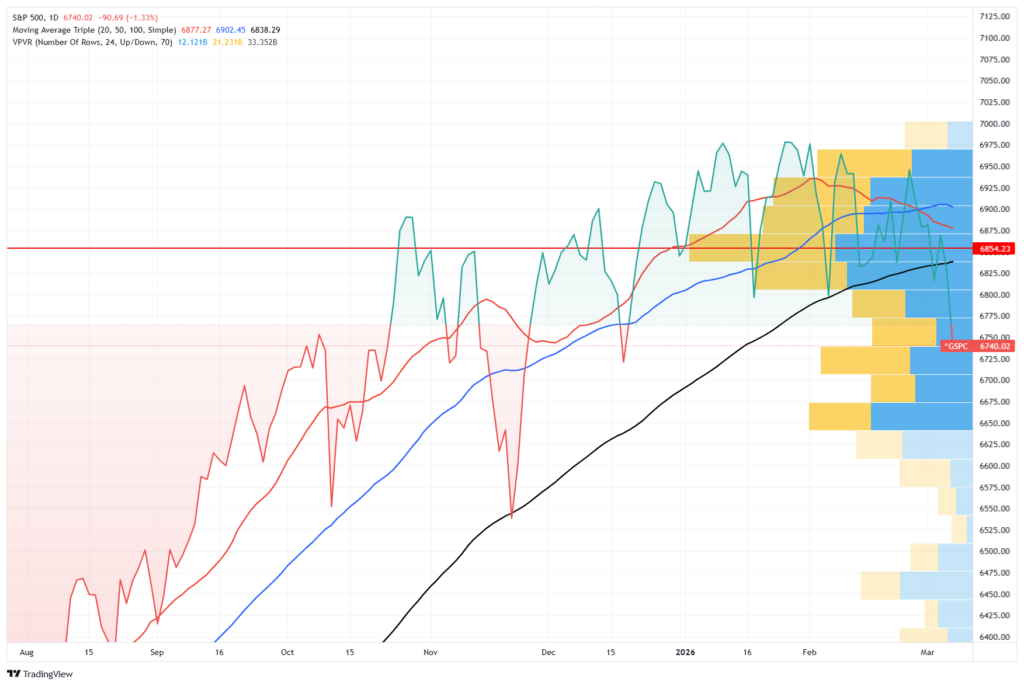
Volume analysis confirms the technical deterioration is driven by institutional activity, not retail noise. The March 5 breakdown through the 100-day moving average occurred on volume roughly 20–25% above the 20-day average, the signature of conviction selling. The volume profile’s Point of Control for the past 90 days sits near 6,860–6,900, meaning the bulk of positions accumulated during the consolidation phase are now underwater. That overhang creates additional selling pressure as trapped longs reduce exposure.
Market breadth has been deteriorating beneath the surface for weeks. The Magnificent Seven divergence was an early warning that the rally was narrowing to a dangerous degree, and as noted in the “Business Cycle Narrative,” the rotation to defensives is a late-cycle characteristic that the current correction is forcing investors to confront.
This Week’s Playbook
The catalyst calendar offers no reprieve. The US-Iran conflict shows no signs of de-escalation, with oil testing $100 and calls for $120-plus if Gulf shipping is further disrupted. February’s payrolls shock has repriced Fed rate-cut expectations to September 2026, reviving the stagflation narrative. This week’s CPI report will be closely watched by traders for clues on the Fed’s next move.
None of this means the secular bull market is over. The monthly chart trend from the October 2022 low remains intact, and the 200-day moving average has historically served as a reliable floor during mid-cycle corrections. But the degree of technical deterioration across multiple timeframes and indicator classes demands a disciplined risk management response, not a buy-the-dip reflex.
The tactical playbook is clear. Any relief rally into the 6,830–6,850 zone, where the broken 100-day and 50-day moving averages should now act as resistance, presents an opportunity to initiate hedges or reduce long exposure, with a stop at 6,960 above the prior Point of Control.
For long-only portfolios, raising cash to 10–15% of the portfolio and increasing short-term bond holdings can provide a decent hedge against further volatility. However, be patient before becoming overly defensive, as the market is already short-term oversold enough to support a reflexive rally.
Markets do not move in straight lines. The compounding effect of a failed all-time-high breakout, a consolidation breakdown, geopolitical shocks, and valuation repricing has created the most challenging technical environment in over two years. The question is not whether risk management matters during acute technical deterioration, it is whether you had it in place before the deterioration became obvious.
For those who did not, today is the second-best time to start.
Lance Roberts is a Chief Portfolio Strategist/Economist for RIA Advisors. He is also the host of “The Lance Roberts Podcast” and Chief Editor of the “Real Investment Advice” website and author of “Real Investment Daily” blog and “Real Investment Report“. Follow Lance on Facebook, Twitter, Linked-In and YouTube Customer Relationship Summary (Form CRS)
Join RIA Advisors and elevate your career within a deeply experienced team focused on innovation. Our collaborative environment is built on a foundation of advanced technology and effective investment models, designed to enhance your ability to serve clients and grow your practice. Benefit from a supportive culture that encourages professional development and fosters a forward-thinking approach. By joining our team, you’ll be part of a group dedicated to excellence and continuous improvement, empowering you to focus on building meaningful client relationships and pursuing your business ambitions. Discover the advantages of working with our accomplished advisory team by starting your conversation today.
A message from Advisor Perspectives and VettaFi: Discover something new! Click here to register for our upcoming webcasts.
© Real Investment Advice
Read more commentaries by Real Investment Advice