Oil and Freight Markets Surge as Gulf Conflict Escalates
Membership required
Membership is now required to use this feature. To learn more:
View Membership BenefitsMarkets hate uncertainty, and right now there’s plenty to go around. The outbreak of the U.S.-Iran conflict, following by Iranian retaliation against oil infrastructure across the Persian Gulf, has sent crude prices surging and shipping rates soaring to record levels.
I get the urge to reach for the sell button. When you see crude oil jumping to seven-month highs in a matter of days, it’s natural to want to head for the exit. But if decades of investing through geopolitical crises have taught me anything, it’s this: don’t panic.
The data, history and consensus view from the world’s leading investment banks all point in the same direction. This conflict is likely to be intense but short-lived, and the investors who keep their composure will be the ones best positioned when the dust settles.
The Facts on the Ground
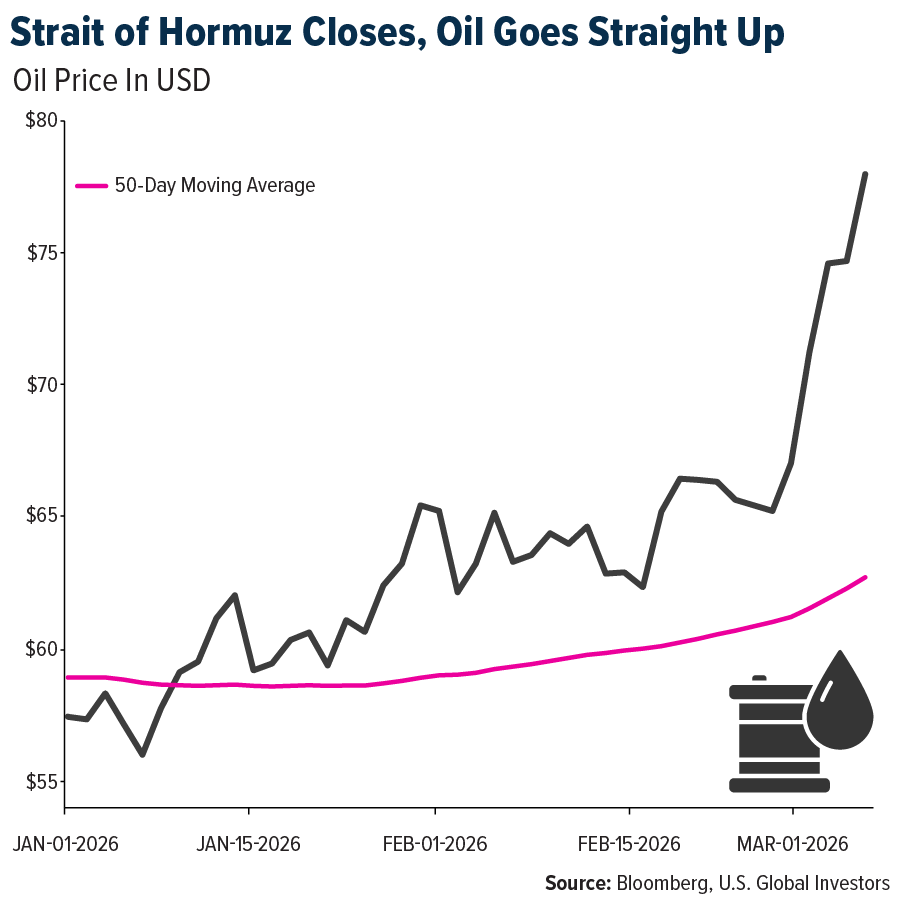
The U.S. and Israel launched joint airstrikes across Iran on February 28, and Iran’s supreme leader was confirmed killed. Iran retaliated by striking oil and gas facilities in Saudi Arabia, the UAE, Qatar and Kuwait, taking capacity offline and effectively shutting down transit through the all-important Strait of Hormuz.
Indeed, Hormuz is the jugular of global energy. Roughly a quarter of the world’s oil consumption passes through it, and vessels are now having to avoid the waterway due to the risk of attack and insurers cancelling war risk cover.
The disruption is already showing up across the supply chain.
For instance, the cost of hiring a supertanker to ship 2 million barrels of crude from the U.S. Gulf Coast to China has reportedly hit an unbelievable $29 million, a new record, according to the Baltic Exchange in London. Shipping oil from the Arab Gulf to India has exploded from between $50,000 and $100,000 to an eye-watering $477,000 per day. Meanwhile, Maersk and CMA CHM have rolled out emergency surcharges and, in CMA’s case, suspended bookings for hazardous goods across a huge portion of the region.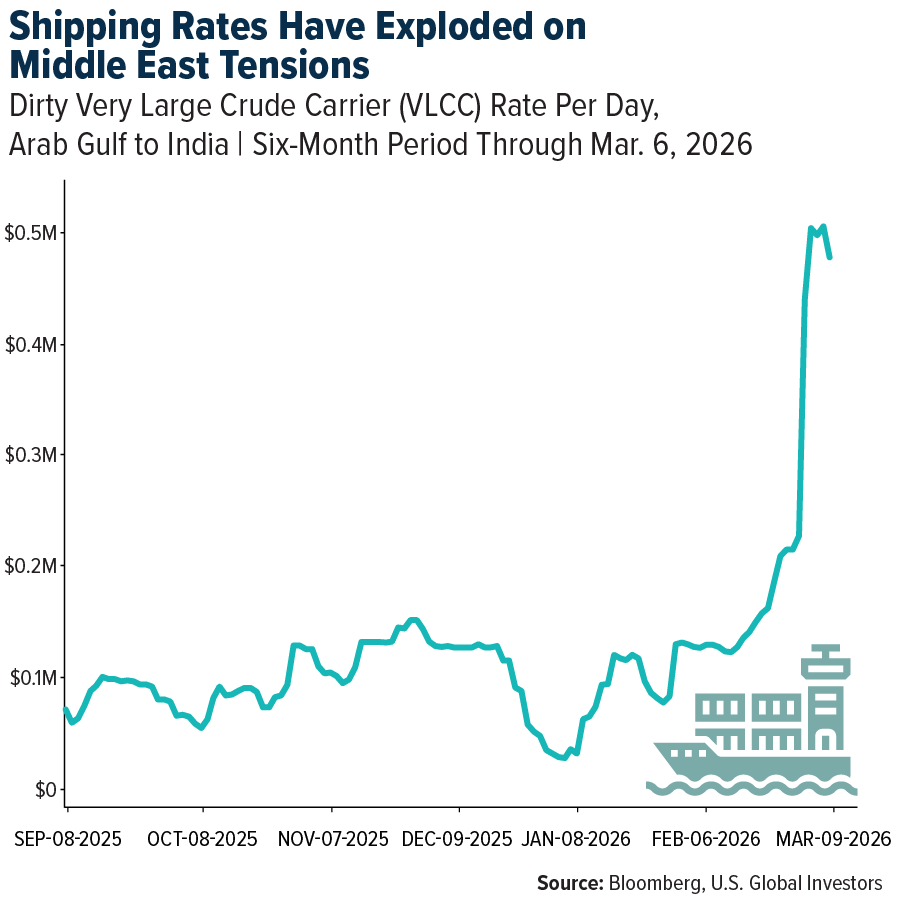
Why I Believe This Will Be Short-Lived
Despite the dramatic headlines, I believe the evidence strongly favors a brief conflict.
For one, Iran is outmatched. According to CLSA, U.S. military spending exceeds Iran’s by a factor of 126 to 1. Without boots on the ground, this is more likely to resemble the limited strikes in 2024 and mid-2025 than a prolonged occupation like Iraq.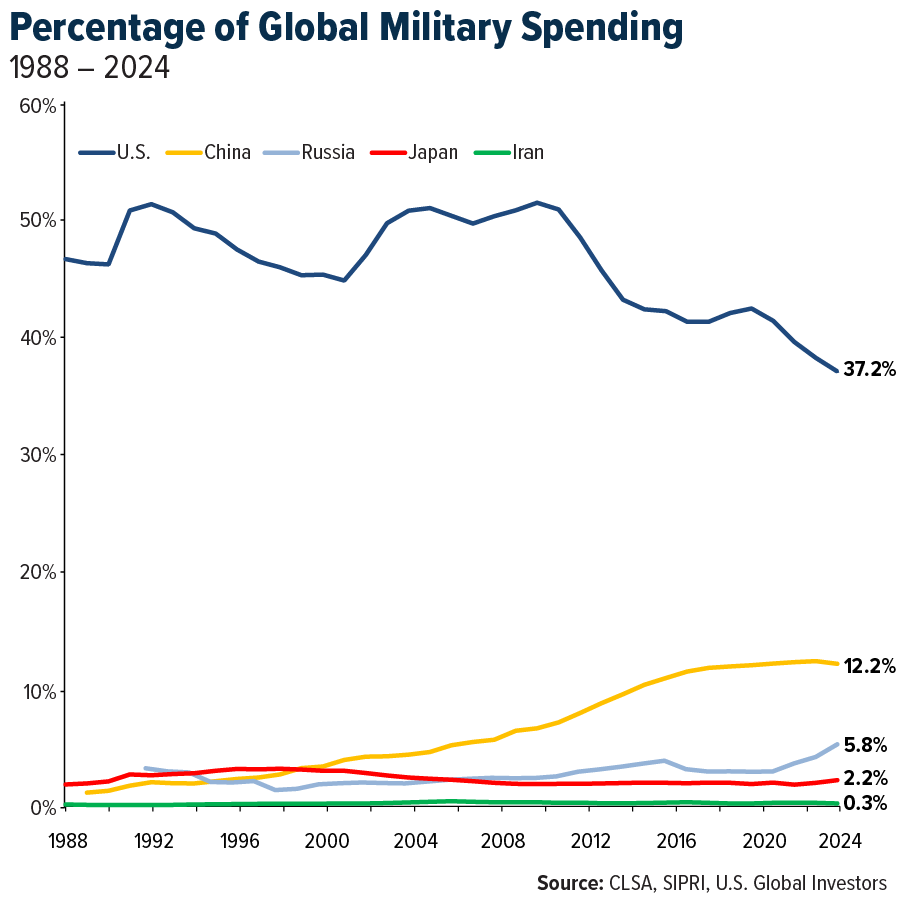
Two, there’s a powerful political incentive to wrap this up quickly. The Trump administration is acutely aware that energy prices are a kitchen-table issue heading into the 2026 midterms. A Morgan Stabley analysis noted that public approval for the strikes sits at only about 27%. A short, decisive operation lets the administration claim a national security win without saddling voters with $4-plus gasoline.
And three, the Strait of Hormuz is simply too important to stay closed for long. It’s a vital artery for seaborne oil with few alternative routes. Fitch Ratings expects the effective closure to be temporary, and the U.S. is already mulling Navy escorts similar to the taker wars of the 1980s. The global economy can’t function without this checkpoint, and every major power knows it.
What History Tells Us About Oil Shocks
This isn’t the first time geopolitical events have sent oil prices spiking, and the pattern is remarkably consistent. Oil prices had already been climbing on geopolitical risk premium before the first strikes, and that premium tends to fake once the immediate threat subsides. Iran and Israel exchanged missile strikes twice in 2024, and again in mid-2025. Each time, oil continued to flow and prices retraced.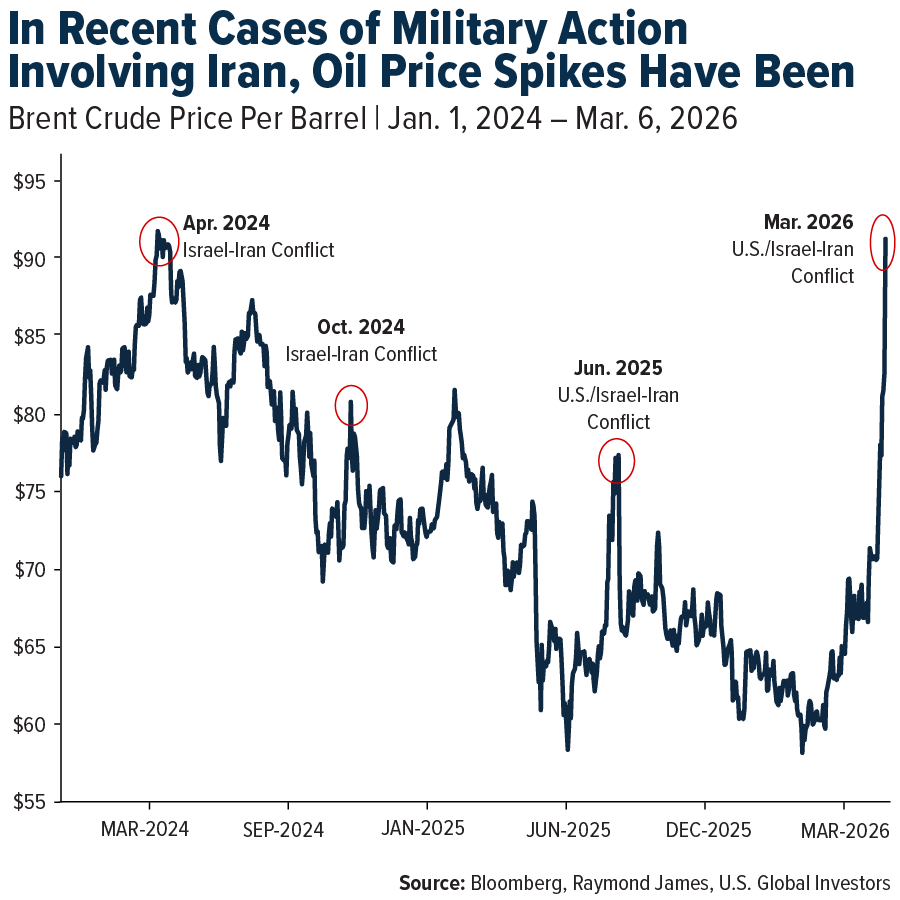
Goldman Sach’s range of scenarios is instructive. They estimate oil price increases of between $1 to $15 per barrel depending on the extent and duration of Strait closures, with offsets like spare pipeline capacity and strategic petroleum reserves providing cushions. Even Bloomberg’s more alarming $108-a-barrel scenario assumes a prolonged closure, which, as I’ve already outlined, is the low-probability tail risk.
Where I See the Opportunities
I see the current developments as presenting both near-term challenges and significant opportunities, particularly across certain sectors where U.S. Global Investors focuses.
Shipping is the immediate beneficiary. The near-halt of transport in the Strait of Hormuz has repriced global freight markets overnight. This is a windfall for shipping companies, and the elevated rates are already locked in regardless of whether the conflict ends tomorrow or in a month.
Energy and commodities look well-supported. Even before the conflict, UBS saw further upside for broad commodities in 2026, driven by metals. The geopolitical premium on oil adds another layer. UBS specifically recommends actively managed commodity strategies given the elevated intra-commodity volatility. That makes for an environment that I believe favors active, nimble approaches over passing indexing.
Airlines face a short-term headwind but a medium-term opportunity. Yes, jet fuel costs are rising, and that puts pressure on margins. But many airlines, particularly European and certain Latin American and Asia-Pacific carriers, maintain hedging programs. More importantly, history shows that consumer travel demand rebounds after initial disruptions. If the conflict is as short as the consensus expects, airlines represent a classic recovery trade, similar to what we saw during the pandemic.
The Bottom Line
I’ve been in the business long enough to have lived through the Gulf War, 9/11, Iraq, the Arab Spring and countless other geopolitical shocks. Every single time, the temptation to sell everything and hide in cash was enormous, and every single time, the investors who stayed the course came out ahead.
JPMorgan put it well in their latest note. They write that, “through countless crises, wars, pandemics and recessions, investors who have stayed the course have recouped losses and benefited from growth, innovation and progress.” That doesn’t mean you should be reckless. As always, I recommend a 10% weighting in gold, which can enhance diversification and serve as a buffer against geopolitical risk.
As CLSA wisely cautioned, wars and financial shocks hit your highest-conviction trades hardest, because that’s where people take profits in a panic. The problem is that if you cut your strongest positions now, you risk being badly positioned for the snapback.
The fundamentals of the global economy have not changed. Travel demand is intact. Shipping companies are earning record rates. And energy markets are functioning, even if they’re under stress. The most likely outcome is that this conflict resolves in days or weeks, and oil eases back. The investors who held their nerves might be glad they did.
Airlines and Shipping
Strengths
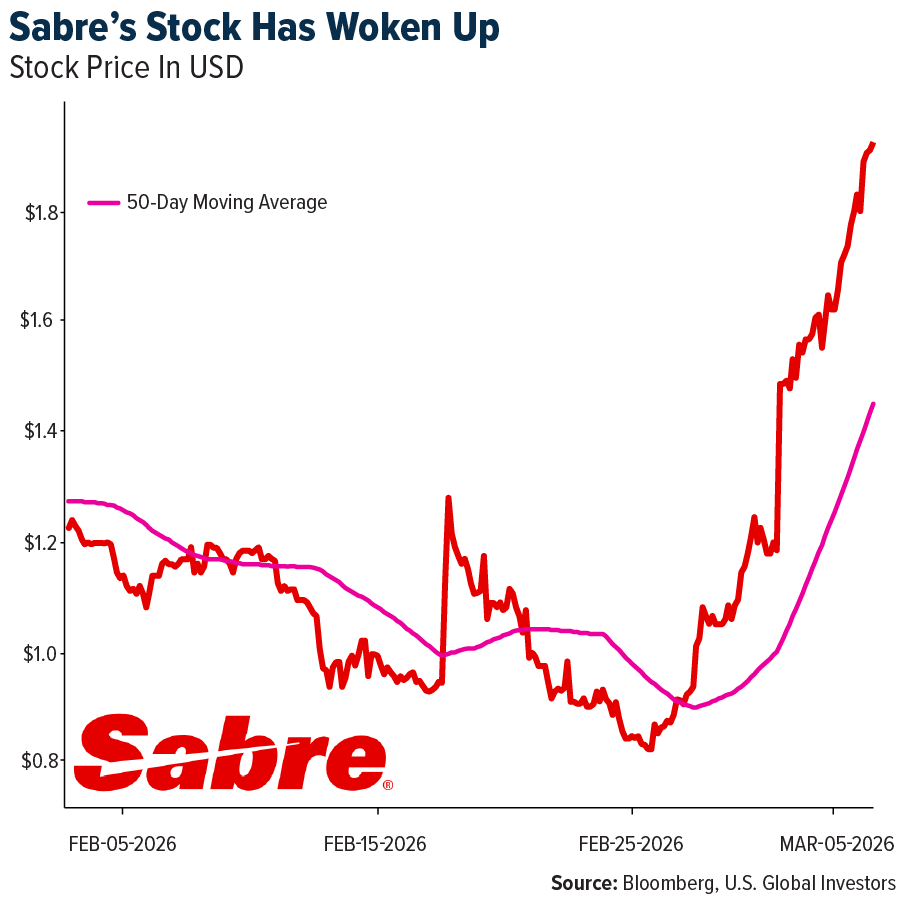
- The best-performing airline stock for the week was Sabre, up 34.8%. Turkish Airlines reported $883 million in net income in Q4, up 24% year-over-year (YoY) and well ahead of consensus. Revenue and EBITDAR margin for 2025 landed at the upper end of guidance. The quarter also saw accelerated passenger growth (+16% year-over-year (YoY)), according to JP Morgan.
- UBS notes that quotes for departures after March 11 are on average 50% higher versus last week’s quotes, reflecting the consequences of the Middle East conflict. Routes touching the Middle East are seeing a 300% increase in quotes, while Europe is seeing 50% increases, and the U.S. is seeing 20% sequential growth.
- There has been a significant accumulation of shares by Constellation (12.7% holding). Sabre initiated a shareholder rights plan that would have lasted for one year, but just terminated it. Constellation now has one board seat on the company, despite seeking two.
Weaknesses
- The worst-performing airline stock for the week was Allegiant, down 22.2%, as higher jet fuel is putting travel stocks under pressure. According to Morgan Stanley, Wizz Air announced that the Middle East disruption will result in a EUR 50 million earnings impact, pushing net income below its previously guided range of EUR -25 million to EUR 25 million. Middle East exposure accounts for 6% of group seats. The impact is split as follows: EUR 16 million from service cancellations and EUR 34 million from FX (EUR 24 million) and jet fuel (EUR 10 million) at current rates.
- According to UBS, the closure of the Strait of Hormuz may affect 38% of global seaborne crude oil trade (and 20% of global supply), 3.5% of container trade, and 2% of dry bulk trade exposure. Volumes will need to be significantly rerouted.
- Aeroports de Paris is the most exposed to the Middle East, with approximately 5.3% of traffic in Paris, according to Bank of America. In other companies, the Middle East makes up 5.1% of Flughafen Zurich’s 2025 traffic and 4.8% of Fraport’s Frankfurt Airport traffic.
Opportunities
- Japan Airlines is the first airline to report increased business from passengers who normally fly UAE and Dubai carriers. Turkish Airlines is well-positioned to capture market share in the short and medium term through its expanded Istanbul hub. On Thursday, Turkish Airlines CFO Murat Şeker noted rising demand from passengers “stranded and wanting to get back to their final destination.” Additionally, passenger demand from India to North America is shifting to routes via Japan.
- More than 40% of seaborne crude exports pass through the Strait of Hormuz, and these flows are facing disruptions, including reports of tanker attacks. VLCC tanker rates could rise further due to higher risk premiums and increased demand for white tankers from Iran export disruptions, according to Bank of America. Upside risks also exist from changes to U.S. sanctions or tanker inefficiencies if Hormuz disruptions continue.
- Airlines in Europe are adding direct flights to Asia to recapture passengers who previously transferred through the Gulf, despite logistical challenges around crew, permits, and landing slots.
Threats
- Asia Pacific airlines are facing spiking fuel costs with varying levels of hedging—Chinese, Indian, and Taiwanese carriers are largely unhedged, while Qantas is best protected. Middle East flight cancellations will hit IndiGo and Air India hardest, with 47% and 30% of their international capacity, respectively, connecting through the region. The Big 3 Chinese airlines have 4–8% of international capacity via the Middle East, while other Asian carriers have less than 2%, according to Bank of America.
- Airspace closures could disrupt Middle East cargo supply, which accounts for 13% of 2025 air cargo volumes. Asian and European airlines may also see cargo disruptions due to lower payload capacity from longer flight times, according to Bank of America.
- Jet fuel prices are beginning to spike, with almost 20% of supplies normally transiting the Strait of Hormuz. Ship transits have been nearly nonexistent over the past 2–3 days. European carriers are heavily hedged, mitigating much of the impact, but spot prices are now above 2026 annual airline guidance ($2.40–$2.60/gallon).
Luxury Goods and International Markets
Strengths
- The Ratingdog (formerly Caixin) China PMI came in stronger than expected, with the February PMI rising to 52.1, signaling expansion in business activity. In contrast, China’s official manufacturing PMI remains below the key 50 level, indicating contraction among larger state-owned companies. The difference lies in that Ratingdog PMI focuses more on smaller private firms, while the official PMI primarily reflects large state-owned manufacturers.
- Consumer spending in Europe strengthened compared with the same period last year, accelerating from roughly 1.5% growth in January 2025 to 2.0% in January 2026. This improvement suggests that European consumers remain relatively resilient despite ongoing economic and geopolitical uncertainties.
- Wynn Macau, a casino and hotel operator in Macau, was the best-performing stock in the S&P Global Luxury Index over the past five days, with shares rising as investors responded positively to improving Macau gaming trends and stronger visitation from mainland Chinese tourists.
Weaknesses
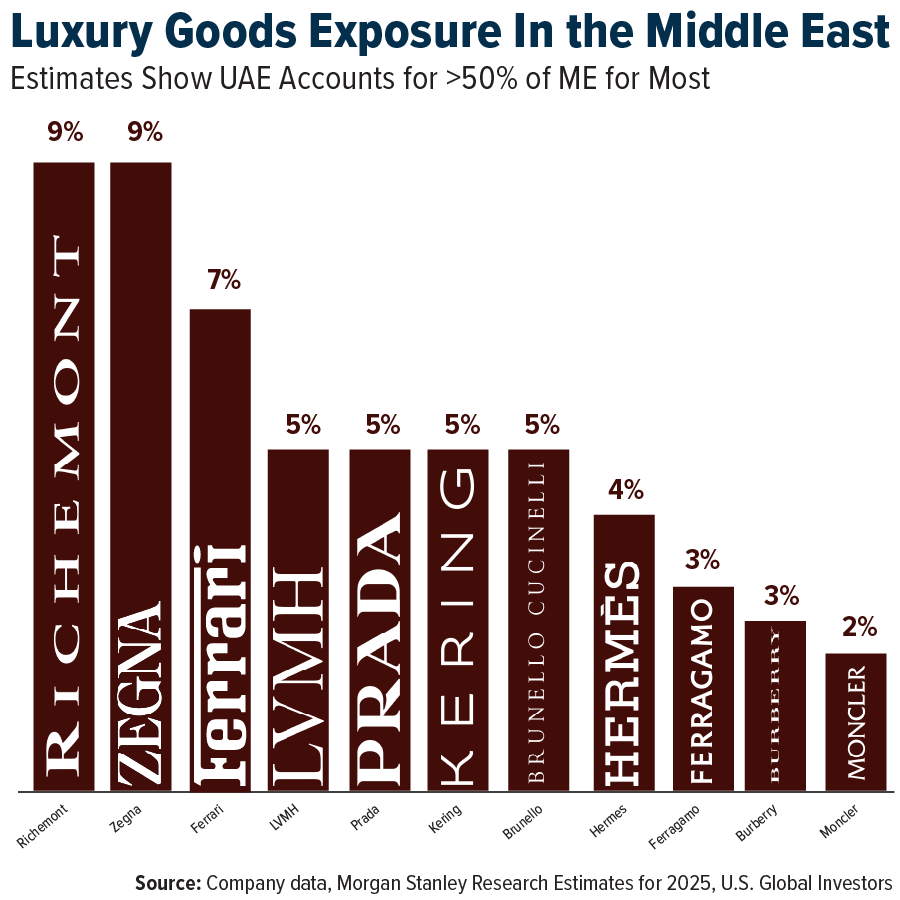
- Bloomberg Intelligence analysts estimate that the Middle East conflict could reduce luxury sector growth by approximately 150 basis points this year. The sector had previously been expected to grow by around 4% in 2026, following flat growth in 2025 and a slight contraction in 2024. However, due to weaker demand and heightened geopolitical risks, the expected growth rate has now been revised down to roughly 2.5%.
- Travel-related stocks were among the weakest performers this week as geopolitical tensions increased following the U.S. attack on Iran and the escalation of conflict across the Middle East. Airlines, cruise operators, and hotel companies sold off as investors worried about rising oil prices, disrupted flight routes, and potential declines in tourism demand. Several airports in the region temporarily suspended operations, and thousands of flights were cancelled, adding to uncertainty for the travel industry. Additionally, reports emerged that airports and some luxury hotels in the region were targeted during retaliatory strikes.
- Norwegian Cruise Line was the worst-performing stock in the S&P Global Luxury Index over the past five days, with shares declining sharply as rising geopolitical tensions and higher oil prices weighed on travel-related companies, raising concerns about potential disruptions to global tourism and cruise demand.
Opportunities
- On Thursday, Prada shares rose despite revenue slightly missing expectations. Investors focused instead on the company’s strong overall growth and profitability. Prada reported 2025 revenue of approximately €5.72 billion, up roughly 5% year-over-year, with net profit increasing to about €852 million, indicating the business is still expanding. Strong growth at Miu Miu also helped support investor confidence, offsetting slower growth at the main Prada brand.
- Kering was upgraded to Market-Perform by Bernstein, as analysts believe the worst of the slowdown may already be priced into the stock. The upgrade reflects expectations that Gucci’s sales decline may stabilize and that management’s turnaround efforts could begin improving performance over the next year.
- Weaker-than-expected U.S. job data reported today could create an opportunity for the Federal Reserve to ease monetary policy later this year. A softer labor market suggests economic growth may be slowing, which could give the Fed more room to cut interest rates if inflation continues to moderate. Lower rates would help support borrowing, investment, and consumer spending, potentially providing a positive backdrop for financial markets and interest-sensitive sectors.
Threats
- Middle East exposure is relatively small for most luxury companies, accounting for about 5% of sales on average, with the UAE making up roughly half of that (~3%). The UAE—especially Dubai—is a key luxury hub, driven largely by tourist spending, which represents about 60% of luxury purchases, mainly from Russian, Chinese, Indian, and Saudi visitors. With Eid al-Fitr around March 19–20, an important shopping period, current geopolitical events could weigh on consumer sentiment and spending timing in the region.
- The recent U.S. attacks on Iran have significantly disrupted global travel, as several Middle Eastern countries closed their airspace and thousands of flights were canceled or rerouted, leaving hundreds of thousands of passengers stranded. This disruption poses a risk to the luxury sector because a large portion of luxury spending is tied to international travel, tourism, and airport retail. When travel declines due to geopolitical tensions, consumers tend to postpone or reduce discretionary purchases, including luxury goods.
- Geopolitical tensions have also pushed oil prices higher, putting additional pressure on travel companies. Cruise line stocks have fallen as investors worry about rising fuel costs, with Carnival down about 7.6% and Norwegian Cruise Line down about 10.5%. Higher fuel prices are particularly concerning because fuel is one of the largest operating costs for cruise companies, which could reduce profit margins if prices remain elevated.
Energy and Natural Resources
Strengths
- The best-performing commodity for the week was WTI crude, up approximately 31.8%. WTI crude emerged as a preferred supply alternative as the escalating Iran conflict raised the prospect of the Strait of Hormuz closing—a chokepoint responsible for roughly 20% of global oil and gas flows. With Middle Eastern supply routes under threat, attention shifted to U.S. producers as a more geopolitically stable source of crude.
- Aluminum surged more than 6% on the London Metal Exchange (LME)—its biggest weekly gain since 2024—after U.S.-Israeli strikes on Iran effectively shut the Strait of Hormuz, threatening the 8% of global aluminum supply produced by GCC smelters that depend on seaborne alumina imports through the strait. Qatar’s Qatalum (648,000 mt/year) is shutting down after Iranian drones disrupted gas supply, Norsk Hydro declared force majeure with a 6–12 month restart timeline, and the U.S. Midwest premium hit a record-matching $106.50/ton as European premiums surged to 3.5-year highs.
- The U.S. decision to grant India a one-month waiver on Russian oil purchases signals that Washington is prioritizing global energy stability over sanctions enforcement, effectively acknowledging the severity of the Middle East supply disruption and the need to keep crude flowing to the world’s third-largest oil importer. This pragmatic policy shift is broadly bullish for risk assets, as it reduces the probability of a full-blown energy crisis that could push the global economy into recession while maintaining an inflationary commodity backdrop.
Weaknesses
- Lithium carbonate was the weakest-performing commodity of the week, declining approximately 5.4%. Zimbabwe’s suspension of lithium concentrate exports disrupted battery supply chains, as the country accounts for nearly 10% of global mined lithium output. The government is also drafting a critical minerals policy requiring miners to declare export compositions, signaling tighter resource control and raising concerns about supply reliability and investment risk.
- PJM’s market monitor is opposing TeraWulf’s plan to acquire a 216-MW Maryland power plant for data center use, warning that removing generation from a constrained grid zone could shift costs and reliability risks to ratepayers. The dispute highlights growing tension between rising AI-driven data center power demand and limited grid capacity.
- China continues to expand nuclear power faster than the rest of the world, reinforcing its strategy to reduce reliance on imported energy and secure long-term baseload power. The pace of development is widening the gap with Western nations that face permitting and financing challenges for new nuclear projects.
Opportunities
- South Africa’s major manganese producers — including African Rainbow Minerals, South32/Anglo American’s Hotazel JV, and Exxaro Resources’s Tshipi Borwa — are bidding to build a new export terminal at Ngqura Port with nearly triple the capacity of the current 5.5 million ton/year facility. With South Africa holding about 70% of global manganese resources and exporting a record 26 million tons in 2025, the expansion aims to capture rising demand from steel and EV battery supply chains.
- Rio Tinto approved a $473 million restart and expansion of the Richards Bay Minerals Zulti South project, extending mine life to 2050 and targeting production in late 2028 after years of delays due to community unrest. The project will help secure long-term titanium dioxide feedstock used in pigments, plastics, and consumer products.
- Hudbay Minerals agreed to acquire Arizona Sonoran Copper Company in a $1.48 billion all-share deal, combining the Cactus project with Hudbay’s adjacent Copper World development. The transaction could more than double annual copper output to over 250,000 tonnes by 2030 and highlights increasing consolidation in the U.S. copper sector as demand rises from electrification and data centers.
Threats
- Shanghai Futures Exchange copper inventories rose to a record 425,145 tons (up 8.6% week-over-week after a 44% surge the prior week), while aluminum stockpiles increased 11% to 394,498 tons — a five-year high. The inventory builds suggest weak physical demand in China despite the recent geopolitical-driven price rally, raising the risk that prices could fall if disruptions around the Strait of Hormuz prove temporary.
- The Iran conflict is disrupting roughly one-third of global fertilizer supply that transits the Strait of Hormuz, sending U.S. urea prices up 22% and Egyptian granular urea up nearly 27%, with some suppliers pulling offers entirely. The disruption comes during the Northern Hemisphere planting season and could contribute to higher food inflation later in 2026.
- Fuel prices across Asia have surged, with Singapore jet fuel rising more than 70% and marine gasoil jumping from about $700 to $1,500 per ton as Middle East supply is disrupted. The spike highlights a key vulnerability in energy markets: unlike crude oil, refined fuels are rarely stockpiled for national security, leaving sectors like aviation and shipping exposed to prolonged supply disruptions.
Bitcoin and Digital Assets
Strengths
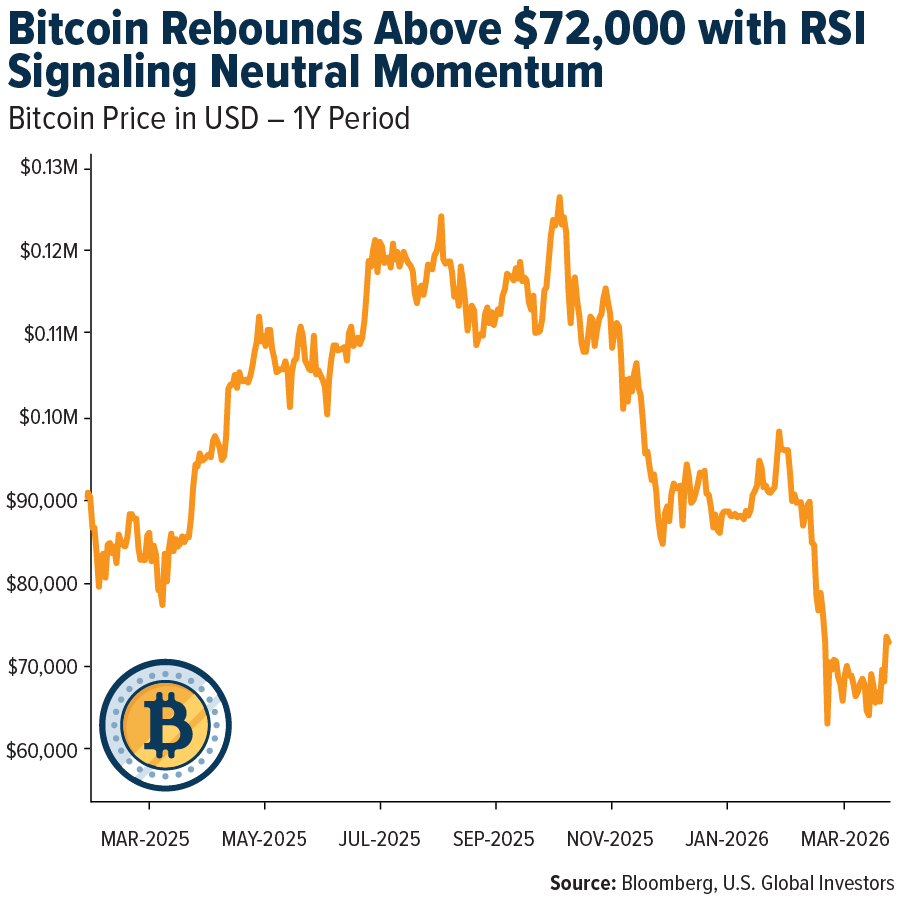
- Bitcoin surged above $72,000 amid heightened global market volatility following escalating tensions in the Middle East. While stocks, oil, and gold experienced sharp swings, the largest cryptocurrency gained more than 6% in a single day. This performance highlights the growing maturity of the crypto market and its resilience during periods of geopolitical uncertainty.
- Andreessen Horowitz, one of Silicon Valley’s most influential venture capital firms managing tens of billions in assets, is reportedly seeking to raise $2 billion for its fifth crypto-focused fund, targeting a close in the first half of 2026. This would follow the firm’s $4.5 billion crypto fund raised in 2023, one of the largest dedicated blockchain venture funds ever. Through its crypto division, a16z crypto, the firm has backed major projects such as Uniswap and Anchorage Digital.
- Major cryptocurrencies rallied sharply as improving market sentiment and institutional inflows boosted demand. Ethereum gained 7.5% to $2,114, while Solana and XRP advanced 5.3% and 4.2%, respectively. The rally was supported by roughly $700 million in inflows into U.S. spot Bitcoin ETFs since early March, highlighting continued institutional interest.
Weaknesses
- Several major Bitcoin mining companies, including MARA Holdings, CleanSpark, and Riot Platforms, are reconsidering their strategy of holding large Bitcoin reserves. Facing declining mining margins, rising energy costs, and pressure to improve returns, some miners have begun selling portions of their combined $8 billion in Bitcoin holdings. The shift reflects structural challenges in the mining business model following the halving cycle.
- A suspect accused of stealing more than $46 million in cryptocurrency from wallets managed by the U.S. Marshals Service was arrested in Saint Martin during a joint operation with the FBI and French authorities. The funds were allegedly taken from wallets holding assets seized from the 2016 Bitfinex hack and moved through multiple blockchain addresses and exchanges. The case highlights operational and security risks in managing large digital asset holdings.
- One year after the U.S. government established a strategic crypto stockpile and Bitcoin reserve, the initiative still lacks a clear acquisition strategy. The reserve, created under President Donald Trump, remains largely unchanged with about 328,272 BTC, while total crypto holdings dropped roughly 26% in value from over $30 billion to $22 billion. No additional purchases have been made, highlighting the uncertainty and lack of clear policy frameworks in managing sovereign crypto reserves.
Opportunities
- Exchange, the owner of the New York Stock Exchange, announced it is acquiring a stake in cryptocurrency exchange OKX in a deal valuing the company at $25 billion. ICE will join OKX’s board and collaborate on developing regulated crypto futures and tokenized securities. The partnership highlights how traditional financial institutions are increasingly integrating blockchain into capital markets.
- Nedbank, one of South Africa’s largest banks, has partnered with Crypto.com to deploy blockchain technology for payments, settlement, and liquidity solutions across Africa. The initiative allows clients to convert South African rand into on-chain dollars in real time, enabling faster and lower-cost cross-border transactions. The partnership illustrates how financial institutions are integrating digital assets into mainstream financial services, particularly in emerging markets.
- Core Scientific, a leading publicly traded Bitcoin mining and digital infrastructure provider in the U.S., has secured up to $1 billion in financing from Morgan Stanley to expand its data center infrastructure. The agreement includes an initial $500 million loan facility with the option to increase by another $500 million for equipment, land, and energy capacity. The funding supports the company’s pivot toward high-performance computing and AI infrastructure while maintaining large-scale mining operations.
Threats
- The ongoing conflict involving Iran has drawn attention to the country’s rapidly growing cryptocurrency market, estimated at $7.8 billion. Crypto outflows from Iranian exchanges surged as much as 873% above normal levels, with roughly $2.3 million leaving within an hour after airstrikes began, according to Chainalysis and Elliptic. Analysts suggest digital assets are being used both by citizens seeking financial security and potentially by government-linked entities to bypass sanctions, raising the risk of stricter global regulation.
- The U.S. Securities and Exchange Commission is urging ETF issuers to pause plans for highly leveraged funds, including proposals targeting up to 5x daily returns. Regulators warned these products may not comply with Rule 18f-4, which governs derivatives risk management. The leveraged ETF market has grown rapidly, with over 450 products launched since 2022 and roughly $150 billion in assets, highlighting potential regulatory risks for digital asset-linked investment products.
- Authorities in Singapore and Taiwan have identified more than $700 million in assets linked to an alleged global fraud and money-laundering network tied to Prince Holding Group. The scheme moved NT$10.7 billion ($337 million) through Taiwan between 2016 and 2025, while Singapore froze or seized roughly S$500 million ($391 million) in assets, and prosecutors previously seized about $1.5 billion in Bitcoin. These cases underscore how digital assets can be used for large-scale financial crime, increasing the risk of stricter regulatory scrutiny worldwide.
Defense and Cybersecurity
Strengths
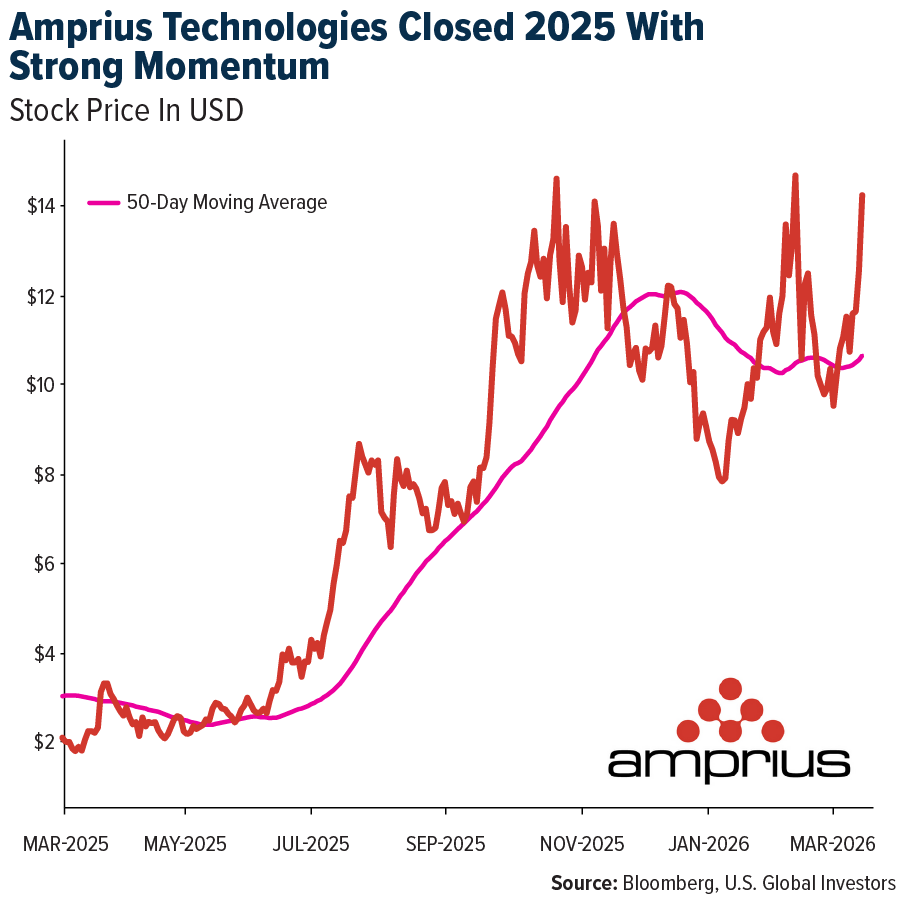
- Amprius Technologies closed 2025 with strong momentum, delivering over 200% full-year revenue growth and 137% year-over-year growth in the fourth quarter, alongside a sharp improvement in gross margin to 24%. The company expanded its customer base to more than 550 clients, secured major wins in drones, defense, and aerospace, and achieved its first positive quarterly adjusted EBITDA, highlighting operating leverage. With a clean balance sheet and guidance calling for at least 70% revenue growth to $125 million or more in 2026, Amprius is well positioned for continued profitable scaling.
- Broadcom’s AI semiconductor revenue more than doubled year-on-year to $8.4 billion in Q1 and is expected to reach $10.7 billion in Q2. Its AI networking revenue, which represents about one-third of the AI segment, is growing 60% year-on-year.
- During the current conflict, the United States used several new weapons systems in real combat for the first time, most notably Lockheed Martin’s Precision Strike Missile (PrSM), which CENTCOM confirmed was launched operationally with high effectiveness. The U.S. military also debuted the LUCAS one-way attack drone and employed advanced integrated air and missile defense systems, with commanders describing the results as highly successful and demonstrating a significant leap in long-range strike capability.
Weaknesses
- The conflict that erupted on Saturday has quickly expanded beyond a single region and is now affecting multiple areas globally. Active fighting spans the Middle East, Eastern Europe, South Asia, and parts of Africa, including conflicts involving Russia and Ukraine, Pakistan and Afghanistan, as well as various interconnected proxy disputes. More than 30 countries are now involved directly or indirectly, with most states engaged through military, economic, or strategic commitments, reflecting a high level of global coordination and escalation.
- The United States has updated semiconductor export rules, requiring a government license for the export of advanced AI chips. The new regulations give Washington oversight of most overseas shipments of high-performance chips from companies such as Nvidia and AMD, expanding existing export controls.
- Reports this week indicate that Iran’s retaliatory strikes affected several data centers across the Gulf, temporarily disrupting digital infrastructure in parts of the region. As a precaution, major tech companies, including Nvidia and Amazon, have temporarily closed or scaled back regional offices, with many employees continuing work remotely.
Opportunities
- Nvidia has announced a new $4 billion investment split between Coherent and Lumentum to advance silicon photonics, aiming to relieve interconnect bottlenecks and expand optical throughput for next-generation AI clusters.
- OpenAI is developing a code-hosting platform intended to compete with GitHub, aiming to reduce its dependency on Microsoft’s developer tools and potentially offer external services within months, signaling emerging platform competition in the developer ecosystem.
- Amazon is planning an €18 billion-plus investment in Spain’s Aragón region, increasing its commitment to €33.7 billion to expand data-center infrastructure and AI capabilities.
Threats
- President Zelenskyy has stated that Ukraine is prepared to deploy military experts and air defense specialists to the Middle East to assist in countering Iranian drones and missiles, drawing on Ukraine’s battlefield experience. The proposal would involve sending personnel abroad while Ukraine continues to experience missile and drone attacks and faces ongoing air defense capacity constraints.
- A protest near Palantir’s headquarters in the Miami area focused on the company’s role in U.S. national security. U.S. lawmakers are reviewing potential connections between the protest and a pro-China network reportedly funded by activist Neville Roy Singham, which could draw additional political and regulatory attention to Palantir’s government-focused business.
- Rising global oil prices amid ongoing conflicts have increased Russia’s budget revenues, enhancing its ability to finance military operations despite sanctions. Moscow has also increased the authorized size of its armed forces to nearly 2.4 million personnel, formalizing a larger military posture.
Gold Market
This week gold futures closed the week at $5,043.30, up $66.50 per ounce, or 1.34%. Gold stocks, as measured by the NYSE Arca Gold Miners Index, ended the week higher by 6.99%. The S&P/TSX Venture Index came in off 2.3%. The U.S. Trade-Weighted Dollar fell 0.74%.
Strengths
- The best-performing precious metal for the week was gold, up 1.34%. Despite escalating Middle East conflict, gold fell as the 10-year Treasury yield climbed 14 basis points, strengthening the dollar. Higher energy prices from the Iran conflict also reduced expectations for near-term Fed rate cuts, with the probability of a hold at the June meeting rising to 69% from 43% the prior week, removing a key tailwind for the metal.
- According to Intellinews, Turkey’s gold stock has climbed to more than $750 billion, nearly half the size of the country’s economy, driven by record global gold prices. Turks reportedly grew $300 billion wealthier over the past year as the value of their gold holdings surged.
- K92 Mining reported Q4 EPS of $0.36, beating the Scotia consensus of $0.33, driven by lower income taxes after adjusting for a one-time impairment and unrealized derivative losses, on pre-reported production of 47,200 oz AuEq. Full-year revenue rose to $595.2 million with net earnings of $270.2 million and a record net cash position of $181.6 million. The new 1.2 Mtpa Stage 3 process plant, commissioned in December under budget, has already exceeded feasibility study assumptions, with 2026 guidance of 190,000–225,000 oz AuEq representing another major step forward as new mining fronts come online.
Weaknesses
- The worst-performing precious metal for the week was palladium, down 2.19%. Platinum came under pressure as the Iran war drove investors toward cash and away from risk assets, with ETFs recording net sales. The Moscow Exchange’s launch of mini-futures on platinum and palladium—90% smaller than standard contracts—may spur additional speculative activity in an already volatile market, with PGM derivatives demand nearly doubling year-over-year in February.
- Gold sank after a four-day rally as traders weighed the escalating Middle East conflict against a stronger dollar and elevated inflation. Rising energy prices could feed into inflation data, increasing the likelihood that the Federal Reserve will keep rates unchanged for longer, which typically weighs on non-yielding bullion.
- Poland, the world’s largest central bank gold buyer in 2025, rattled markets after reports that Governor Glapiński proposed generating up to $13 billion from gold reserves to fund defense spending. While the plan relies on revaluing reserves rather than selling physical metal, the headline underscores how central bank actions can create short-term volatility.
Opportunities
- Silver is entering its eighth deficit year, with inventories at all-time lows and investment demand remaining strong. RBC expects the physical market to remain tight in the near term, projecting a gold/silver ratio of 60–65x over the next few years. Covered silver producers and precious metal royalty equities are pricing an average silver price of $122/ounce, above current spot levels of $90/ounce.
- Discovery Silver Corp. agreed to acquire Glencore Canada’s 100% interest in the Kidd operations in Timmins, Ontario, paying $10 million through the issuance of Discovery common shares.
- SSR Mining is selling its 80% stake in the Çöpler mine to Turkish conglomerate Cengiz Holding for $1.5 billion in cash, closing its most troubled asset and unlocking capital equivalent to over a quarter of its market cap. Combined with last year’s acquisition of Cripple Creek & Victor, the deal completes SSR’s strategic pivot to the Americas.
Threats
- Gold has largely been bypassed as a haven during today’s risk aversion, leaving it vulnerable to bearish drivers. A stronger dollar and higher government bond yields weigh on gold, which is a non-yielding asset.
- Gold may be one of the biggest pain trades of the Middle East conflict. SPDR Gold ETF positioning shows calls outnumbering puts nearly 2:1, and gold has lost 1.5% since the war began, reflecting its negative correlation with the dollar.
- Gold is on track for its first weekly decline in over a month, falling more than 3% before recovering half of the losses. Rising oil prices are pushing up yields and strengthening the dollar, while equity selloffs are forcing some investors to liquidate gold for liquidity, exposing it to risk-off flows.
A message from Advisor Perspectives and VettaFi: Discover something new! Click here to register for our upcoming webcasts.
U.S. Global Investors, Inc. is an investment adviser registered with the Securities and Exchange Commission (“SEC”). This does not mean that we are sponsored, recommended, or approved by the SEC, or that our abilities or qualifications in any respect have been passed upon by the SEC or any officer of the SEC.
This commentary should not be considered a solicitation or offering of any investment product. Certain materials in this commentary may contain dated information. The information provided was current at the time of publication. Some links above may be directed to third-party websites. U.S. Global Investors does not endorse all information supplied by these websites and is not responsible for their content. All opinions expressed and data provided are subject to change without notice. Some of these opinions may not be appropriate to every investor.
Holdings may change daily. Holdings are reported as of the most recent quarter-end. The following securities mentioned in the article were held by one or more accounts managed by U.S. Global Investors as of (12/31/2025):
Sabre Corp.
Japan Airlines Co. Ltd.
Qantas Airways
Prada
Kering
Hudbay Minerals
Arizona Sonoran Copper Company
K92 Mining
Discovery Silver
Palantir Technologies
*The above-mentioned indices are not total returns. These returns reflect simple appreciation only and do not reflect dividend reinvestment.
The Dow Jones Industrial Average is a price-weighted average of 30 blue chip stocks that are generally leaders in their industry. The S&P 500 Stock Index is a widely recognized capitalization-weighted index of 500 common stock prices in U.S. companies. The Nasdaq Composite Index is a capitalization-weighted index of all Nasdaq National Market and SmallCap stocks. The Russell 2000 Index® is a U.S. equity index measuring the performance of the 2,000 smallest companies in the Russell 3000®, a widely recognized small-cap index.
The Hang Seng Composite Index is a market capitalization-weighted index that comprises the top 200 companies listed on Stock Exchange of Hong Kong, based on average market cap for the 12 months. The Taiwan Stock Exchange Index is a capitalization-weighted index of all listed common shares traded on the Taiwan Stock Exchange. The Korea Stock Price Index is a capitalization-weighted index of all common shares and preferred shares on the Korean Stock Exchanges.
The Philadelphia Stock Exchange Gold and Silver Index (XAU) is a capitalization-weighted index that includes the leading companies involved in the mining of gold and silver. The U.S. Trade Weighted Dollar Index provides a general indication of the international value of the U.S. dollar. The S&P/TSX Canadian Gold Capped Sector Index is a modified capitalization-weighted index, whose equity weights are capped 25 percent and index constituents are derived from a subset stock pool of S&P/TSX Composite Index stocks. The NYSE Arca Gold Miners Index is a modified market capitalization weighted index comprised of publicly traded companies involved primarily in the mining for gold and silver. The S&P/TSX Venture Composite Index is a broad market indicator for the Canadian venture capital market. The index is market capitalization weighted and, at its inception, included 531 companies. A quarterly revision process is used to remove companies that comprise less than 0.05% of the weight of the index, and add companies whose weight, when included, will be greater than 0.05% of the index.
The S&P 500 Energy Index is a capitalization-weighted index that tracks the companies in the energy sector as a subset of the S&P 500. The S&P 500 Materials Index is a capitalization-weighted index that tracks the companies in the material sector as a subset of the S&P 500. The S&P 500 Financials Index is a capitalization-weighted index. The index was developed with a base level of 10 for the 1941-43 base period. The S&P 500 Industrials Index is a Materials Index is a capitalization-weighted index that tracks the companies in the industrial sector as a subset of the S&P 500. The S&P 500 Consumer Discretionary Index is a capitalization-weighted index that tracks the companies in the consumer discretionary sector as a subset of the S&P 500. The S&P 500 Information Technology Index is a capitalization-weighted index that tracks the companies in the information technology sector as a subset of the S&P 500. The S&P 500 Consumer Staples Index is a Materials Index is a capitalization-weighted index that tracks the companies in the consumer staples sector as a subset of the S&P 500. The S&P 500 Utilities Index is a capitalization-weighted index that tracks the companies in the utilities sector as a subset of the S&P 500. The S&P 500 Healthcare Index is a capitalization-weighted index that tracks the companies in the healthcare sector as a subset of the S&P 500. The S&P 500 Telecom Index is a Materials Index is a capitalization-weighted index that tracks the companies in the telecom sector as a subset of the S&P 500.
The Consumer Price Index (CPI) is one of the most widely recognized price measures for tracking the price of a market basket of goods and services purchased by individuals. The weights of components are based on consumer spending patterns. The Purchasing Manager’s Index is an indicator of the economic health of the manufacturing sector. The PMI index is based on five major indicators: new orders, inventory levels, production, supplier deliveries and the employment environment. Gross domestic product (GDP) is the monetary value of all the finished goods and services produced within a country’s borders in a specific time period, though GDP is usually calculated on an annual basis. It includes all private and public consumption, government outlays, investments and exports less imports that occur within a defined territory.
The S&P Global Luxury Index is comprised of 80 of the largest publicly traded companies engaged in the production or distribution of luxury goods or the provision of luxury services that meet specific investibility requirements.
Membership required
Membership is now required to use this feature. To learn more:
View Membership BenefitsSponsored Content
Upcoming Virtual Events View All


