In this article, Russ Koesterich notes the year-to-date strength of both cyclical and defensive stocks, a pairing that seems too strange to last.
Key takeaways
- Investors are rotating away from tech and into cyclical and defensive sectors like energy, materials, industrials, staples and utilities – all of which are outperforming their high-flying tech peers year-to-date.
- The knock-on effect of this trade can also be seen among style factors, with value easily outperforming both growth and quality over the same time period. Interestingly, earnings momentum for tech stocks in particular remains largely unchanged.
- While current economic data supports staying invested in cyclicals, Russ recommends keeping an eye on these indicators, specifically labor market trends.
Those of us over 40 or 50 can probably still sing, at least in our heads, some of the songs from Sesame Street. One Sesame Street jingle that describes this year’s financial markets: “One of these things is not like the other, one of these things doesn’t belong’’. That is an apt description of year-to-date performance. After +3 years of tech dominance, markets are betting on a strange combination of cyclical and defensive stocks. One of these bets is probably wrong.
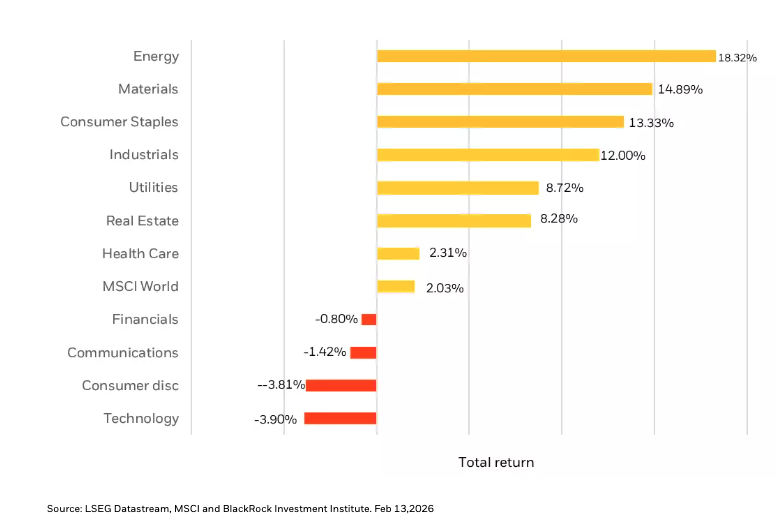
Year-to-date the best performing global sectors are mostly traditional cyclicals, such as energy, materials, and industrials (see Chart 1). To the extent fiscal stimulus and the impact of previous rate cuts translates into a strong economy, this makes sense. However, in addition to cyclical sectors, many traditional defensive ones, notably staples and utilities, are also outperforming. This part is harder to explain.
Global Sector Performance - year to date

Note: The bars show performance in U.S. – dollar terms year to date.
The odd pairing of riskier cyclicals and safer defensives also extends to style performance. Value is by far the best performing sector year-to-date, easily beating both growth and quality. A value rally is consistent with an optimistic economic narrative, as stronger growth results in operating leverage for non-growth companies. What is harder to reconcile is that low volatility, a strategy that generally works best in recessions, is also doing relatively well. That is not what you’d expect in an environment in which investors keep raising their economic expectations.
It's not earnings
Adding to the puzzle, relative performance does not appear particularly tied to changes in earnings expectations. Technology companies continue to enjoy the fastest earnings momentum. While many of the outperforming sectors, notably industrials, are experiencing negative changes to their 12-month earnings estimates.
What is going on? The simplest explanation is a swift rotation out of technology and AI related trades. Except for parts of the semiconductor industry, most of technology is underperforming, with software down more than -20% year-to-date.
With investors still in a buoyant mood, the money must go somewhere. Given the huge weight of technology stocks, roughly 33% of the S&P 500, the money coming out of tech and AI related names can fund a lot of buying in smaller companies and less dominant industries.
Jobs Data is probably the key
Going forward, how should investors think about this odd couple? My view is that the preponderance of evidence suggests sticking with the cyclical trade. The January non-farm payroll report was solid, manufacturing surveys are accelerating, economic surprise indices are at the best level in more than two years and earnings momentum favors select cyclical companies, notably materials, financials and semis. Should the labor market stumble, everything would arguably change as a weaker economy would undermine the appeal of cyclicals. But absent evidence of a sharp slowdown in labor markets, the recent pairing of highly cyclical and very defensive companies looks too strange to last.
A message from Advisor Perspectives and VettaFi: Discover something new! Click here to register for our upcoming webcasts.
To obtain more information on the fund(s) including the Morningstar time period ratings and standardized average annual total returns as of the most recent calendar quarter and current month end, please click on the fund tile.
The Morningstar RatingTM for funds, or "star rating", is calculated for managed products (including mutual funds, variable annuity and variable life subaccounts, exchange-traded funds, closed-end funds, and separate accounts) with at least a three-year history. Exchange-traded funds and open-ended mutual funds are considered a single population for comparative purposes. It is calculated based on a Morningstar Risk-Adjusted Return measure (excluding any applicable sales charges) that accounts for variation in a managed product's monthly excess performance, placing more emphasis on downward variations and rewarding consistent performance. The top 10% of products in each product category receive 5 stars, the next 22.5% receive 4 stars, the next 35% receive 3 stars, the next 22.5% receive 2 stars, and the bottom 10% receive 1 star. The Overall Morningstar Rating for a managed product is derived from a weighted average of the performance figures associated with its three-, five-, and 10-year 60-119 months of total returns, and 50% 10-year rating/30% five-year rating/20% three-year rating for 120 or more months of total returns. While the 10-year overall star rating formula seems to give the most weight to the 10-year period, the most recent three-year period actually has the greatest impact because it is included in all three rating periods.
Russ Koesterich, CFA, is a Portfolio Manager for BlackRock's Global Allocation Fund and Lead Portfolio Manager for BlackRock’s Global Allocation (GA) Selects Model Portfolios and is a regular contributor to Market Insights.
Carefully consider the Funds' investment objectives, risk factors, and charges and expenses before investing. This and other information can be found in the Funds' prospectuses or, if available, the summary prospectuses, which may be obtained by visiting the iShares Fund and BlackRock Fund prospectus pages. Read the prospectus carefully before investing.
Investing involves risks, including possible loss of principal.
Investments in technology industries may be affected by limited product lines, markets or financial resources. Technology industries are rapidly changing and stocks of these companies may be more volatile than the stock market in general.
Funds that concentrate investments in specific industries, sectors, markets or asset classes may underperform or be more volatile than other industries, sectors, markets or asset classes and than the general securities market.
There can be no assurance that performance will be enhanced or risk will be reduced for funds that seek to provide exposure to certain quantitative investment characteristics ("factors"). Exposure to such investment factors may detract from performance in some market environments, perhaps for extended periods. In such circumstances, a fund may seek to maintain exposure to the targeted investment factors and not adjust to target different factors, which could result in losses.
The Fund is actively managed and does not seek to replicate the performance of a specified index, may have higher portfolio turnover, and may charge higher fees than index funds due to increased trading and research expenses. There is no guarantee the fund will meet its investment objective.
Fixed income risks include interest-rate and credit risk. Typically, when interest rates rise, there is a corresponding decline in the value of debt securities. Credit risk refers to the possibility that the debt issuer will not be able to make principal and interest payments.
Non-investment-grade debt securities (high-yield/junk bonds) may be subject to greater market fluctuations, risk of default or loss of income and principal than higher-rated securities.
There may be less information on the financial condition of municipal issuers than for public corporations. The market for municipal bonds may be less liquid than for taxable bonds. Some investors may be subject to federal or state income taxes or the Alternative Minimum Tax (AMT). Capital gains distributions, if any, are taxable.
This material is not intended to be relied upon as a forecast, research or investment advice, and is not a recommendation, offer or solicitation to buy or sell any securities or to adopt any investment strategy. The opinions expressed are as of March 2026 and may change as subsequent conditions vary. The information and opinions contained in this post are derived from proprietary and nonproprietary sources deemed by BlackRock to be reliable, are not necessarily all-inclusive and are not guaranteed as to accuracy. As such, no warranty of accuracy or reliability is given and no responsibility arising in any other way for errors and omissions (including responsibility to any person by reason of negligence) is accepted by BlackRock, its officers, employees or agents. This post may contain “forward-looking” information that is not purely historical in nature. Such information may include, among other things, projections and forecasts. There is no guarantee that any forecasts made will come to pass. Reliance upon information in this post is at the sole discretion of the reader.
Past performance is no guarantee of future results. Index performance is shown for illustrative purposes only. You cannot invest directly in an index.
Prepared by BlackRock Investments, LLC, member FINRA.
©2026 BlackRock, Inc. or its affiliates. All rights reserved. BLACKROCK is a trademark of BlackRock, Inc. or its affiliates. All other trademarks are those of their respective owners.
FFI0326-5276059-EXP0327
© BlackRock
Read more commentaries by BlackRock