Summary: Comparing business-cycle-related primary trends of the falling 2-year Treasury yield shows that this is the slowest business cycle since WWII (WWII is a rough place where Treasury yield data and an independent Fed began). In general, business cycles were sharper and faster prior to WWII because fewer fiscal and monetary policies were used to counteract them. I argue the slowness of this cycle is evidence of the 6+% average pro-cyclical fiscal deficit over the last three and a half years. Pro-cyclical peacetime deficits have slowed previous business cycles down (1990, 2018-2020) and happening again now. Despite President Trump’s attacks on the Fed suggesting Jerome Powell should be cutting faster, the Fed is cutting rates slowly in this cycle because the economic data won’t allow them to cut any faster. Five concise sections and six charts to show it:
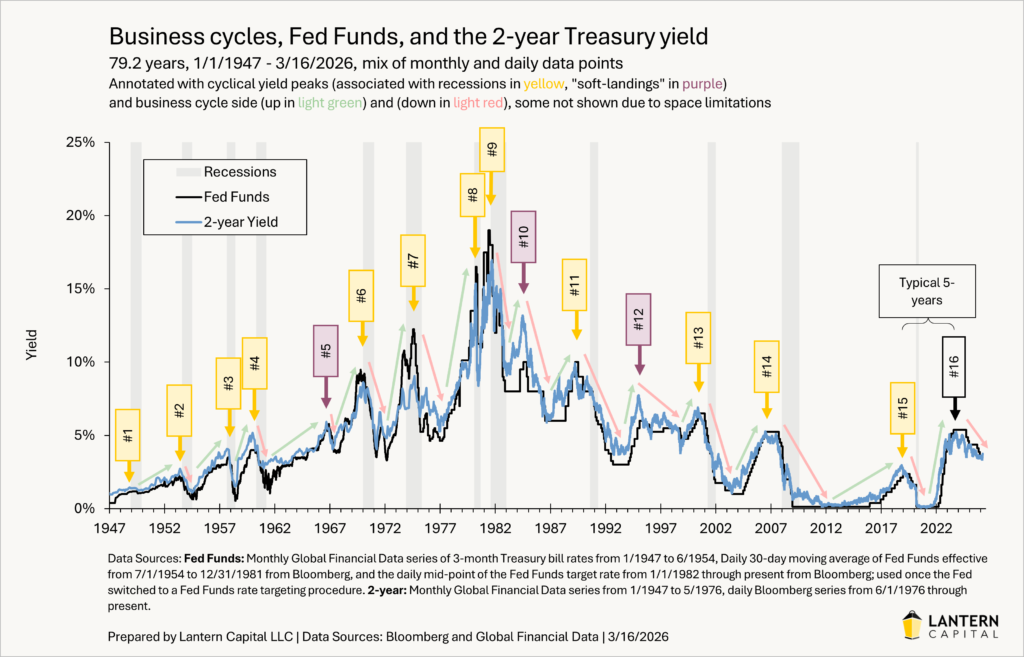
1. Segmenting the business cycle The business cycle is typically broken into recession, recovery, and expansion segments. This is often further reduced to just two states: recession and expansion (combining recovery and expansion). Doing it this way shows most of history in expansion and just a sliver of the time in recession (14% since 1950, gray vertical bars in the chart below). But a more logical and realistic way to segment the business cycle is to divide it into primary trends of the 2-year Treasury which are well correlated to movements in the Fed Funds rate and cyclical components of the economy. When Treasury yields are rising, the Fed is raising rates, and yield curve is flattening is the upside of the business cycle (e.g., 2021 – 2023). When Treasury yields are falling, the Fed is lowering rates, and the yield curve is steepening, is the downside of the business cycle (e.g., 10/2023-now). Segmenting the business cycle this way makes opposing sides more even in length (more realistic), includes the relevant negative economic period before, during, and after recessions on the downside, and includes soft-landing periods which come in between long periods of expansion, have a Fed cutting cycle, aren’t severe enough to be called a recession, but often have a profound effect on Treasury yields. The US 2-year, Fed Funds, and business cycle is likely the most well-organized, durable, and investable repeating pattern in finance and a big reason why Lantern focuses on it. See chart below. Specific dates, amounts, and interval lengths are in a table here.

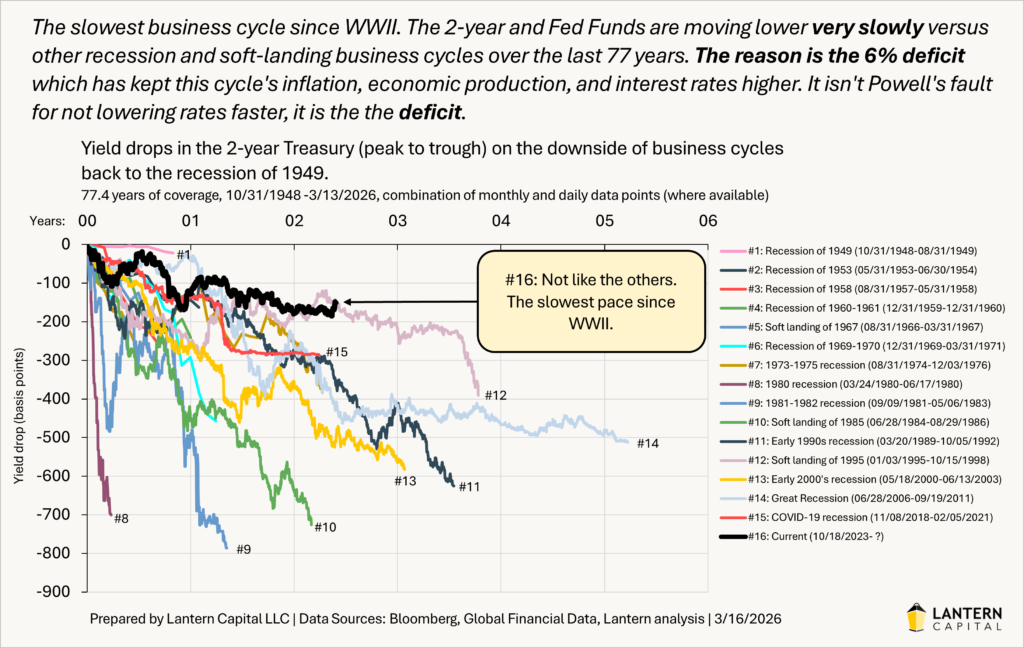
2. Comparing business cycle paces The drop in the 2-year yield during each light red arrow in the chart above can be overlayed to compare relative business cycle paces (chart below). Quicker and deeper drops accompany more severe business cycles and slower and shallower drops accompany the opposite. This is because the Fed typically cuts rates commensurately with economic deterioration. These yield fall paces often have more practical meaning than do GDP drawdown amounts in describing the severity of each downside of the business cycle. The current cycle is the slowest back to 1948! (thick black line in chart below), an incredible result that explains a lot. As I detailed in last December’s prescient “The 6% deficit, post-lore economy”, this cycle has miraculously recovered from five recession scares which typically would’ve started the negative reinforcement cycle of a recession. This cycle has been buoyant as seen through Treasury yields, but also with risk-on assets (e.g., S&P 500) continuing to make new all-time highs every few months.
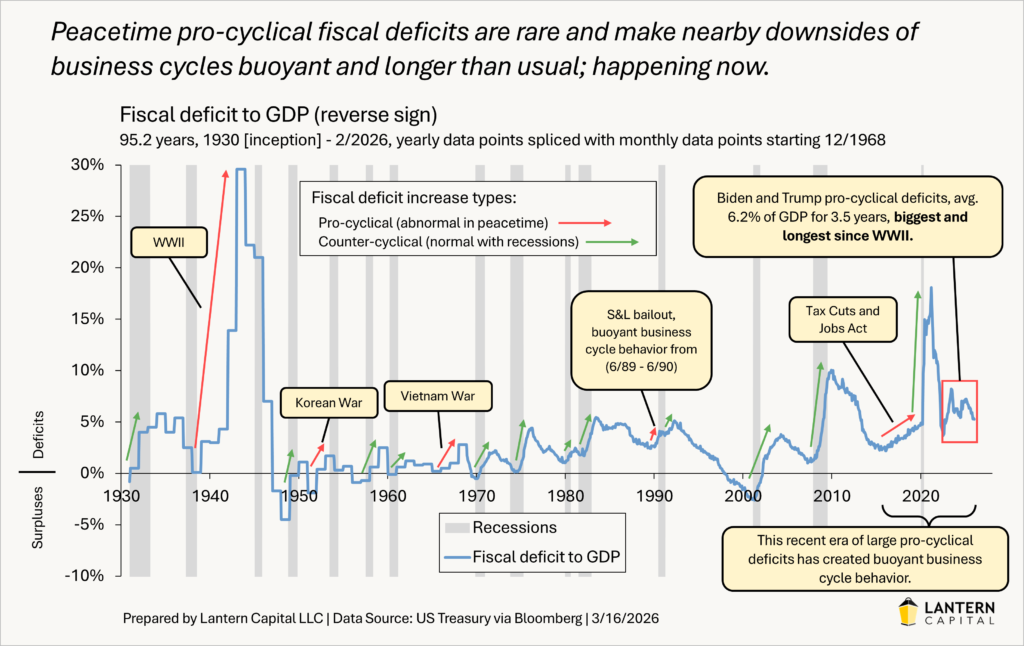
3. The deficit is why this cycle is so slow There is one clear reason that differentiates this downside of the business cycle from all those before it. It isn’t AI, it isn’t fiscal concerns, it isn’t pre-emptive Fed cutting, it is that the government has sustained the largest peacetime pro-cyclical deficit ever over the last 3.5 years. Fiscal deficits are economically stimulative. The only other two times with a significant pro-cyclical deficit in peacetime, 1989-1990 and 2018-2020, also exhibited buoyant business cycle behavior, which makes logical sense. A recession looked imminent in June of 1989 with Treasury yields falling and economic data deteriorating, yet the economy recovered in the second half of 1989 after Treasury yields fell and the Fed cut rates. A recession didn’t begin until July of 1990; after one year of business cycle “purgatory”. In 2018-2020, several indicators (yield curve inversion, drop in LDEI), looked like a recession was approaching. But it approached so slowly that by the time COVID-19 hit in February of 2020, the unemployment rate had yet to rise; evidence of how tame and slow that downside of the business cycle was until the pandemic arrived. That period had a rising fiscal deficit from the “Tax Cuts and Jobs Act” (upward sloping red arrow a little before 2020 in the chart below).
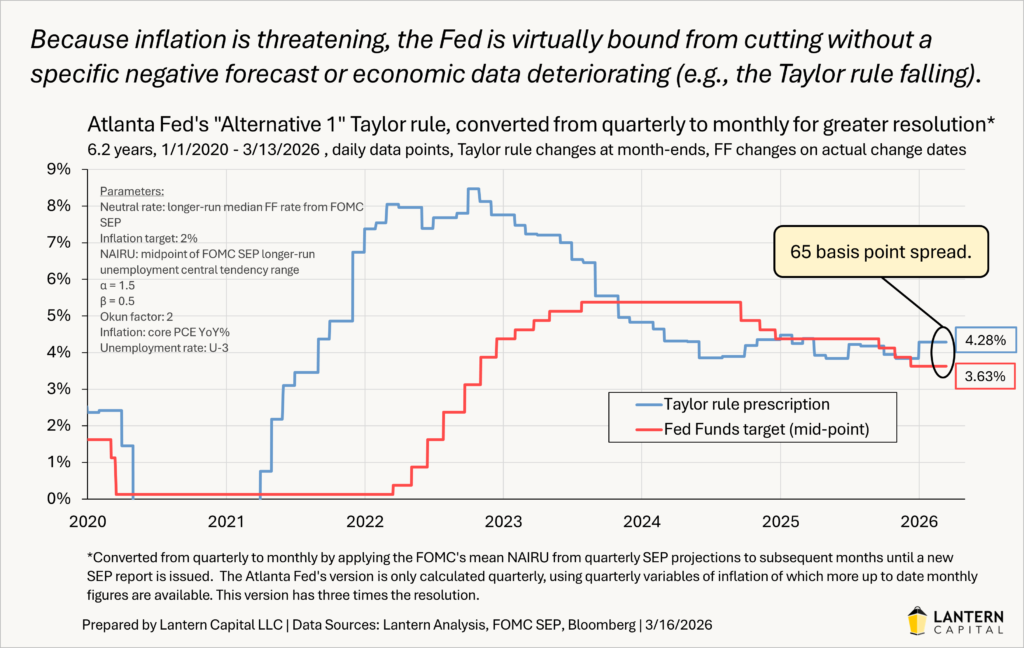
4. Why can’t Powell cut like Greenspan? Through a distorted lens, the slow pace of Fed cutting can appear like the Fed is the reason why rates aren’t being cut as fast as other rate cutting cycles — the accusation of the Trump Administration. President Trump recently lamented that he wanted a Fed Chair that would cut rates quickly like Alan Greenspan used to. Greenspan was Fed Chair for cycles 11, 12, and 13 above. The reason why the Fed hasn’t cut faster is because the economic data hasn’t allowed them to. This can be seen with the Taylor rule, a linear formula that takes unemployment rate and inflation inputs to provide a prescription for where Fed Funds should be. I use the Atlanta Fed’s “Alternative 1” Taylor rule (converted to monthly) because it was referenced by Federal Reserve Governor Christopher Waller in late 2023 as a reason to cut rates soon, seems to indicate why the Fed stopped cutting rates in 2024 and 2025, and is the most modern version of the Taylor rule with dynamic variables for NAIRU (full employment) and r* (neutral rate) derived from the FOMC’s quarterly summary of economic projections (SEP).
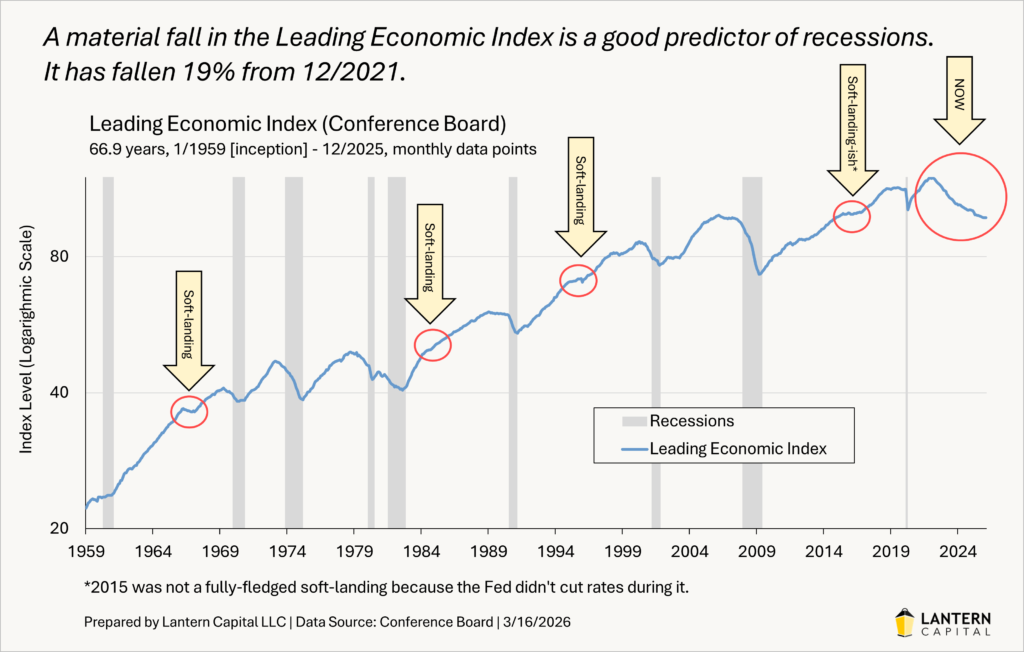
5. Where is the business cycle headed? With this downside of the business cycle’s 2-year Treasury yield drop being similar to the pace of the soft landing of 1995, one could reasonably conclude that this cycle will result in a soft-landing, not a recession. I doubt it for three reasons. The first is what I call the “recession trifecta” has occurred with a yield curve inversion, Sahm rule trigger (unemployment rate rising), and the Conference Board’s Leading Economic Index falling more than 2% from its peak. When all three of these happened historically, a recession occurred 100% of the time. Moreover, soft landings have a signature mild look in charts with zero to one of these recession trifecta indicators triggering (see chart below). This cycle does not resemble past soft-landings.
The second reason is the stock market’s long-running and clear P/E cycle (don’t be surprised if you haven’t heard of this before, Wall Street would rather you not know) is unquestionably near to its end. When this economic expansion ends, the 17+ year expanding P/E cycle will likely end too. While this P/E cycle transition hasn’t always been associated with a recession historically (i.e., 1966), CAPE ratios this high usually correct down dramatically (1929, 2000) and to the extent that stock market gains are supporting consumer spending, a reversal will impact economic growth (the so-called wealth effect), making a recession more likely.
The third reason is that economic excesses haven’t been cleared in a while. The COVID-19 recession was the first recession since the Great Recession 11 years before it, and the COVID-19 recession was quickly eliminated by enormous monetary and fiscal stimulus combined with the pandemic being milder than feared. The business cycle has a helpful analogy with the life cycle of the forest. Over time, branches (economic excesses) accumulate on the forest floor. Upon a spark, when the forest is dense with flammable material, a fire can quickly spread from one tree to all of them (an economy-wide recession). Because a fire hasn’t fully burned since 2008, a downturn/recession will have more unspent flammable material to consume, making a recession more likely than a soft-landing.
While I think a recession will eventually come in this cycle, I don’t expect it imminently. I continue to expect interest rates will rise until they’ve risen enough to constrict the economy again, starting another leg down of the “post-lore economy” cycle within a cycle. I don’t expect the Iran War to cause a recession because it can be de-escalated easier since the US and Israel are the aggressors, the US has much more energy security now, and the underlying economy looks strong (LDEI). In 1990, the economy faltered with data released starting in early May 1990, three months ahead of when Iraq invaded Kuwait (August 2, 1990). The 1990 recession and first Gulf War are less linked than commonly thought, despite being contemporaneous.
Conclusion: The business cycle comparison raised in this analysis (chart under heading 2), helps to argue that the deficit is the reason for this slow business cycle since they occupy the same period, have a similar magnitude, and the relationship is patently logical. I hope that more people come to acknowledge this as it connects many dots, dissuades from false conclusions being drawn, and is an argument for the Fed to use (albeit thorny) to help defend why they have cut slowly this cycle. In a sense, the reason why rates aren’t lower is because of what the Biden and Trump Administrations have done with fiscal policy. High fiscal deficits are set to continue indefinitely with a 5.8% fiscal deficit to GDP expected in 2026 (CBO).
A message from Advisor Perspectives and VettaFi: Discover something new! Click here to register for our upcoming webcasts.
© Lantern Capital
Read more commentaries by Lantern Capital