Growth Equity Portfolio First Quarter Review
Membership required
Membership is now required to use this feature. To learn more:
View Membership Benefits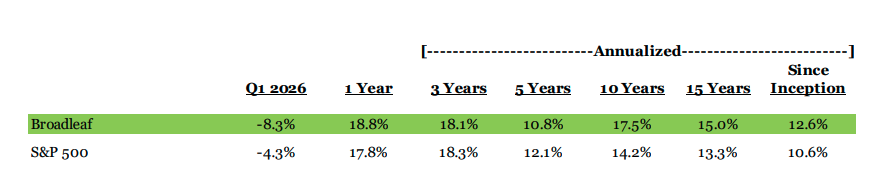
Fund Inception 8/18/05. Portfolio performance reflects Broadleaf’s Growth Equity Composite, described more fully under the caption “Performance Disclosures.” You are urged to read that information in its entirety in connection with any evaluation of Broadleaf’s performance statistics. All figures are shown net of actual fees. Any assumed fees have been calculated on a pro forma basis, reflecting the highest fee levels that Broadleaf would charge clients per our disclosures in Part II of our Form ADV.
Performance Commentary
It was a rough first quarter for the Broadleaf Growth Equity Portfolio and the markets in general as investors tried to identify market leadership buffeted by AI spending concerns, talk of escalating private credit market risks, and ultimately, the emergence of War in Iran. While our numbers are generally in line with or better than those of the S&P 500 over most periods of time, the persistence of shifting leadership over the last five years has made this particular time period a difficult benchmark to beat.
Market Review and Outloo
The Broadleaf Growth Equity Portfolio has existed for eighty-two quarters and the S&P 500 much longer. Over this time, the BGEP has had down quarters twenty-two times and the S&P 500 twenty times. 25% of all quarters have experienced declines since we’ve been in business. Following these negative quarters, the markets have rebounded 70% of the time the very next quarter, often with a greater bounce than the decline.
When the markets have declined two or more quarters in a row – the other 30% of the time in the last twenty years – it’s been clustered around more significant macro events. The housing crisis saw five negative quarters in a row, and the inflation scare of 2022, three quarters in a row. If we multiply the probability of a quarterly decline by consecutive declines, it would appear that in the last twenty years, the probability of more severe outcomes is 7.5%.
What does the pathway show negative calendar years? Both the BGEP and S&P500 had negative years three times in the last twenty years or fifteen percent of the time. After these down years, the markets bounced the following year, and often, more than they declined in the prior year.
To be fair, if you are down 50% in one year, you must be up 100% the next year to breakeven, so compounding is a factor. One of the three annual declines proved to be noise for both the BGEP and the S&P 500, but in the other two, investors would have broken even in 2-3 years, assuming you bought at the peak and made no further investments.
While the past two decades suggest a breakeven period in as little as three years, we always recommend a horizon of at least five years if you are going to invest in the BGEP or equities in general. One way to breakeven faster is to continue to dollar cost average into the weakness, buying the dips as your cash flow allows. This year is also a midterm election year, by the way, where the average intra-year decline has been 19%, compared to the average of 15% for all years.
Irrespective of the circumstances - and market declines all have their reasons - drawdowns happen. We should be careful not to minimize the current situation, while also recognizing that the recoveries have been just as real. Living in the tension of two truths like this is a skill worth honing in our polarized world.
So, what were the contributors to the first quarter decline? We’d propose three. War in Iran, private credit, and AI investor fatigue. Last year also had its share of market swoons, brought about by tariffs, Liberation Day and changing immigration policies. Resilience has been a recurring theme in a politically volatile headline environment. In spite of those headlines last year, the market enjoyed its third straight year of double digit gains!
With respect to the War, we’ve always viewed geopolitics as binary events that are risky when it comes to investment timing. Trump could exit this conflict as quickly as he entered it – reversing the recent declines as quickly as they occurred. We just don’t know. In such fluid environments, it’s even hard to put our thoughts into writing as before the ink dries the news flow could change, which is why this update has been a tad slower to publish than most.
One thing we do know is that Trump has shown a willingness to change his views, as evidenced by his TACO moniker, Trump Always Chickens Out. Whether this is a lack of courage or a willingness to change his mind with new circumstances we’ll leave for the reader to decide. It appears he does listen to the markets – a balance of power that perhaps our founding forefathers hadn’t considered.
Opening the Strait of Hormuz might be crucial to avoiding longer term economic effects for investors, particularly with respect to commodity inflation. But if the tariff turmoil of the past year suggests anything, it’s that capitalists always find a way to bend and flex with the environment to supply valuable goods to those who are interested in buying. At some point, the valuable oil sitting in ships in the Strait will find its way to the markets that want it.
With respect to the private credit markets, a few higher profile blowups – loans funded outside the traditional banking system – have caused leaders like JP Morgan’s Jamie Dimon to wonder if there are similar canaries in the coal mine. Since the Credit Cycle is indeed one of the key factors we believe influences near-term value in the markets, we aren’t quick to dismiss such concerns. At the same time, we are not experts on private credit. We have had conversations with those who are, however, in some of our independent board activities. These experts believe these are isolated events and typical credit cycle dynamics rather than systemic in nature. Fortunately, most banking analysts don’t believe troubles in private credit pose a risk of a run on the banks. As always, time will tell.
As a firm, we’ve long believed investors underestimate the value of liquidity in exchange for the absence of market-based pricing volatility -- i.e. non-correlated returns – across the private markets. Growing redemption requests in the space may reflect this lack of understanding today.
The final contributor to weakness may be “AI fatigue”, a term economist Ed Yardeni coined in the fourth quarter of 2025 to describe growing investor exhaustion within the space, particularly the Magnificent Seven cohort. This AI fatigue morphed into a Disruption Virus in the first quarter, with the technology decimating valuations across the software sector. Disruption concerns have also stressed some areas of the labor market, particularly for white collar workers in the tech space. At this point, the layoffs appear positioned as a way to fund capital expenditures promising future productivity.
Like geopolitics, AI fatigue and the Disruption Virus feel binary and may be subject to reversal. Hyperscalers are going all out in their commitments to further investment, while investors struggle with whether these investments will provide adequate returns. At the same time, while investors question the risks of this spending they have no problem bidding up valuations of those sectors benefiting from it. The wide swath of economic beneficiaries of such spending is immense and broad based – across the energy, tech hardware, industrial and financial sectors. The influence of AI related spending is so immense that we’re not quite sure GDP would be growing much at all in its absence.
On the one hand, if the spending by hyperscalers doesn’t generate adequate returns, we aren’t convinced they will keep spending. And if that’s the case, then the sustainability of gains by the spending beneficiaries will be called into question, along with the Disruption Virus currently plaguing the software sector. On the other hand, if we witness an acceleration in revenue and earnings gains for the hyperscalers from their investments, then the Mag 7 AI fatigue may be unjustified. Can investors truly have it both ways? We’re not so sure.
At this point, the spending is full steam ahead. When and if there will be a hiccup is apparently a concern for another day. We believe the fundamentals will remain strong for not only the spending beneficiaries, but ultimately those doing the spending. It is also conceivable that investors in private companies – i.e. the LLM complex - are subsidizing losses that the ultimate beneficiaries of artificial technology – the end users – are not adequately paying for today. OpenAI’s rationing of compute resources with activities like shutting down SORA may hint at this risk lurking beneath the surface of apparent good news of ever higher funding rounds.
After three consecutive years of double-digit returns, we’ve gone from an environment where everything has seemed to work in asset class land to one in which many areas are being called into question. Investors have learned that it is important to stay engaged with the markets in some way, shape or form, and at least so far, that appears to be what is happening, with rotational dynamics being more pronounced than the outright desire to raise cash. As we said earlier, seekers of alpha are scouring the market for hints of leadership in an environment constantly buffered by opposing clues.
Every morning, Pete and I go through our batting practice. And every day, we consider a potential trade or two. But in the face of so many binary paths – to war or not to war, to spend or not to spend, we lack the necessary conviction to put our thoughts into action.
So, we wait.
Historically, that isn’t always a bad idea.
Portfolio Characteristics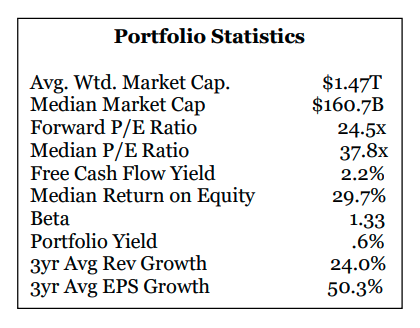
Investment Style
The Broadleaf Growth Equity Portfolio employs a concentrated growth style of investing, holding approximately 25-35 equity positions from a cross section of economic sectors. Morningstar would classify us as a large cap growth manager, but we will invest in select small and midsize companies as unique opportunities avail themselves. Sector exposures are strongly influenced by our views on three determinants of investment value, which we define as the economic cycle, the innovation cycle, and the credit cycle. Individual securities are ultimately selected on the basis of their long-term growth potential, profitability, and intrinsic value as measured by their free cash flow generating characteristics. Innovative ideas and themes are of particular interest.
Investment Objective
The portfolio’s goal is to provide equity-like returns and to outperform the S&P 500 over a three to five-year time horizon or full market cycle, utilizing a growth-oriented investment style. The portfolio is suitable for investors seeking exposure to a concentrated investment style which may be more volatile than the market as a whole. Investors should consider it as a portion of their investment portfolio within the context of their overall asset allocation and related investment goals.
Performance Disclosures
Results reflect the actual performance of Broadleaf’s Growth Equity Composite. Performance data is shown net of advisory fees and trading costs. Broadleaf may charge different advisory fees to clients based on several factors but primarily based on the size of a client’s account. Broadleaf’s basic fee schedule is available on its Form ADV, Part II. Results reflect the reinvestment of dividends and distributions, if any. Leverage has not been utilized. The U.S. Dollar is the currency used to express performance.
Broadleaf’s growth Equity Composite includes all fully discretionary accounts utilizing our growth equity style of investing with a minimum initial account size of $250,000. (From firm inception to 6/30/2009 our minimum account size for composite inclusion was $250,000 and from 6/30/2009 to 6/30/2013, the minimum had been $100,000. Historical results have not been updated retroactively to reflect changes in account minimums but are reflected on a going forward basis.) To be included in the composite, an account must have been under management for at least one full quarter. If a significant cash flow in an underlying composite account during the quarter causes it to deviate from our intended growth style, we will remove the account for the period in which the significant cash event occurred. A significant cash flow is currently defined as 10% or more.
Total firm assets at quarter end were $524 million. Prior to January 5th, 2006 the firm did not have any investment advisory clients. As a result, composite data prior to March 31st, 2006 only reflects the performance of Doug MacKay’s personal retirement account.
The S&P 500 Index has been used for comparative benchmark purposes because the goal of the stated strategy is to provide equity-like returns and to outperform the S&P 500 over a three to five-year time horizon or full market cycle. The S&P 500 is a broad-based index reflecting the performance of the equity market in general. The S&P 500 Index is based on total returns which includes dividends. We monitor the performance of our growth style of investing by comparing our results to those of other large cap growth peers. While we believe these are appropriate benchmarks to use for comparison purposes, it should be expected that the volatility of the Broadleaf Growth Equity Portfolio may be higher due to its concentrated nature.
Performance information since inception reflects actual performance of the composite over a period of greater than fifteen years. You are cautioned that information concerning comparative performance over this period of time may bear no relationship whatsoever to performance over other time periods. This information should not be regarded as in any way representing the likely future performance of the portfolio in absolute terms or in comparison to the indices. Investment in securities, including mutual funds, involves risk of loss. Past performance is no guarantee of future returns.
Portfolio attributes such as yield are presented to provide insight into the composition or profile of the portfolio and its underlying assets. These attributes are not intended to be measures of actual or future performance or income. Unless otherwise indicated, attributes are shown gross of advisory fees and expenses. The overall impact of fees and expenses is best reflected in the portfolio’s gross and net performance results.
Broadleaf Partners, LLC is a registered investment advisor with the Securities and Exchange Commission. The firm maintains a complete list and description of composites, which is available upon request.
Performance information contained in this document including any reference to the purchase or sale of a security, or a strategy, is not intended to constitute personalized investment advice. Personalized investment advice is always dependent on individual factors, involves risk and is not a guarantee that any investment will produce favorable results.
For Additional Information Contact
Doug MacKay, CFA CEO & Chief Investment Officer (O) 330.650.0921 [email protected]
Bill Hoover President & COO (O) 330.650.0921 [email protected]
A message from Advisor Perspectives and VettaFi: Discover something new! Click here to register for our upcoming webcasts.
Membership required
Membership is now required to use this feature. To learn more:
View Membership BenefitsSponsored Content
Upcoming Virtual Events View All


