Key takeaways:
- Liquidity in corporate bonds has strengthened as market structure has evolved, with data showing deeper trading, broader participation, and reduced transaction costs.
- Bank bond holdings have become a less effective gauge after a change to how they are calculated and as liquidity becomes more network‑based.
- When comparing liquidity, it’s essential to make clear distinctions between public markets, private placements, and true private credit.
Liquidity has moved to the center of investing conversations in recent months. Corporate direct lending, a subset of private credit, has drawn scrutiny as investment vehicles often promise monthly or quarterly liquidity while owning assets that are, in practice, difficult to exit. Headlines about redemption limits in private credit funds underscore that this is no longer a theoretical risk.
Against that backdrop, there has been a persistent and parallel debate about liquidity in public credit markets, where corporate bonds are bought and sold. Critics – often managers touting private credit – have argued that primary dealer banks hold fewer corporate bonds than they once did, and that trading is concentrated within a subset of newer bonds. Supporters counter that advances in trading technology and market structure continue to improve liquidity.
The data strongly support the latter view. Across multiple, complementary measures of depth, breadth, and transaction costs, public corporate bond markets appear healthier today than at any point since the global financial crisis (GFC).
Using the right yardsticks
There is no single definition of market liquidity, but it is commonly understood as the ability to buy or sell an asset quickly, in size, and at prices reflecting fundamental values. There are three main components:
-
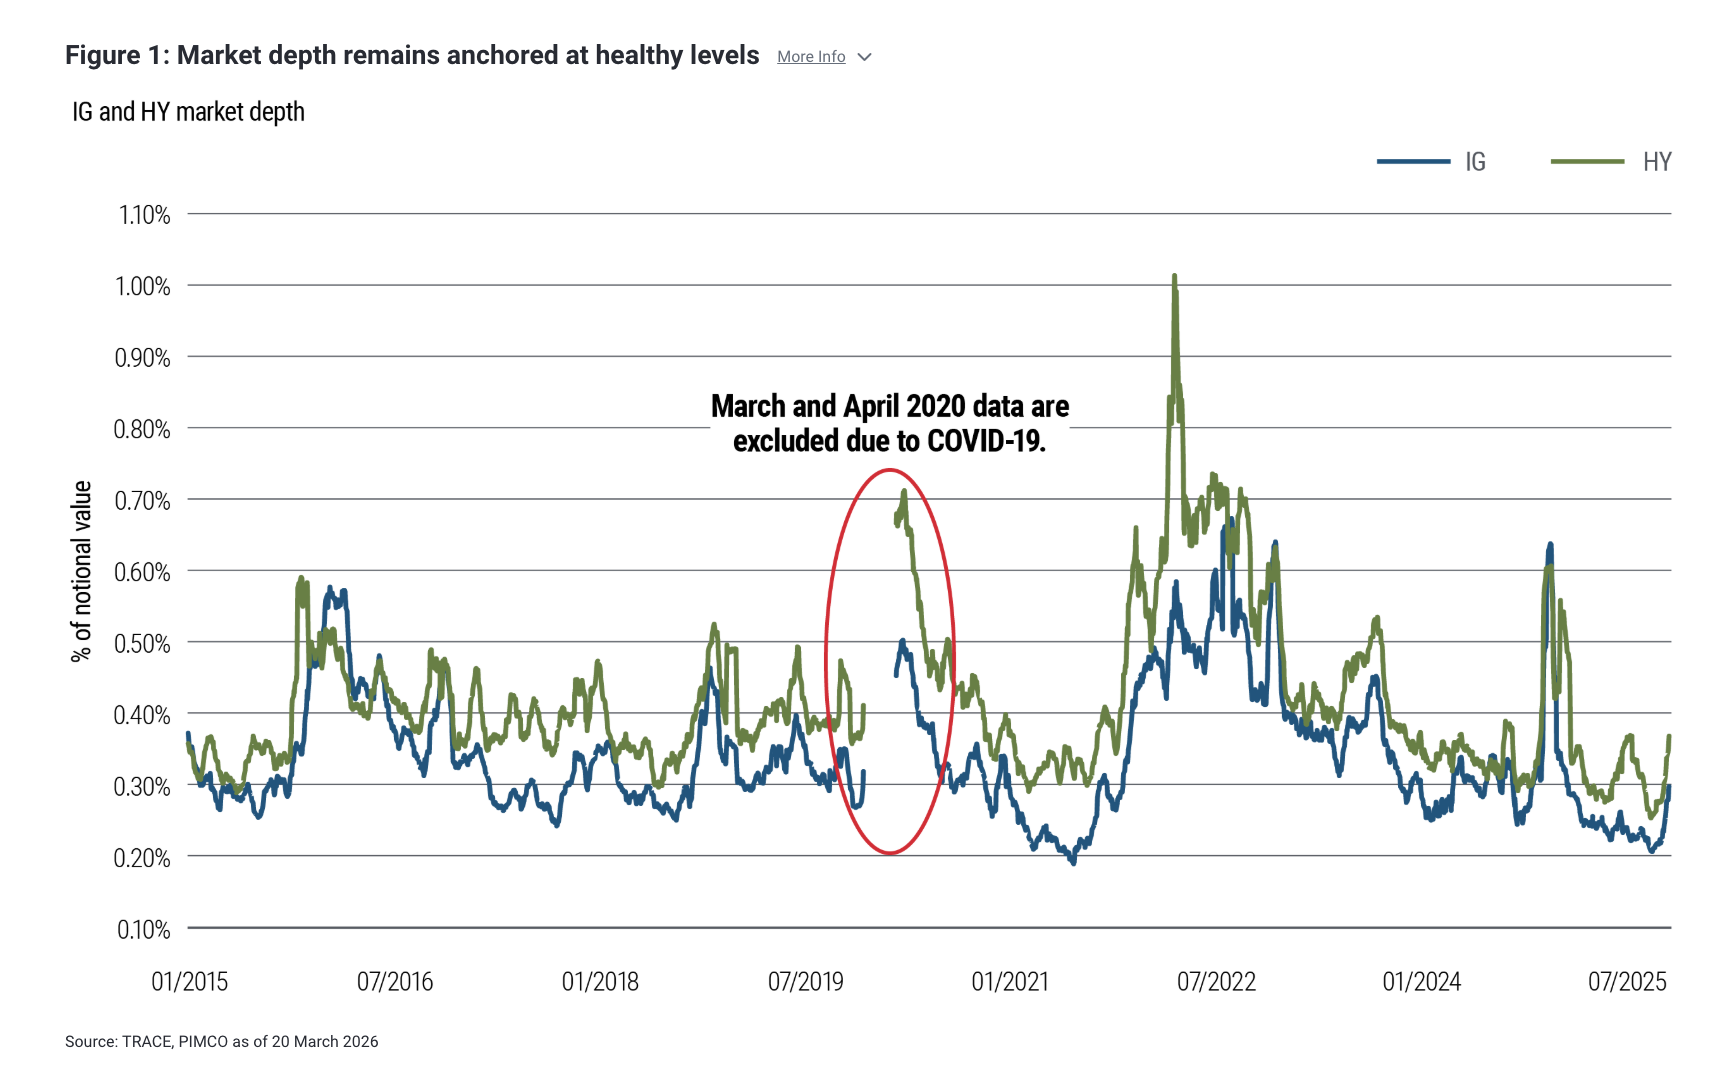
Depth: Can the market absorb trades without large price moves?
-
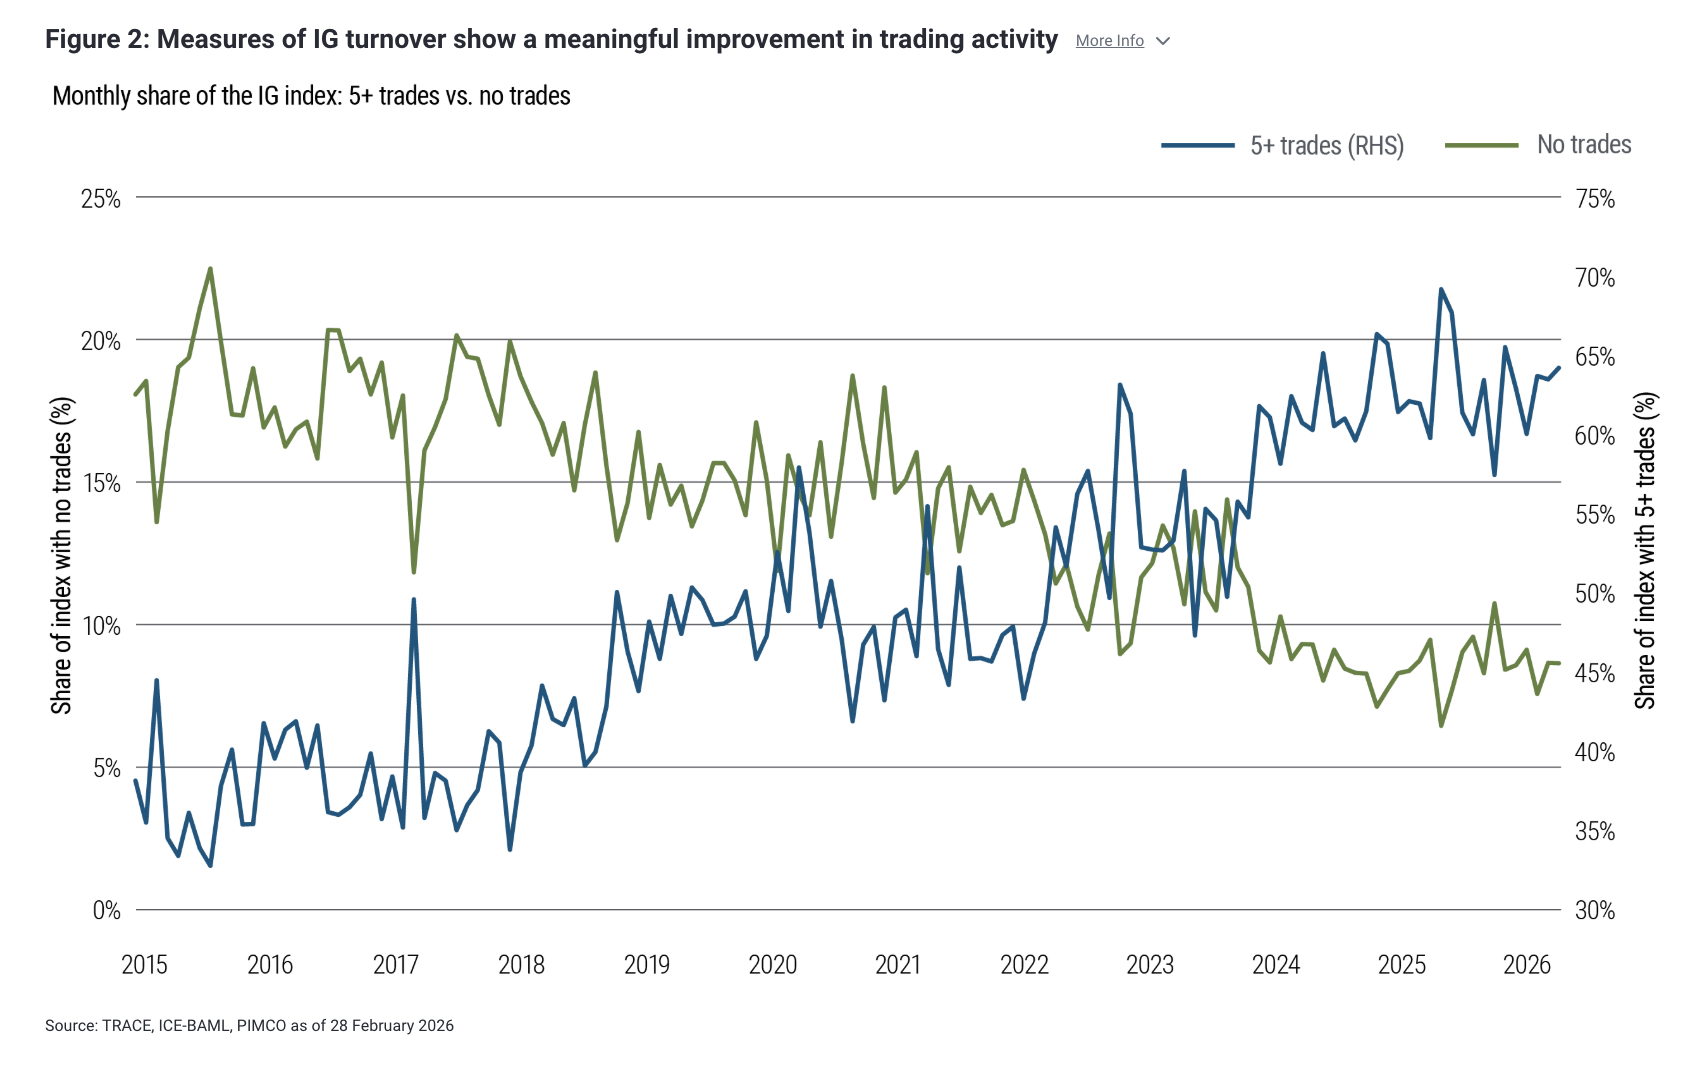
Breadth: Is trading activity dispersed across securities?
-
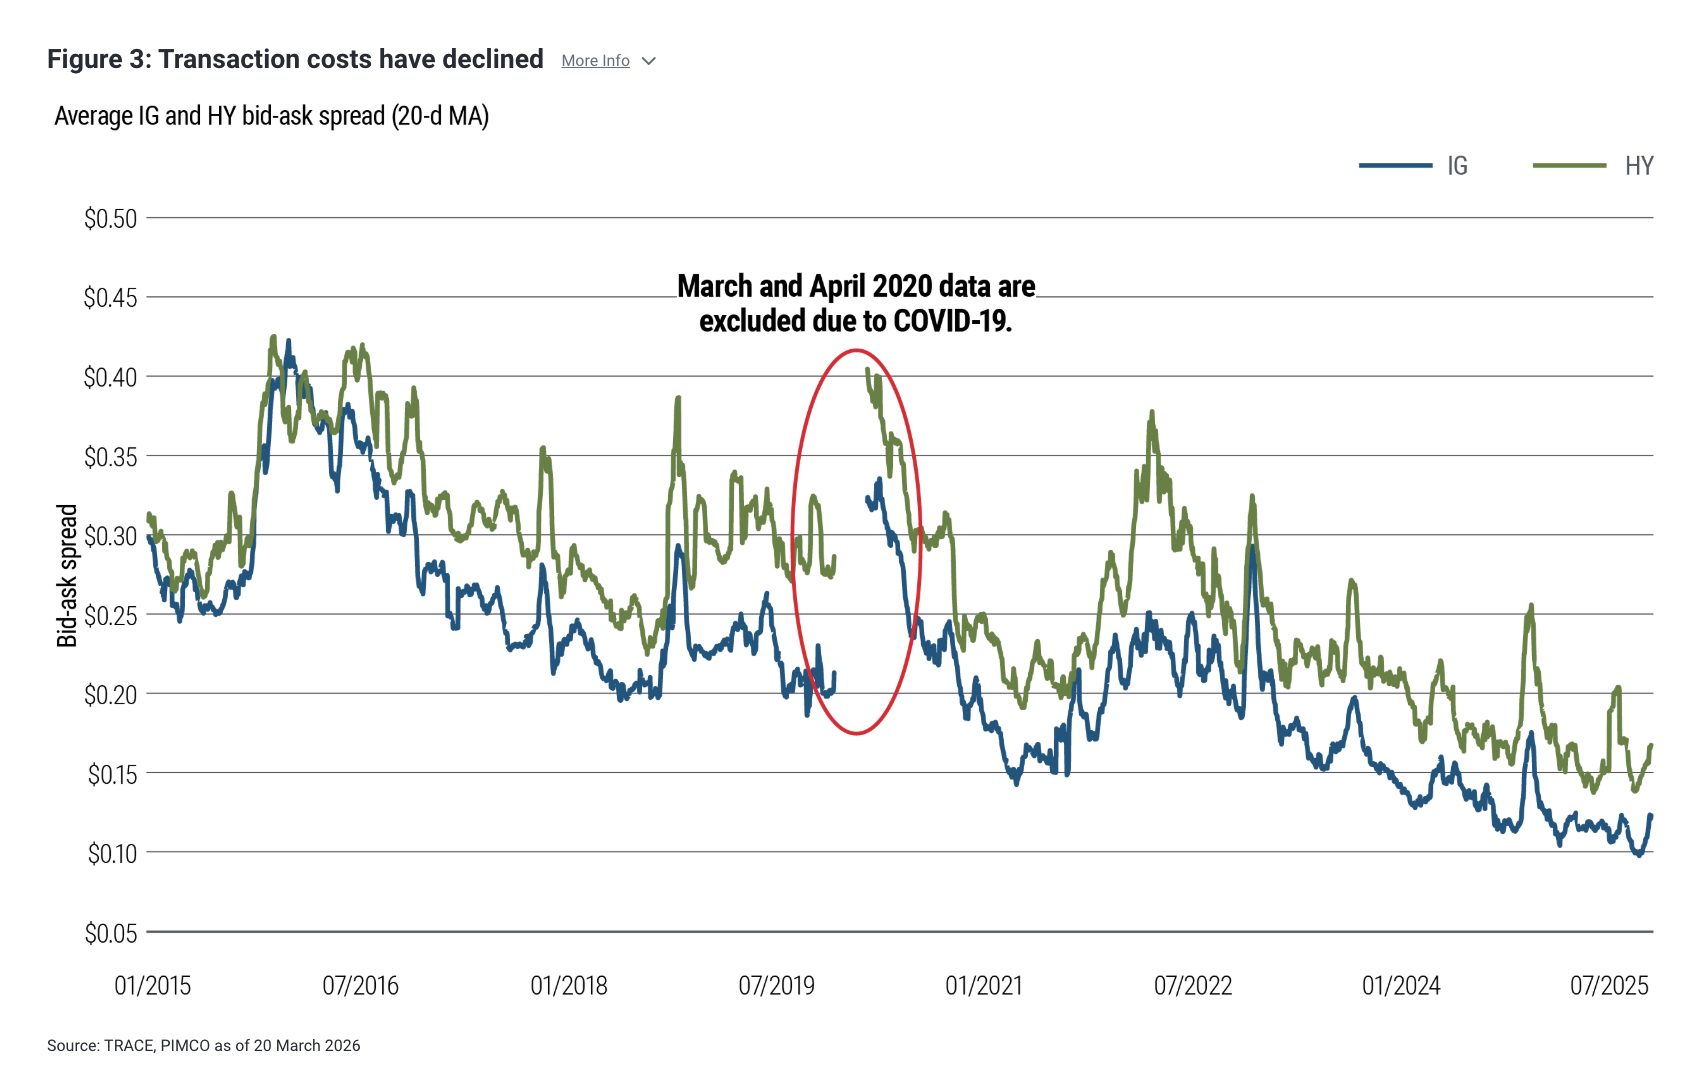
Transaction costs: What is the price of immediate execution?
We can quantify these components using transaction-level data from the TRACE database1. First, to capture depth, we use the Amihud illiquidity measure2. In plain English, it shows the average price change associated with one dollar of trading volume. While this fluctuates with volatility, it has remained well behaved – across investment grade (IG) and high yield (HY) markets alike – and is near the low end of its historical range (see Figure 1).

Second, to capture breadth, we calculate granular turnover measures. These also show a rise in trading activity across IG and HY: The share of the broader market index that fails to trade in a given month has tumbled, while the share trading more than five times has climbed (see Figures 2 and 3).
Third, to measure transaction costs, we use bid-ask spreads. These are close to all‑time lows (see Figure 3).
Why dealer inventories can mismeasure liquidity
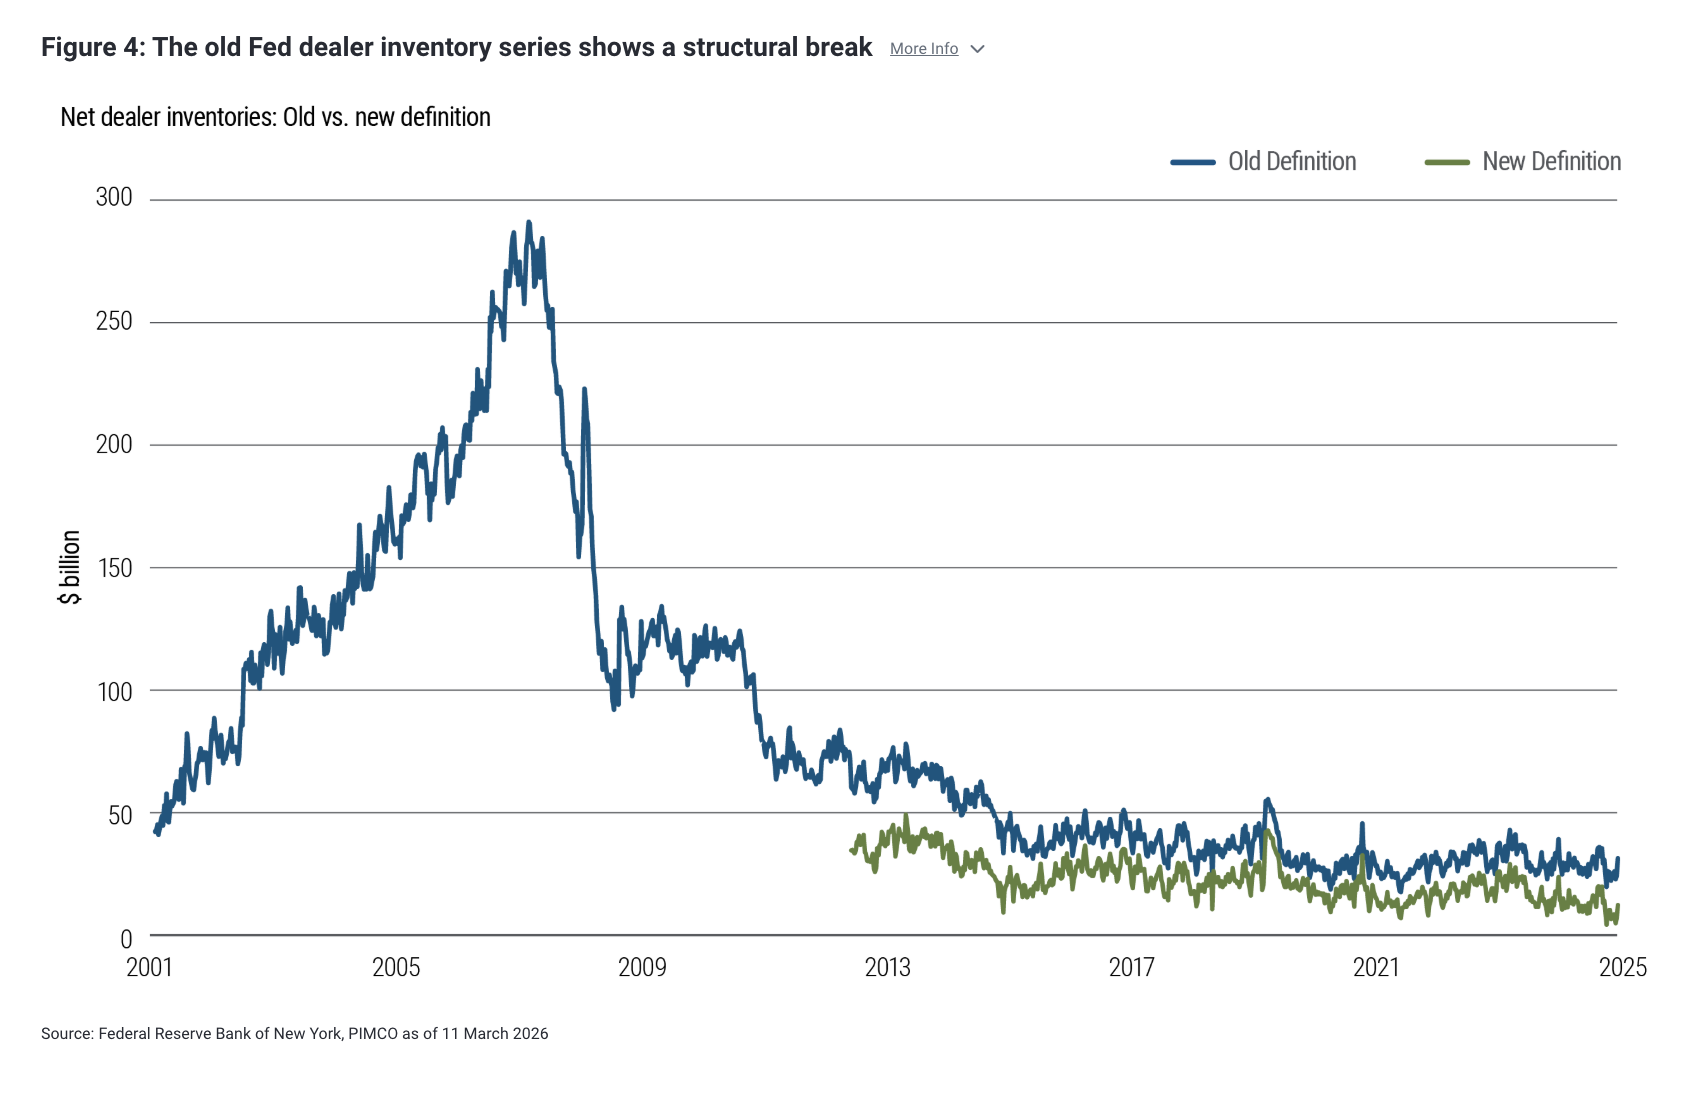
A common argument is that dealer inventories have declined sharply since the GFC, even as the corporate bond market has more than tripled in size. The implication is that while liquidity demand has increased, its traditional supplier has contracted. Yet this argument overlooks a key measurement change.
Prior to 2013, the Federal Reserve primary dealer survey combined corporate bonds with securitized products, most notably private‑label mortgage‑backed securities – holdings that ballooned in value before the GFC and then collapsed. The introduction of a forward‑looking distinction between corporate bonds and securitized products in 2013 – without historical backfilling – created a structural break that is frequently overlooked (see Figure 4).
During that period, innovations such as portfolio trading, ETFs, and electronic platforms have also made liquidity less balance sheet‑intensive and more network‑based.
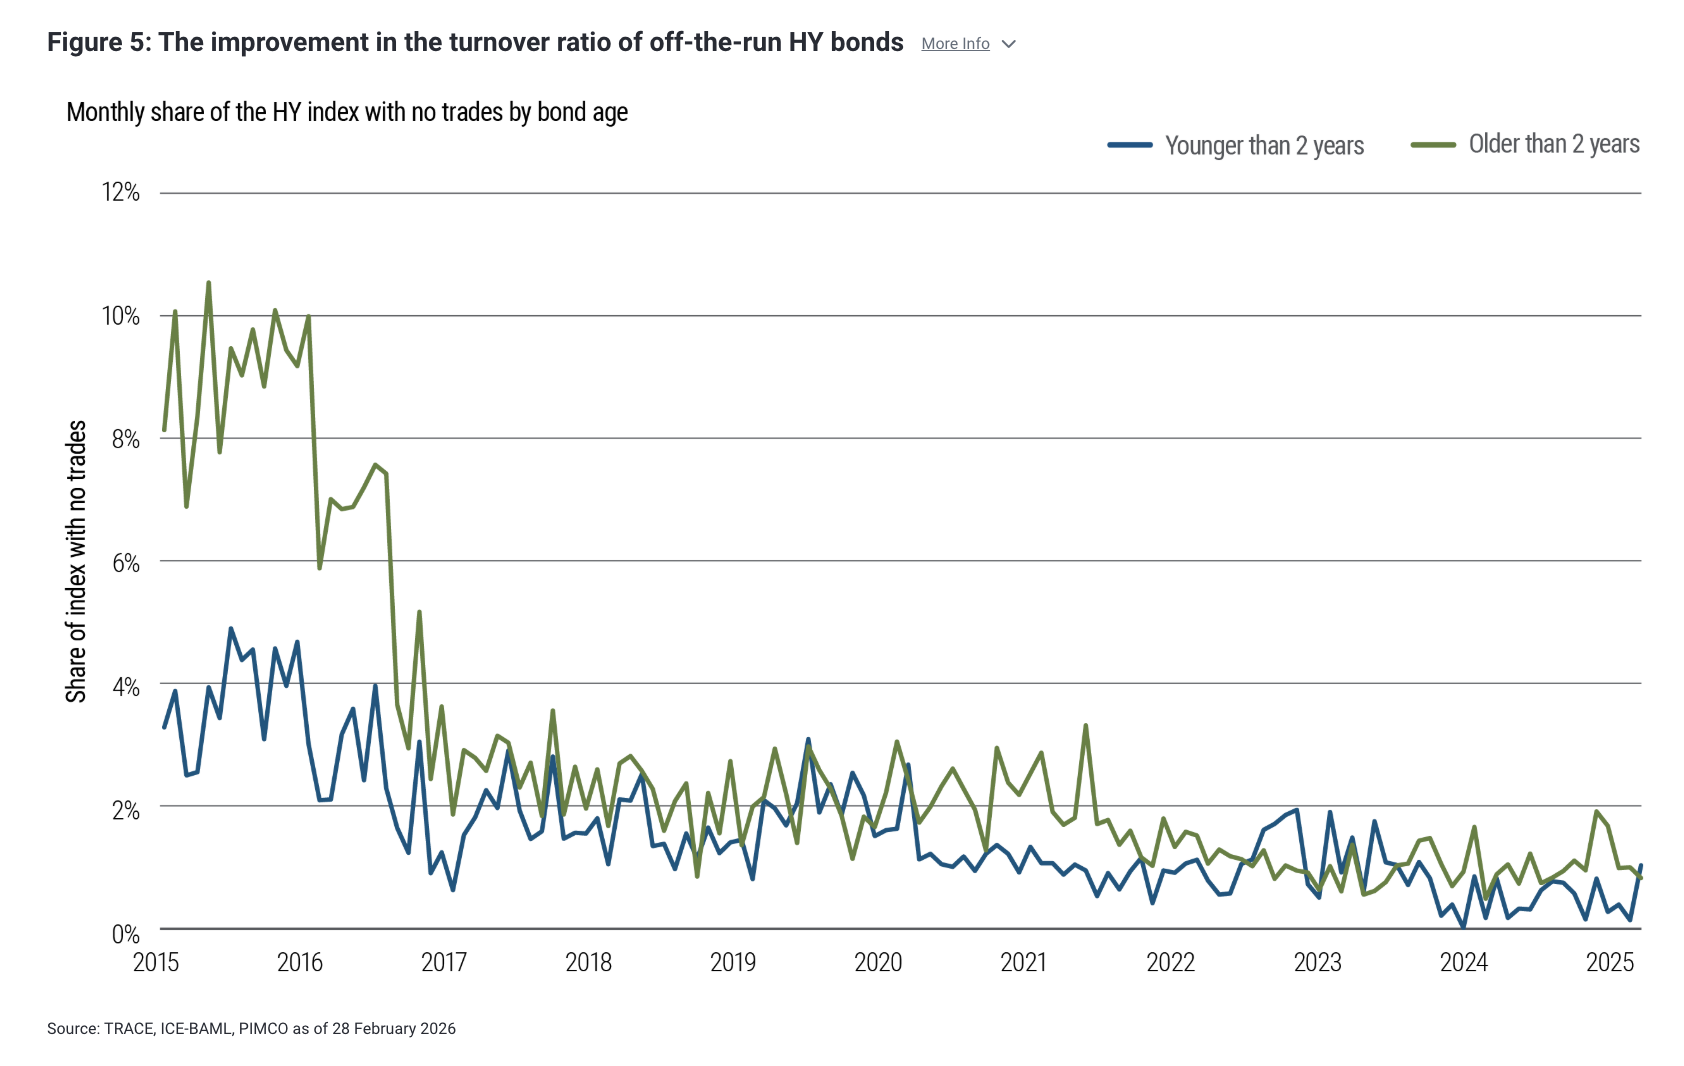
A related critique holds that only a narrow, “on-the-run” sleeve of recently issued bonds trades actively. In fact, TRACE data show that the turnover ratio in older and off-the-run bonds has risen materially, in HY (see Figure 5) as well as IG.
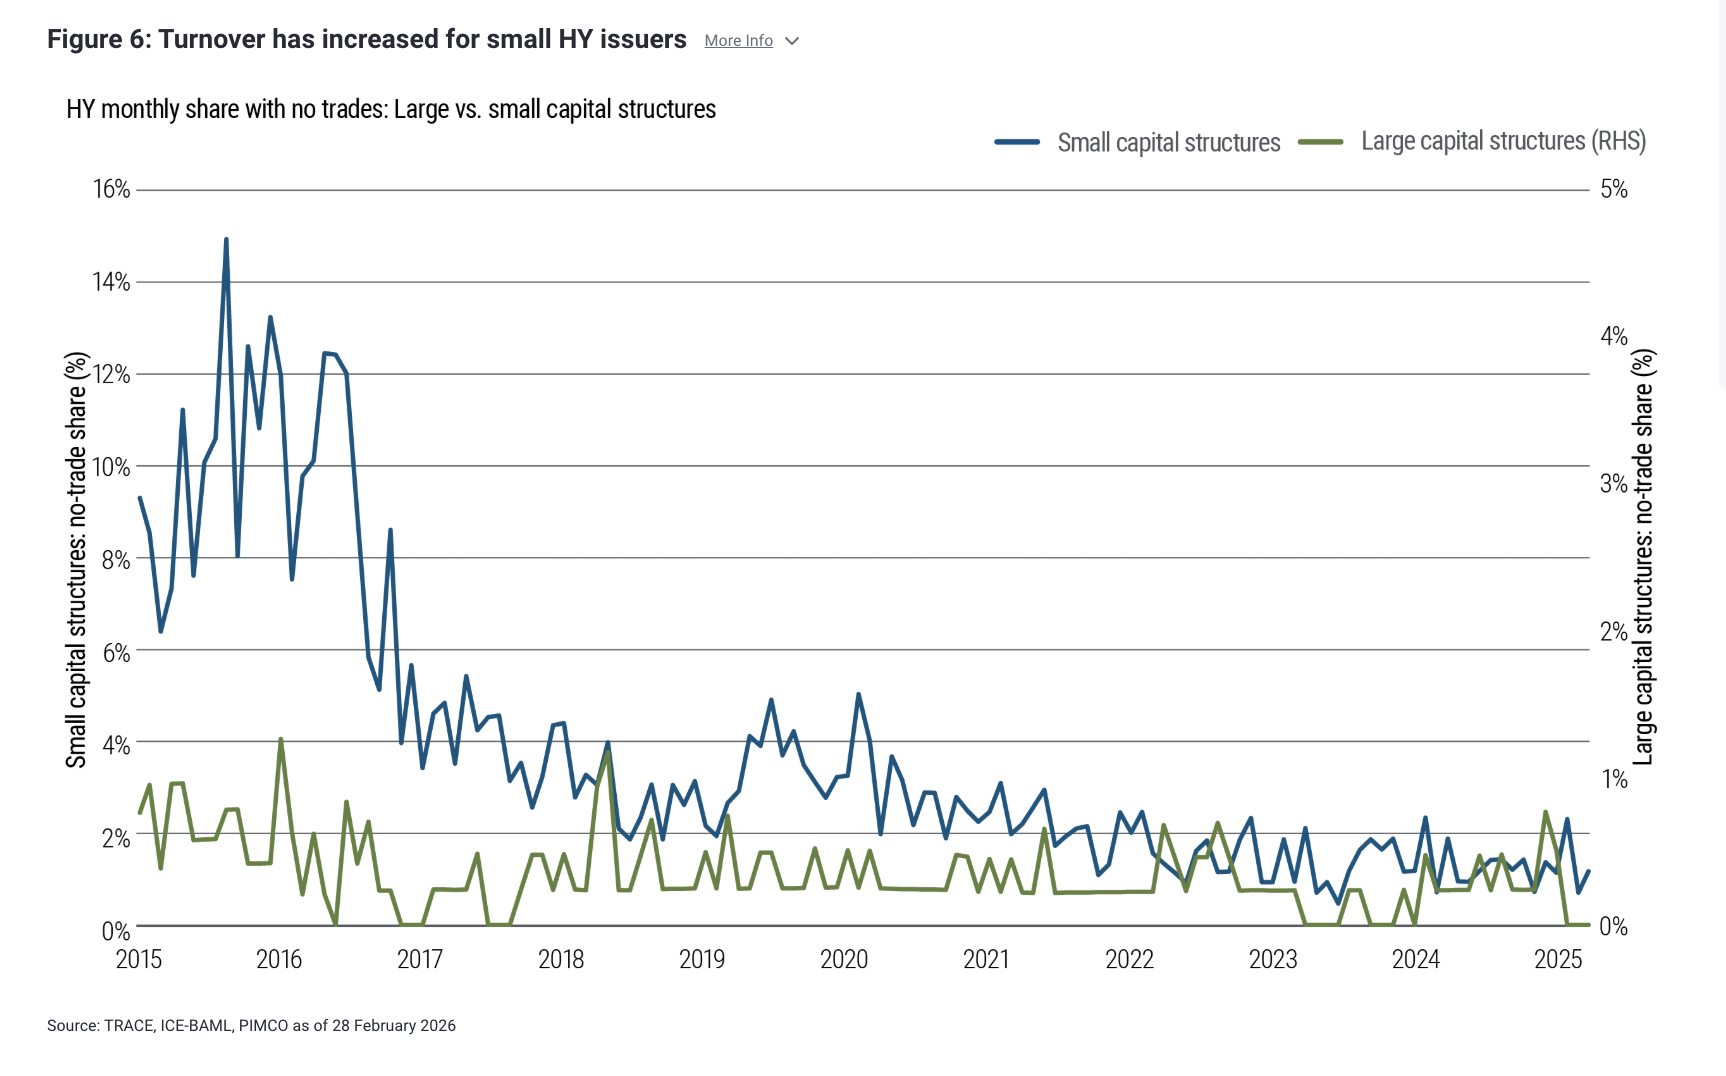
And as liquidity in off‑the‑run securities has increased, bonds from smaller issuers – historically among the least liquid segments of the market -- have also traded significantly more often.
Figure 6 illustrates this point by comparing the share of bonds that fail to trade in a given month for “small” issuers – those ranking in the bottom half by total bonds outstanding -- with the “large” issuers in the top half. It shows that issuers with smaller capital structures now benefit from a price‑discovery process comparable to that of larger issuers in the high‑yield market. The same holds true, to a lesser extent, in investment grade.
Private placements versus private markets
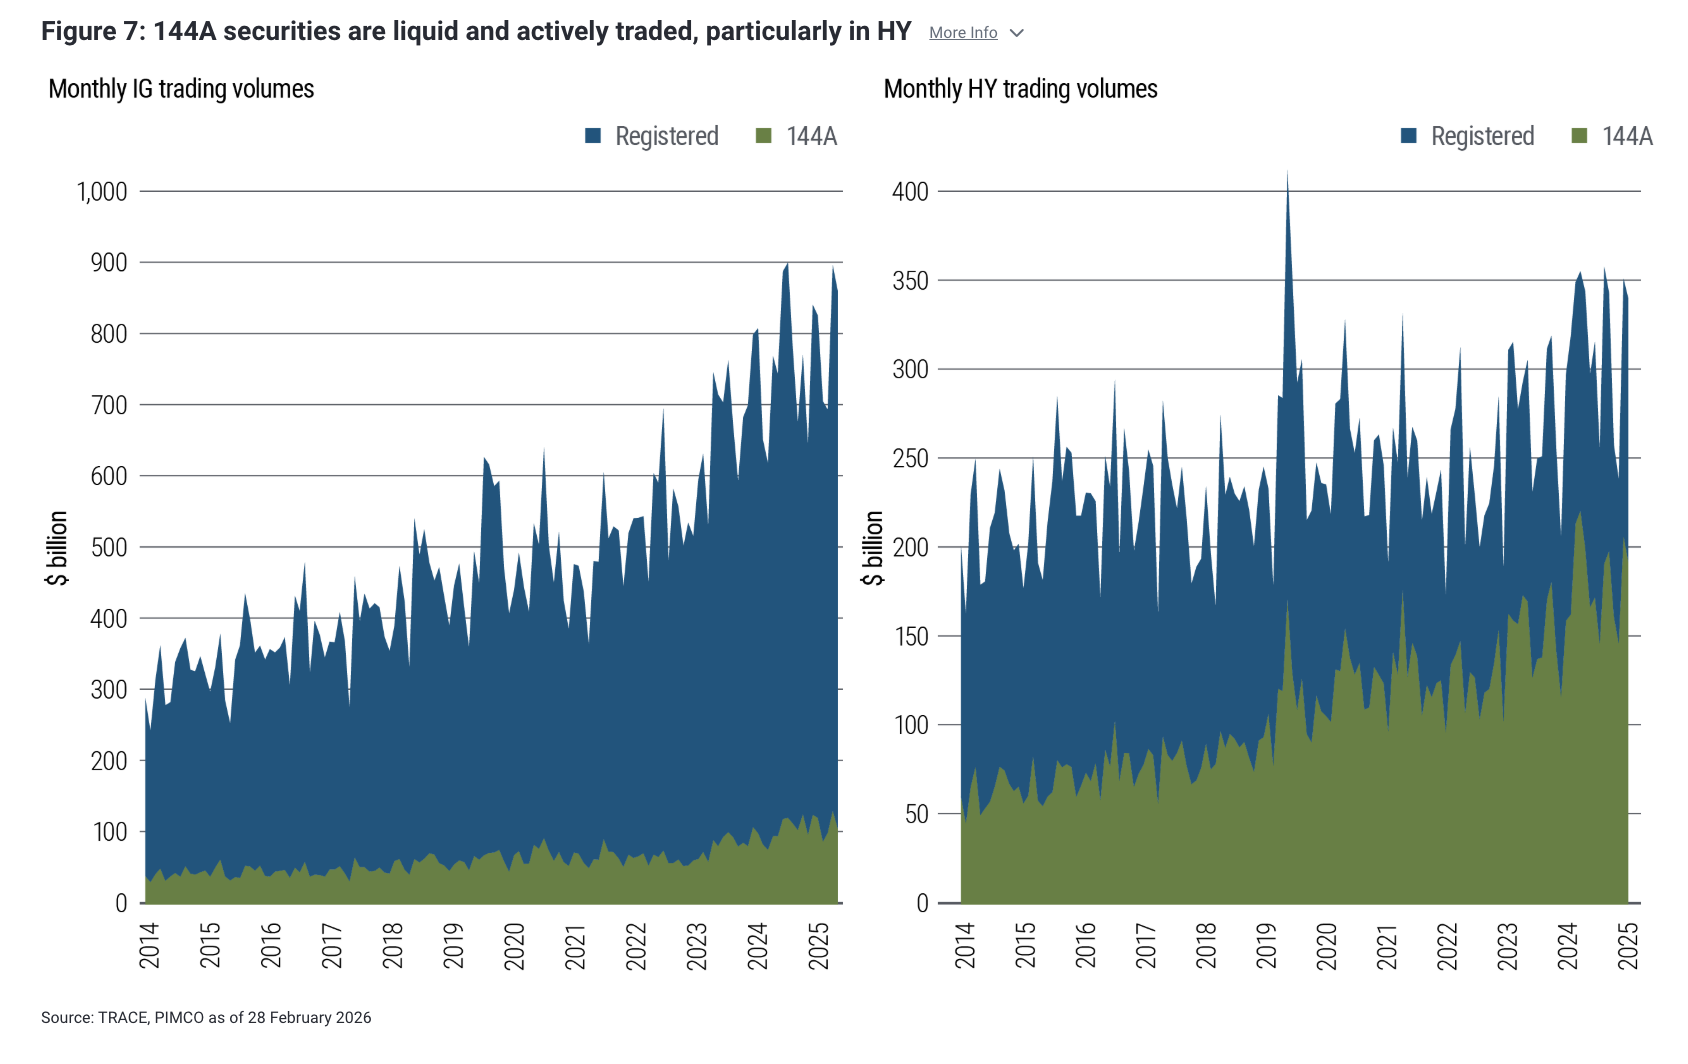
Amid the liquidity debate, critics sometimes conflate true private credit – which is persistently illiquid – with private‑placement securities issued under Rule 144A of the Securities Act of 1933.
Rule 144A bonds allow issuers to bypass SEC registration and sell securities to qualified institutional buyers, offering faster execution and lower issuance costs. Since mid-2014, when 144A securities began to be disseminated through TRACE, transparency and liquidity have increased materially. Today, 144A securities account for roughly 80% of the high‑yield market and trade regularly in significant volumes (see Figure 7).
Public credit liquidity has evolved – and improved
The bottom line is that public market depth, breadth, and execution costs are more robust than at any point in recent history. Recognizing how market structure truly functions is essential for investors assessing liquidity risk and the trade‑offs between public and private credit.
Gabriel Cazaubieilh contributed to this report.
Footnotes
1 TRACE (Trade Reporting and Compliance Engine) is a transactional reporting system operated by FINRA for U.S. corporate bond markets that was introduced in 2002. ↩
2 Amihud, Y. (2002). Illiquidity and stock returns: Cross-section and time series effects. Journal of Financial Markets, 5 (1), 31-56. ↩
Disclosures
Statements concerning financial market trends or portfolio strategies are based on current market conditions, which will fluctuate. There is no guarantee that these investment strategies will work under all market conditions or are appropriate for all investors and each investor should evaluate their ability to invest for the long term, especially during periods of downturn in the market. Outlook and strategies are subject to change without notice.
References to specific securities and their issuers are not intended and should not be interpreted as recommendations to purchase, sell or hold such securities. PIMCO products and strategies may or may not include the securities referenced and, if such securities are included, no representation is being made that such securities will continue to be included.
All Investments contain risk and may lose value. Investing in the bond market is subject to risks, including market, interest rate, issuer, credit, inflation risk, and liquidity risk. The value of most bonds and bond strategies are impacted by changes in interest rates. High yield, lower-rated securities involve greater risk than higher-rated securities; portfolios that invest in them may be subject to greater levels of credit and liquidity risk than portfolios that do not.
PIMCO as a general matter provides services to qualified institutions, financial intermediaries and institutional investors. Individual investors should contact their own financial professional to determine the most appropriate investment options for their financial situation. This material contains the opinions of the author and such opinions are subject to change without notice. This material has been distributed for informational purposes only and should not be considered as investment advice or a recommendation of any particular security, strategy or investment product. Information contained herein has been obtained from sources believed to be reliable, but not guaranteed. No part of this material may be reproduced in any form, or referred to in any other publication, without express written permission. PIMCO is a trademark of Allianz Asset Management of America LLC in the United States and throughout the world.
CMR2026-0326-5342815
A message from Advisor Perspectives and VettaFi: Discover something new! Click here to register for our upcoming webcasts.
Back to top
© PIMCO
Read more commentaries by PIMCO