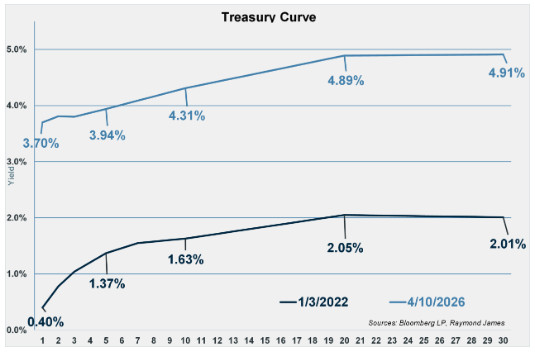
Yield curves exist for many products and can be interrelated, yet they also carry distinctive characteristics. Normally, long-term rates are higher than short-term rates because investors demand a higher return for lending money over longer periods. This arrangement would create an upward-sloping curve much like the Treasury curves displayed to the right. A “normal” upward slope exists typically when the economy is expected to grow.
Since yield curves often reflect investors' expectations for future rates, they can be both informative and sometimes misleading. More often, they are insightful. In addition, the relative historical level of interest rates is as important as the current relationship between maturities. Note the two Treasury curves above – one being the April 10, 2026, and the other from January 2022. Both are upward-sloping, providing higher rates for longer maturities. However, the current interest rate environment is relatively elevated compared with January 2022. Every maturity today gives an investor a much higher return. When in a historically high-interest-rate environment, it can be advantageous for an investor to lock in for as long as their risk profile and overall goals permit.

When investors expect interest rates to fall, say because they think the Fed is going to cut the Fed Funds rate, interest rates will tend to fall, especially short-term rates. What has been particularly difficult to anticipate is the Fed’s future behavior, largely due to a decision-making dilemma. The Fed is mandated to keep prices stable and to keep employment full. Inflation is an impending threat of higher prices, and the core PCE Index, a key inflation gauge, remains above target at 2.97%, well above the goal of 2.0%. The Fed could raise rates to combat high inflation. At the same time, the labor market appears to be trending downward, and a high unemployment rate would be harmful to the economy. The Fed could lower interest rates to help stimulate the economy and prevent employment from impeding healthy production. This predicament puts the Fed’s policy actions in the crosshairs of uncertainty and, in turn, stirs market volatility. Strong arguments can be made that the Fed’s next move could go either way, although the most likely outcome is that it leaves rates unchanged until there is more clarity on inflation and the labor market.
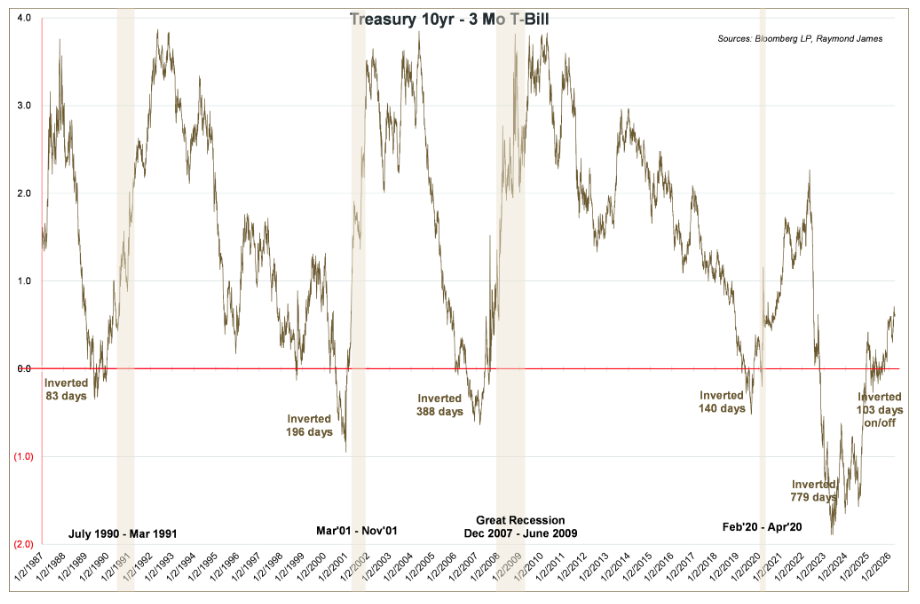
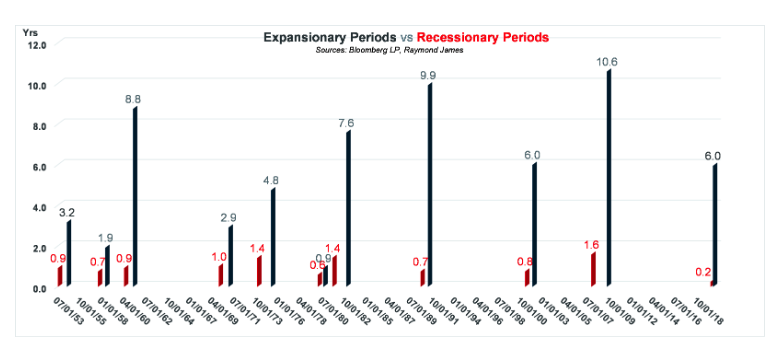
A normal upward-sloping curve indicates an expectation of economic growth, a flat curve, one of uncertainty, and an inverted curve can signal a recession. An inverted curve is when short-term maturities have higher rates than longer-term maturities. Historically, inverted curves have preceded most US recessions. The Treasury curve, as measured by the 10-year Treasury versus the 3-month T-Bill, was inverted for over two years, from October 2022 to December 2024. Approximately six months later, it inverted on and off for another three months. Since mid-September 2025, the curve has been upward sloping. The last four recessions occurred between 1.5 and 6 months after the inverted curve normalized. We are currently almost 7 months past the last day the curve was inverted. The average expansionary period has increased from 5.7 years (1953-present) to over 8 years (the last 36 years), whereas the average recessionary period remains at 0.9 years.
Did investors or the Fed get it wrong this time? Is a recession just taking longer to ensue? The Fed appears to have perfected the use of the tools at its disposal to postpone recessions and/or elongate expansionary periods. Open market operations, through which the Fed can increase or decrease the money supply, and interest rate decisions on the Fed Funds rate have been two of its integral tools.
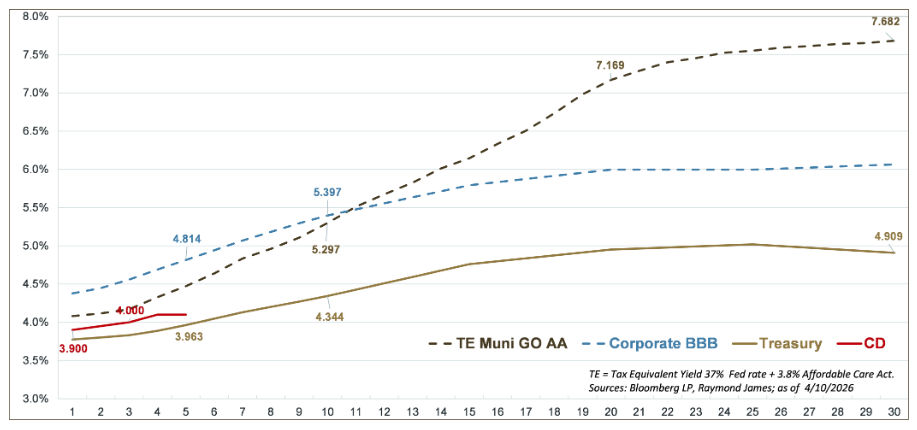
This graph depicts several different yield curves. Typically, discussions center on the gold Treasury curve, considered the base rate from which most other rates are derived. Each product carries distinct dynamic risk characteristics, which can fluctuate the rates offered and continually change its relative value to Treasury rates. Client risk profiles and goals may then help provide suitable choices for investors.
Today’s yield curves and interest rates expose some underlying messages. One is that uncertainty about an abating yet not weak labor market, coupled with a sticky inflationary environment, has created enough indecision to keep markets volatile. The most potent yield-curve read is historically accurate. Interest rates are elevated, providing income investors with viable opportunities to lock in high yields.
A message from Advisor Perspectives and VettaFi: Discover something new! Click here to register for our upcoming webcasts.
The author of this material is a Trader in the Fixed Income Department of Raymond James & Associates (RJA), and is not an Analyst. Any opinions expressed may differ from opinions expressed by other departments of RJA, including our Equity Research Department, and are subject to change without notice. The data and information contained herein was obtained from sources considered to be reliable, but RJA does not guarantee its accuracy and/or completeness. Neither the information nor any opinions expressed constitute a solicitation for the purchase or sale of any security referred to herein. This material may include analysis of sectors, securities and/or derivatives that RJA may have positions, long or short, held proprietarily. RJA or its affiliates may execute transactions which may not be consistent with the report’s conclusions. RJA may also have performed investment banking services for the issuers of such securities. Investors should discuss the risks inherent in bonds with their Raymond James Financial Advisor. Risks include, but are not limited to, changes in interest rates, liquidity, credit quality, volatility, and duration. Past performance is no assurance of future results.
Investment products are: not deposits, not FDIC/NCUA insured, not insured by any government agency, not bank guaranteed, subject to risk and may lose value.
To learn more about the risks and rewards of investing in fixed income, access the Financial Industry Regulatory Authority’s website at finra.org/investors/learn-to-invest/types-investments/bonds and the Municipal Securities Rulemaking Board’s (MSRB) Electronic Municipal Market Access System (EMMA) at emma.msrb.org.
Links are being provided for information purposes only. Raymond James is not affiliated with and does not endorse, authorize or sponsor any of the listed websites or their respective sponsors. Raymond James is not responsible for the content of any website or the collection or use of information regarding any website's users and/or members.
Raymond James & Associates, Inc., member New York Stock Exchange / SIPC, and Raymond James Financial Services, Inc., member FINRA / SIPC, are subsidiaries of Raymond James Financial, Inc.
Raymond James® and Raymond James Financial® and power of personal® are registered trademarks of Raymond James Financial, Inc.
Raymond James & Associates Statement of Financial Condition - September 2025 (PDF)
© Raymond James
Read more commentaries by Raymond James