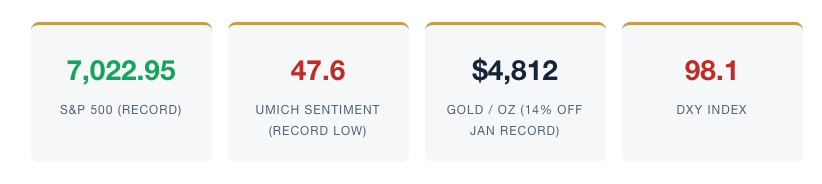
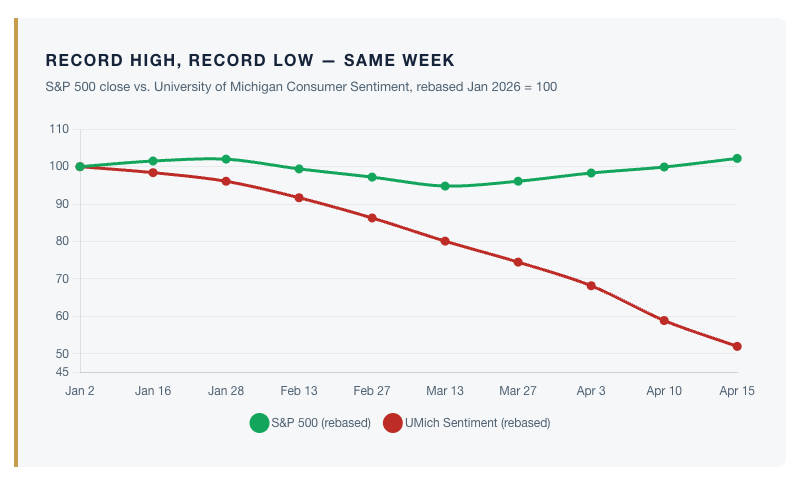
The S&P 500 closed Wednesday at a fresh all-time high of 7,022.95, surpassing the late-January peak and capping a remarkable round trip from the spring selloff. Yet on the same morning that index scraped a new record, the University of Michigan’s preliminary April reading of consumer sentiment collapsed to 47.6 — the lowest print in the survey’s entire fifty-year history, below anything recorded during the 2008 financial crisis, the 1980 stagflation peak, or the depths of the pandemic. Two numbers, same economy, same week. In our view, investors who choose to read only one of them are setting themselves up for a rough second half.
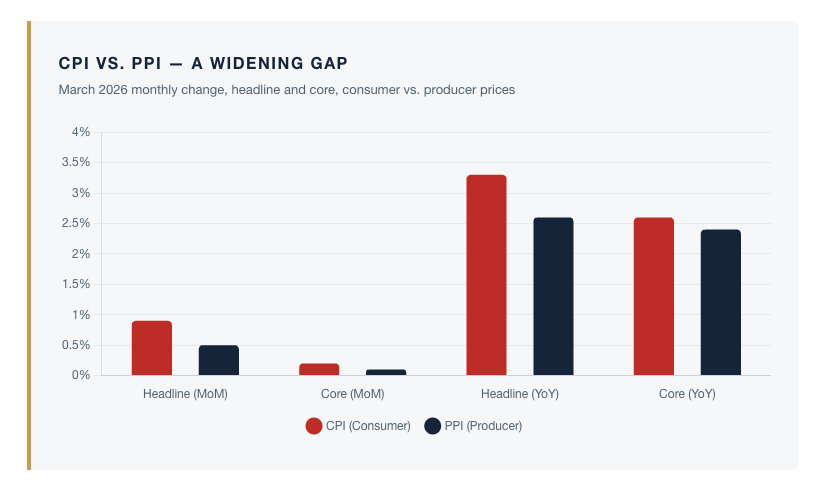
The data this week was a genuine paradox. March CPI, released Friday the 10th, came in hot at the headline — a 0.9% monthly jump and 3.3% year over year, the largest monthly print in nearly four years, driven overwhelmingly by a gasoline-led energy spike tied to the Iran conflict. Core CPI, stripping out food and energy, was much calmer: just 0.2% month over month and 2.6% year over year, unchanged from February. But the following Tuesday’s producer price report told an even quieter story. Headline PPI rose just 0.5% versus a 1.1% consensus, and core PPI printed a near-dormant 0.1% against expectations of 0.6%. In other words, once the oil pass-through is set aside, goods pipeline pressure is easing meaningfully. Markets seized on the PPI miss, Treasury yields eased off their highs, and the ten-year note settled back toward 4.3%. The dovish read is that underlying disinflation is already underway and the March headline is a one-off energy shock. The more sober read is that producers are absorbing margin hits they cannot fully pass through, which is not the same thing as healthy price stability.
To the credit of the American consumer, bank earnings this week reminded us that balance sheets remain in reasonable shape. Morgan Stanley reported a 16% year-over-year revenue increase alongside a $3.43 EPS beat, and Bank of America posted $1.11 per share against solid guidance. Deposits at the large commercial banks remain near record levels, and card data through March shows that households — particularly upper-income ones — are still spending. We have been careful in recent updates not to mistake a cooling labor market for a cracking economy. Payroll softness may partly reflect genuine AI-driven productivity gains, not demand destruction. That caveat still applies. The U.S. consumer is not broken.
Read more: Three Trends Shaping Transition Management
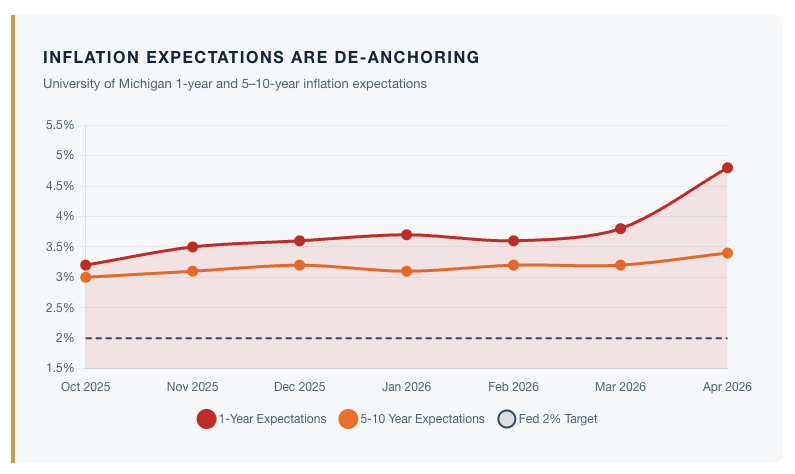
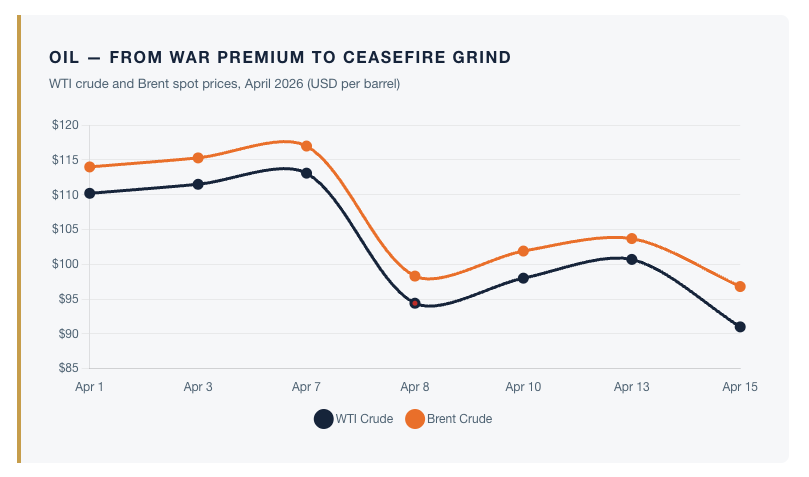
What is broken, in our view, is consumer confidence in the path ahead. The Michigan reading was not a one-off flinch. Year-ahead inflation expectations inside the same survey jumped from 3.8% to 4.8% — the largest single-month increase since April of 2025, another moment when tariff anxiety was peaking. Long-run expectations climbed to 3.4%, the highest reading since November. Households are telling pollsters what the PPI is not: they believe the cost of living is about to get worse, not better. And they are saying it against a backdrop of oil that has had a dramatic month. WTI traded above $111 in early April on Iran war fears, collapsed to $94.41 on the April 8 ceasefire announcement, then rallied back above $99 mid-week as Iran failed to reopen the Strait of Hormuz and the administration ordered a naval blockade, before receding to $91 by Wednesday on fresh talks of a ceasefire extension. Brent followed the same arc and settled near $95. The Michigan interviewers finished 98% of their survey work before the April 8 ceasefire, so some of that pessimism is already stale. But the Strait remains a live flashpoint, the two-week ceasefire expires on April 21, and extension negotiations are still fluid — and consumers remember the $111 print more vividly than they price in the $91 close.
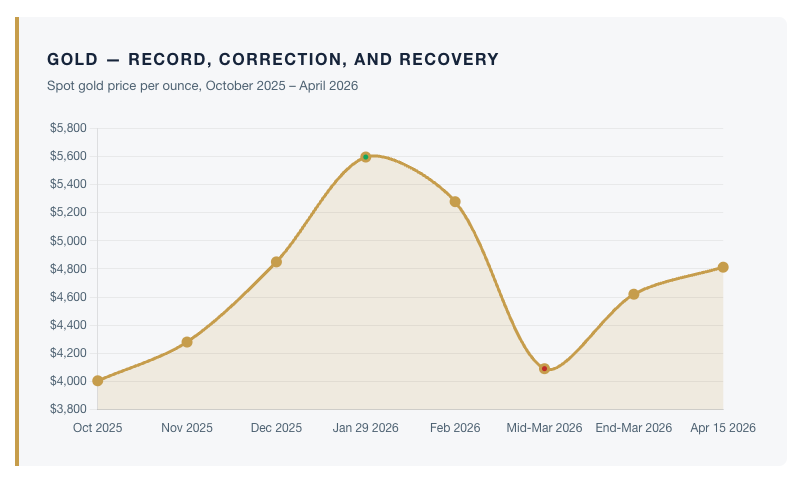
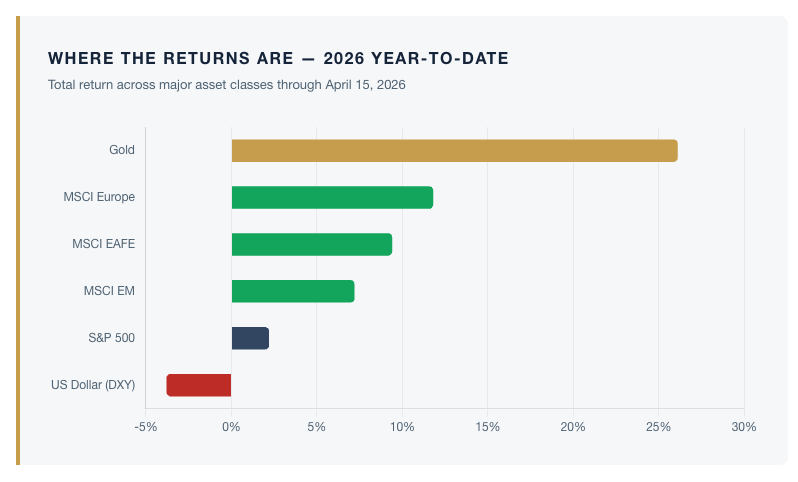
Gold is reading both tapes at once. Spot bullion closed the week at roughly $4,812, with June futures printing above $4,830. Readers will recall we wrote in late March that the mid-quarter pullback — from the all-time high of $5,595 on January 29 down to the low $4,000s by mid-March — was a technical correction, not a fundamental one. Six weeks later, that call is holding up. Gold has rallied nearly 20% off the March low and now sits roughly 14% below its own record, a textbook retest pattern. Historically, gold rallies this durable only occur when three conditions align: real yields are capped, the dollar is weak, and geopolitics is unsettled. All three hold today. The DXY slipped to 98.1 by Wednesday, drifting lower even as equities rallied — not a crash, but a chronic softness, with the yuan modestly stronger year to date and the euro grinding higher on a widening rate differential. China’s ten-year yield sits at just 1.81%, yet foreign demand for Treasuries has stayed tepid. The “sell America” trade we wrote about last year has not gone away. It has simply matured into a steady repricing of the global allocation toward hard assets and non-U.S. equities.
The Fed adds another layer. Chair Powell presides over the April 28–29 FOMC meeting, his last before the chairmanship transitions to Kevin Warsh on May 15. Warsh’s Senate confirmation hearing is scheduled for April 21, the same day as the delayed retail sales release. Futures markets are pricing a rising probability of a rate cut at that April meeting, and the PPI miss handed the doves political cover. But the headline CPI surge handed the hawks equal ammunition, and with inflation expectations de-anchoring in consumer surveys, a rushed cut carries a price. Our concern is not which direction the Fed moves. It is that monetary policy is increasingly operating in the shadow of fiscal dominance — a federal deficit projected at $1.9 trillion for fiscal 2026, an interest-expense line that now rivals defense spending, and a political calendar that rewards accommodation. This is the environment in which gold has historically outperformed, and international real assets have historically re-rated.
None of this is a bearish indictment of the United States. The S&P 500 at 7,000 is not irrational — earnings are delivering, AI capital expenditure is real, and the productivity story has legs. What it is, we believe, is increasingly concentrated. The same ten or twelve names are doing the same heavy lifting they were doing a year ago, the index’s valuation is once again stretched against its own history, and the tape is floating higher on a consumer mood that has never been lower. That is not a stable equilibrium. The prudent response, in our view, is not to fight the rally but to make sure the portfolio is diversified against the ways in which it can unwind — a weaker dollar, firmer oil, re-accelerating inflation, or a Fed that blinks first. Each of those scenarios rewards the same set of allocations: international value equities, emerging-market exposure, precious metals, and hard assets with pricing power.
Next Tuesday, April 21, will be a genuinely heavy tape. The two-week US-Iran ceasefire expires, Kevin Warsh sits for his Senate confirmation hearing, and the delayed March retail sales report is released — three moving pieces on a single day. We will be watching all of them, alongside Powell’s tone at the April 28–29 FOMC meeting a week later. In the meantime, our positioning remains what it has been — underweight U.S. mega-cap concentration, overweight international equities with dividend support, meaningful exposure to gold and gold equities, and a durable allocation to the kind of hard assets that benefit precisely when the headline tape and the household tape refuse to agree.
Investment Risk
Please read about the Risks of investing in the Funds. You should carefully consider the Fund’s investment objectives, risk, charges and expenses before investing. Investing involves risk, including potential for loss of principal. The risks of investing in emerging market and foreign securities may be higher than the risks associated with investing other securities. Diversification cannot assure a profit or protect against loss in a down market. Dividends are not guaranteed and may fluctuate. Fund holdings are subject to change and risk. Past performance cannot predict future results.
To obtain a prospectus or summary prospectus that contains this and other information about the Funds, please Click Here or call 1-866-878-2881. Please read the prospectus carefully before investing. Euro Pacific Asset Management Funds are distributed by Distribution Services, LLC (Euro Pacific Asset Management is not affiliated with Distribution Services, LLC).
Disclosure: Any tax or legal information provided is merely a summary of our understanding and interpretation of some of the current income tax regulations and it is not exhaustive. Investors must consult their tax advisor or legal counsel for advice and information concerning their particular situation. Neither the Funds nor any of its representatives may give legal or tax advice.
A message from Advisor Perspectives and VettaFi: Discover something new! Click here to register for our upcoming webcasts.
© Euro Pacific Capital
Read more commentaries by Euro Pacific Capital