Newsletter March 2026
Membership required
Membership is now required to use this feature. To learn more:
View Membership BenefitsLOTS OF MARKET STUFF AND A FEW FUN ITEMS
ChatGPT picks 2 AI stocks to turn $100 into $1,000 by 2026 (6/3/2025 – 12/31/2025)
The first pick was SoundHound AI (NASDAQ: SOUN),
At the time of writing, SOUN shares were trading at $10.12, with a 10.13% increase in the past 30 days. As of 3/24/26, SOUN was trading at $6.39.
The Moral – Might not want to use ChatGPT as your investment guide.
GO FIGURE
Dow, S&P 500 Hit Record Highs as Wall Street Shrugs Off Government Shutdown Concerns for Now From October 1, 2025…
“Stocks closed slightly higher on Wednesday as the US government officially entered a shutdown and Wall Street grappled with the uncertain implications for the economy…”
The S&P 500 and Dow both closed at record highs.
Since October we’ve seen a government shutdown, wars in the Ukraine and Middle East, political comedy but the market is still hanging in there. S&P 10/1/2025 $672 and $658 on 3/24/2026.
https://finance.yahoo.com/news/stocks-slide-government-officially-shuts-113214394.html
ACTIVE vs PASSIVE
As of 12/31/2025
If you are tempted to do your own stock picking (or have an advisor who believes they can), you might want to see how professionals managing billions of dollars have fared. Excerpts from Morningstar’s 2025 SPIVA continues to question the value of active management.
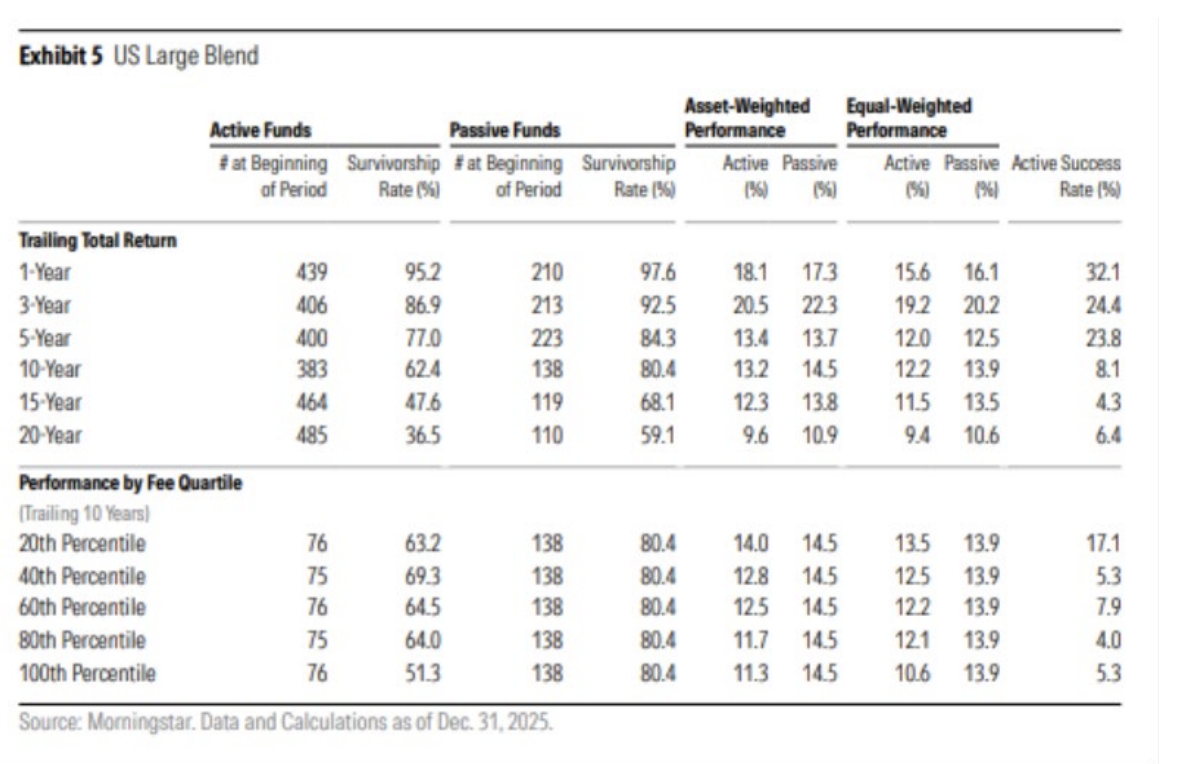
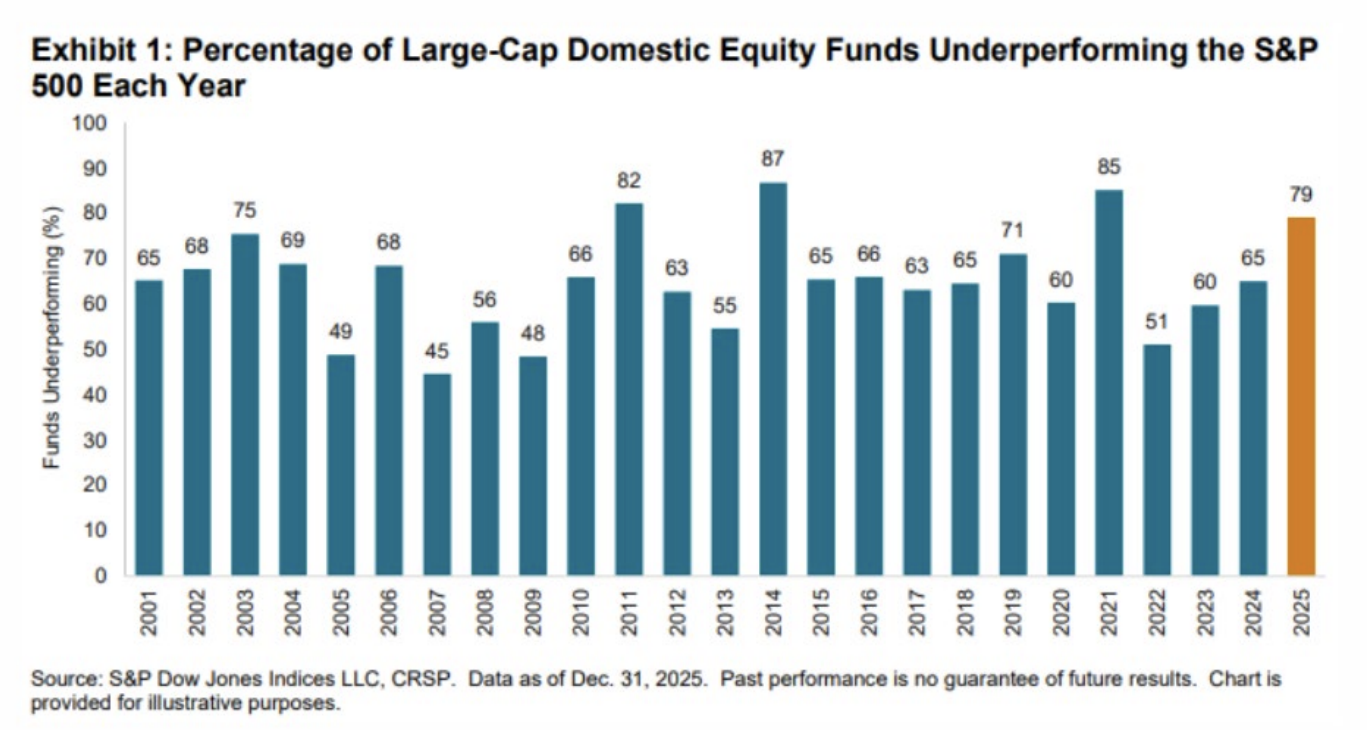
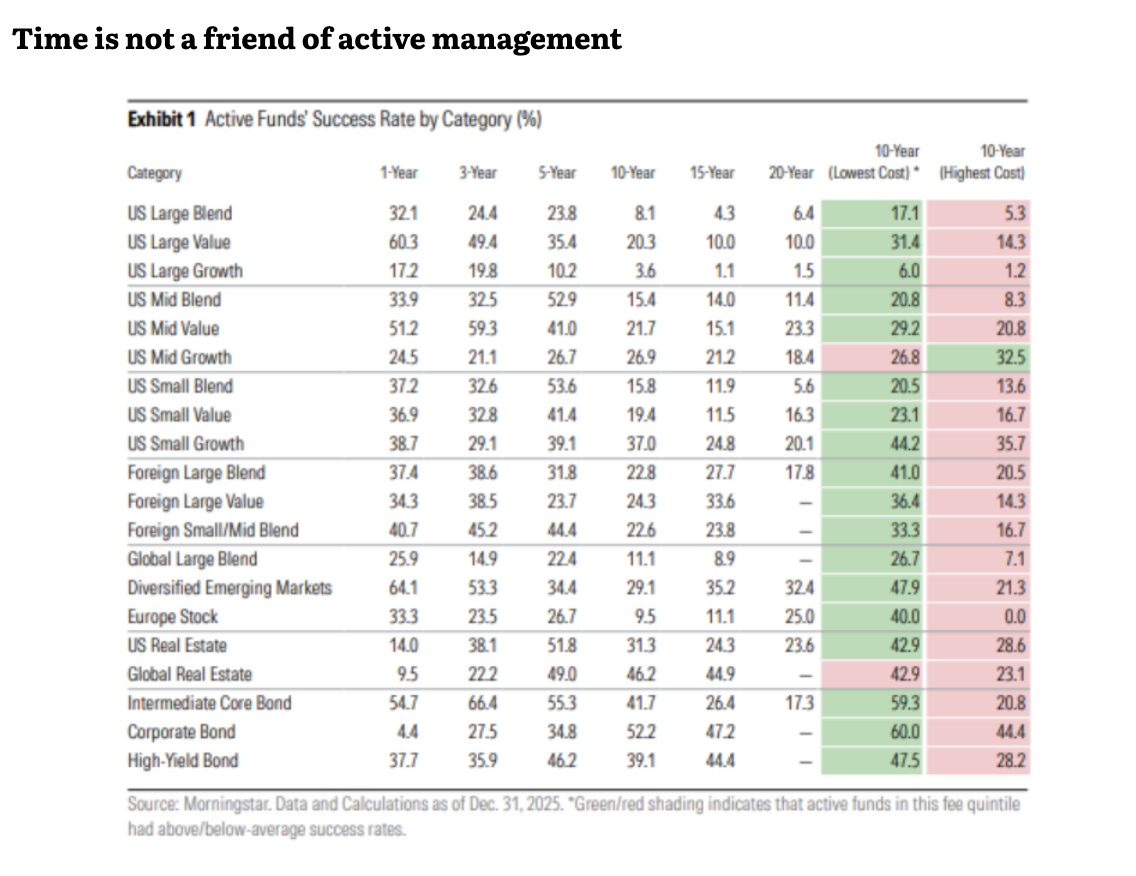
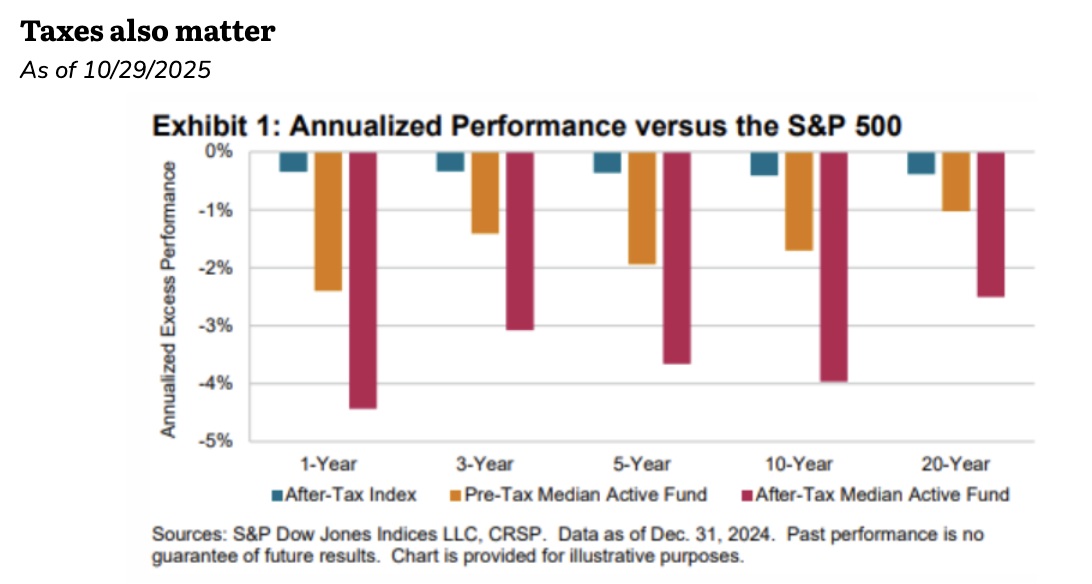
https://www.spglobal.com/spdji/en/spiva/article/spiva-after-tax-scorecard
LOOKING BACK
I like to occasionally look back at earlier Newsletter items. This was from October 2018:
Lunch With Ariel’s John Rogers: The active versus passive debate continues
From Kiplinger’s Personal Finance
“John Rogers is a double anomaly. At a time when investors are increasingly turning to index funds, he picks individual stocks. And at a time when the markets prefer growth-oriented companies, he buys value-based shares…he launched Chicago based Ariel Investments in 1983…the firm’s flagship public fund, Ariel Funs, opened three years later….”
Rogers became convinced in the 1980’s that smaller companies that were less understood offered significant opportunities. U.S. News ranked Ariel #11 out of 397 Mid-Cap Value funds.
As I noted at the time, I prefaced this with the observation that Mr. Rogers is one of the finest and most respected active managers in the country. I also share his value and small/mid cap bias. Unfortunately, comparing Ariel to a S&P Mid-Cap Value ETF, that does not ultimately translate to investment success.
5 Years (3/24/2026)
Ariel 33.3%
S&P Mid-Cap Value 50.2%
Add to that Ariel’s expense ratio of 1% and tax cost of 1.35% versus the S&P Mid Cap Value expenses ratio of 0.18% and tax cost of 0.56%. Passive wins again.
INCOME PORTFOLIOS VS TOTAL RETURN
As readers of my Newsletters know, I’m not a big fan of “income portfolios,” in fact I consider the concept detrimental to investors’ long term financial success (a scam). However, that doesn’t seem to stop the marketing of the “income portfolio.”
Here’s an excellent review of the issues:
TOTAL RETURN vs DIVIDENDS/INTEREST
Total-return approach uses a diversified portfolio’s combined growth (capital gains + dividends/interest) and systematic withdrawals to generate cash flow.
Dividend/interest-focused approach concentrates on assets that pay “regular” cash (dividends, coupons) and uses the cash flow itself as the income source.
Advantages of a total-return portfolio for a client needing consistent income:
- Flexibility: withdrawals can come from income or realized gains, so you’re not forced to hold low-return cash cows; it is easier to adapt to market conditions.
- Higher long-term potential: broader investable universe (growth stocks, ETFs, REITs, bonds) improves total expected return and helps sustain withdrawals over time.
- Inflation protection: greater exposure to growth assets helps preserve purchasing power versus a pure yield portfolio.
- Smoother sequencing risk management: can use glidepaths, bucketing, or dynamic withdrawal rules to reduce the risk of depleting assets after market downturns.
- Tax efficiency: manager can harvest losses, time sales, and use tax-aware withdrawal sequencing to reduce taxes vs. always collecting and taking taxable interest/dividends.
- Lower concentration risk: less need to concentrate on high yield but risky securities (which can cut payouts).
Tradeoffs and implementation consideration:
- Sustainability: high yields can be a trap—dividends/coupons can be cut. Total-return withdrawals require discipline to avoid over-withdrawing.
- Volatility: income-focused portfolios may be lower volatility but often deliver lower growth, increasing longevity risk.
- Total return approach: The portfolio is managed to maximize or optimize overall return (capital appreciation + dividends + interest). Income for spending is generated by a systematic withdrawal plan (selling assets as needed), not limited to interest/dividends. Managers use asset allocation, rebalancing, and withdrawal rules to smooth income and preserve capital over time.
Key advantages of the total return approach (expanded):
- Broader investable universe and higher expected long-term returns
- You’re not restricted to high yield securities. You can include growth stocks, low yield but high-growth sectors, diversified bonds, private assets, etc., which typically raise the portfolio’s expected return and reduce depletion risk over long horizons.
- Better inflation protection
- Growth assets (equities, real assets) generally offer superior long-term protection versus a yield sleeve composed largely of fixed income or mature dividend payers, which may lag inflation.
- Flexibility in down markets (rebalancing benefits)
- In market downturns, a total return plan can reduce withdrawals, rebalance into cheaper assets, or harvest tax losses. Income-focused portfolios that rely solely on cash flows can be forced to sell low-yield assets if dividends are cut.
Tools for managing sequencing risk:
- Use bucket strategies, e.g., Evensky & Katz Cash Flow Reserve
Tax optimization options
- Managers can time sales to take advantage of lower capital gains rates, harvest losses, and sequence withdrawals across taxable, tax deferred, and tax-free accounts to minimize taxes. Income-focused cash flows (especially ordinary interest) can be tax-inefficient.
Reduced concentration in “yield traps”
- Doesn’t force concentration in high yield, high risk securities (which may cut payouts or impair capital)
Main tradeoffs and risks:
- Sustainability vs. predictability
- Income focused: predictable short-term cash, but long-term sustainability may suffer if yields are low relative to spending needs—or if issuers cut payments.
- Total return: potentially higher sustainable long-term withdrawals, but income and portfolio value fluctuate and require disciplined withdrawal rules.
- Yield traps and credit risk
- Chasing yield can force exposure to lower quality credits, dividend cutters, or return free risk (e.g., high leverage REITs).
How long is the time horizon?
- Longer horizons favor total return for growth and inflation protection.
Final summary
- Total return: superior long-term sustainability, inflation protection, tax flexibility, and reduced concentration risk — but requires acceptance of portfolio volatility and disciplined withdrawal rules.
- Dividend/interest income: provides simple, predictable cash flow and behavioral comfort (for a limited time) but can limit long-term growth, may force concentration into risky high yield assets, and be vulnerable to cuts and inflation.
I have followed the market pitches for “income and dividend” investments for many years and find them generally depressing and dangerous for investors' well-being. The following are numerous examples. I have dozens more examples but thought including them all would be overkill.
One of my favorite nonsensical pitches is to highlight short term performance. What happened to focusing on the long term? Who cares about dominating for one year?
THESE 3 DIVIDEND ETFS CAN DOMINATE 2026. HERE’S WHY YOU SHOULD BUY NOW
Published (11/19/25)
SPDR Dow Jones Industrial Average ETF Trust (DIA)
Fidelity MSCI Utilities Index ETF (FUTY)
iShares International Select Dividend ETF (IDV)
5 Year (4/1/2026)
DIA 53%
FUTY 66%
IDV 83%
IVV (S&P 500) 76%
7 MONTHLY DIVIDEND STOCKS THAT CAN COLLECTIVELY DELIVER A MEAN ANNUAL 14%
Published 7/27/2025
One of the most unforeseen investment trends to emerge over the past few years is the level of strong interest demonstrated by Gen-Z in dividend stocks; an asset class category generally populated by retirees.
5 Year (4/1/2026)
Orchid Capital (ORC) -40%
IVV (S&P 500) 76%
Quite a ways to go for the 14% annual return.
THIS ETF HAS AN 8.4% DIVIDEND YIELD
Published 05/21/2021
The headline was extoling the opportunity of investing in the Granite Shares HIPS US High Income ETF (NYSE:HIPS). Needless to say, an exciting potential investment for someone looking for income.
Higher prices usually don’t benefit anyone, but inflation can be good for investors who are seeking income. It drives up prices, but it also drives up yields. Investors seeking income should consider this ETF.
5 Year (4/1/2026)
HIPS 29%
S&P 500 IVV 76%
https://www.benzinga.com/trading-ideas/dividends/21/05/21226313/this-etf-has-an-8-4-dividend-yield
And here’s even more examples:
Is Invesco High Yield Equity Dividend Achievers ETF (PEY) a Strong ETF Right Now?
Published 12/24/2025
5 Year (4/1/2026)
PEY 31%
S&P 500 IVV 76%
This ETF Pays an 8% Yield and Is Poised for Strong Growth in 2026 | The Motley Fool
Same song, second verse. – Published 1/22/2026
5 Year (4/1/2026)
PEY 31%
S&P 500 IVV 76%
https://www.fool.com/investing/2026/01/22/this-etf-pays-an-8-yield-and-is-poised-for-strong/
3 Dividend ETFs That Pay You Every Single Month Without Fail
Published 12/17/2025
5 Year (4/1/2026)
SPHD 41%
DIA 53%
S&P 500 IVV 76%
https://finance.yahoo.com/news/3-dividend-etfs-pay-every-193956299.html?fr=yhssrp_catchall
FBND Is Great, but Fidelity’s Other High Yield ETF Pays Twice as Much
Should Schwab U.S. Dividend Equity ETF (SCHD) Be on Your Investing Radar?
Published 12/17/2025
5 Year (4/1/2026)
FNDB 75%
SCHD 50%
S&P 500 IVV 76%
Want $10,000 In Passive Income? This Vanguard ETF Could Be Your Ticket to Making It Happen
Published 12/18/2025
5 Year (4/1/2026)
VYM 69%
S&P 500 IVV 76%
https://www.fool.com/investing/2025/12/18/want-10000-in-passive-income-this-vanguard-etf-cou/
The winner by far for the most nonsensical stories is 24/7 Wall St.
The Retirement Shift Toward Monthly Paycheck ETFs
Published 12/14/2025
5 Year (4/1/2026)
JEPI 49%
S&P 500 IVV 76%
5 Dividend ETFs That Pay More than 5% Yield Right Now
Published 1/21/2026
5 Year (4/1/2026)
SDIV 3%
DVYE 35%
VYM 69%
JEPIX 48%
DIVO 70%
S&P 500 IVV 76%
This Buffett ETF Also Pays Monthly Income, It’s Beautiful
Published 1/23/2026
5 Year (4/1/2026)
OMAH -10%
S&P 500 IVV 72%
I guess “beautiful” is in the eyes of the beholder.
CRYPTO
CATHIE WOOD SENDS BLUNT MESSAGE AFTER BITCOIN CRASHES
Published 1/31/2026
“Even right now, it feels like a "pivot moment" and while nobody knows what happens next, those who know can make huge gains.” Lorenzo Valente, ARK Invest's Director of Research, Digital Assets.
Hope spring’s eternal. As of 3/24/2026, BIT is trading at $69,787.
CRYPTO MARKET WIPES OUT A YEAR’S WORTH OF GAINS IN 6 WEEKS
Published (11/19/2025)
“The market is volatile” - Now there’s an understatement.
Like painstakingly simmering a perfect cheese roux only to immediately drop the container all over the kitchen floor on the way to the fridge, bitcoin has erased nearly a year’s worth of work in just six weeks.
The slide from its peak last month to yesterday’s $93,000 marks a 26% decline, putting it in what Wall Street considers a bear market.
That wasn’t the end of the slide. As of 3/24/2026 BIT was trading at $69,787
FROM MY LAST NEWSLETTER
Here’s why Bitcoin is likely to hit another record high by the end of March
Amid the anticipation, crypto trading expert Trading Shot has observed that based on technical indicators, Bitcoin is likely to see another all-time high by the end of March.
In a TradingView post on March 15, the analyst pointed out that the drop to $65,000 saw Bitcoin breaking below the four-hour MA50 and entering the green Ichimoku Cloud for the first time in the month, while also touching the bottom of the short-term channel up pattern.
Despite this dip, the analyst pointed out that this marks the second higher low for the pattern, indicating a potential continuation of the bullish trend. According to the expert, as long as the candles continue to close inside the channel up, investors should anticipate the bullish trend to persist, potentially leading to a break-out attempt towards the 3.0 Fibonacci extension at $90,000.
Pot of Gold or Lemmings?
OK, it’s March and I'm watching Bitcoin. It's only March 5th and Bitcoin is up almost 59% for the month. Can't argue that it's a pretty impressive return. Question is, is it real or are those chasing it headed for a cliff?
“Bullish trend?” I must admit, I really don’t understand most of the technical mumbo jumbo. As of 3/24/2026, BIT is trading at $69,924. So far looking like Lemmings.
A message from Advisor Perspectives and VettaFi: Discover something new! Click here to register for our upcoming webcasts.
Read more commentaries by Evensky & Katz and Foldes Financial Wealth Management
Membership required
Membership is now required to use this feature. To learn more:
View Membership BenefitsSponsored Content
Upcoming Virtual Events View All


