Extreme Earnings Forecasts Mask Stock Market Risk
Membership required
Membership is now required to use this feature. To learn more:
View Membership BenefitsIn elevated financial markets, risk is rarely eliminated. It is usually only relocated. During the run-up to the 2008 financial crisis, mortgage risk did not disappear. It was transformed, repackaged, and spread across the system in ways that made it appear safer than it was. When the cycle turned, that risk reappeared all at once and in places investors had not fully recognized.
A similar shift is occurring today in earnings forecasts and the stock market — different in scale, but familiar in structure. As price-to-forward earnings ratios have declined in recent months, equities have appeared cheaper. But that change is not coming from price. It is coming from rising earnings expectations. The risk that investors would normally observe as extreme valuations has been increasingly relocated to extreme and uncertain forward earnings estimates, making the market appear safer by lowering price/earnings multiples.
This dynamic has taken on greater importance following a widely shared chart in recent weeks comparing the drawdown and recovery in the S&P 500 Index (the blue line, in the chart below) with the drawdown and recovery in the price-to–12-month forward EPS ratio (the orange line). It’s an important chart, not only because it has been so frequently discussed in financial media, but also because it may be influencing both the market’s rebound and how investors are assessing valuations.
With the price-to-forward earnings ratio below its prior highs, equities appear to offer better value than they did late last year. That may prove true if earnings expectations are realized. But it is important to understand what is driving these calculations.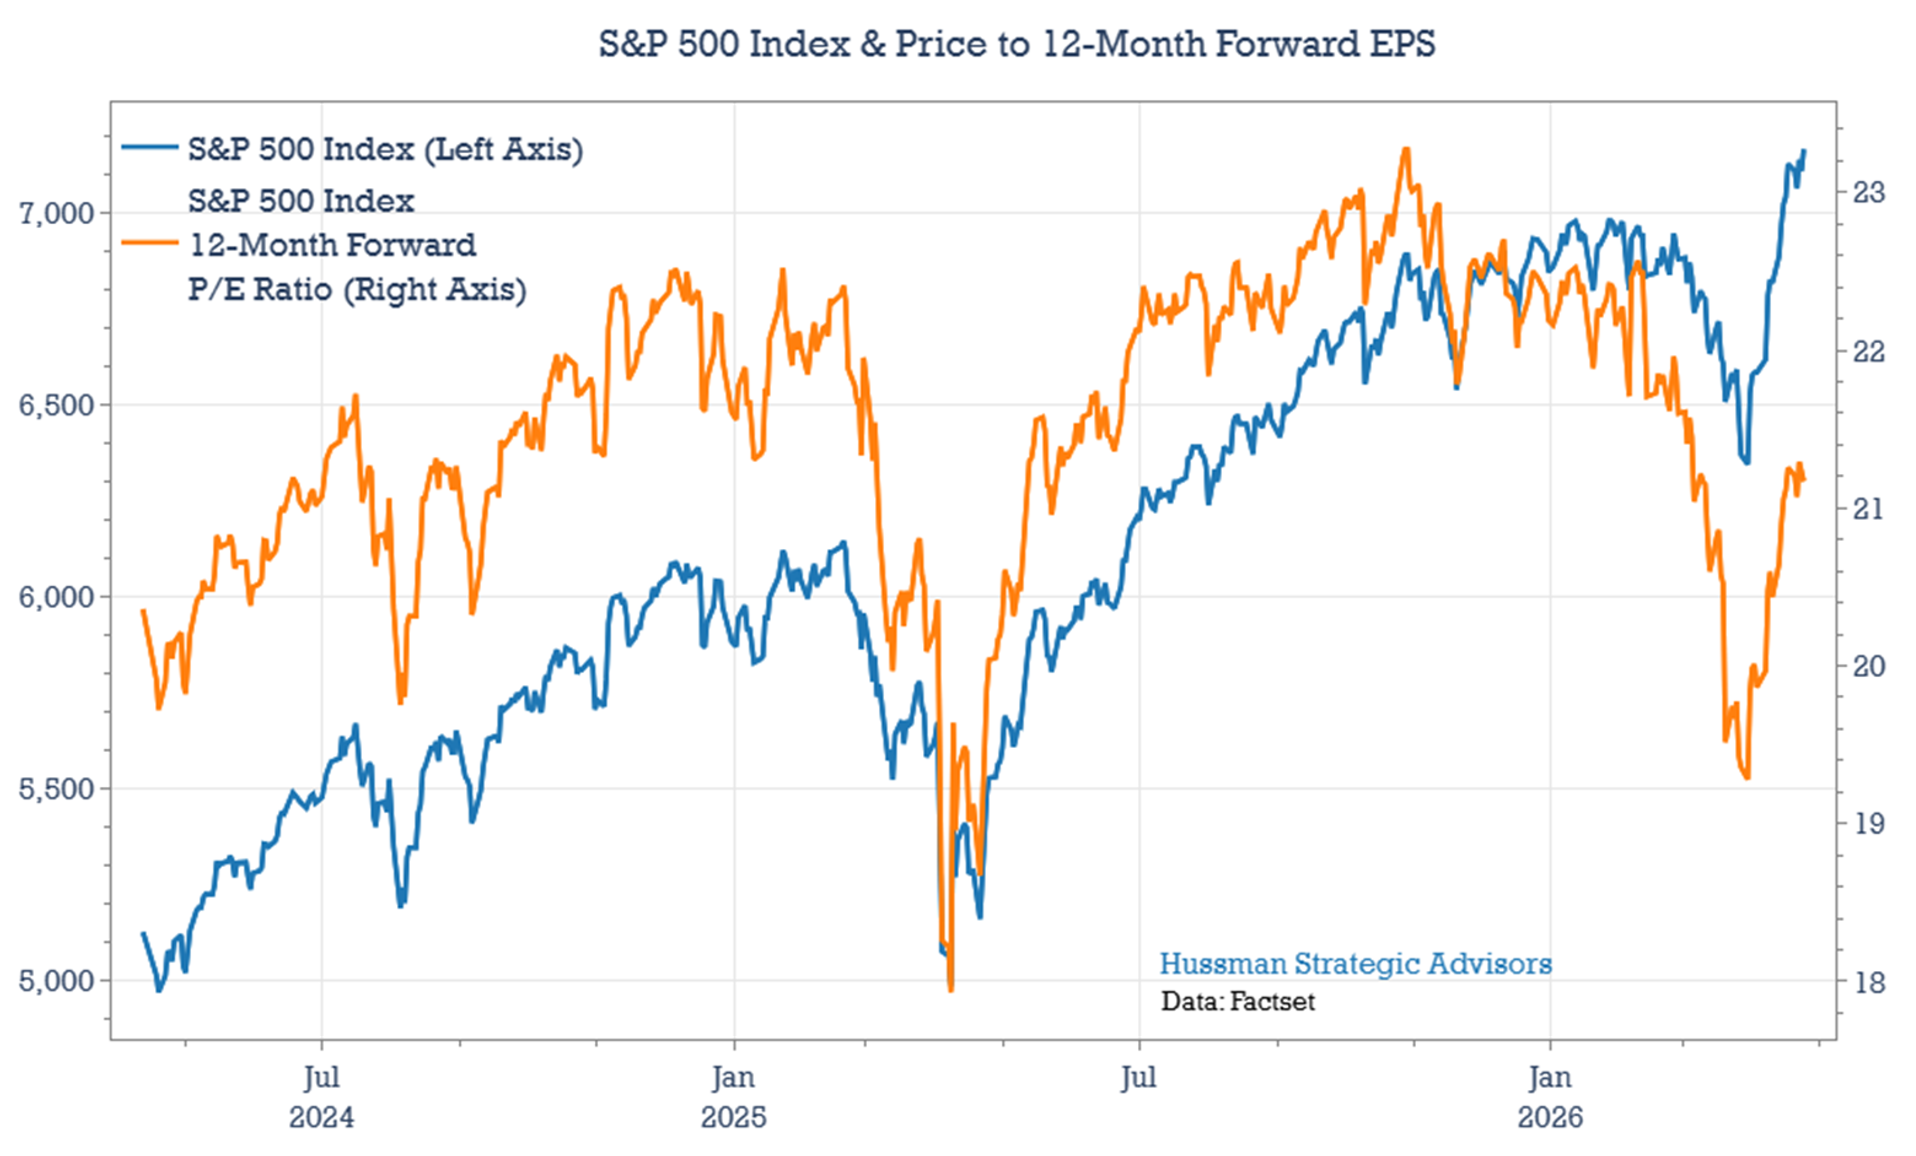
The primary reason price multiples based on forward earnings (P/FE) have declined more than the market itself is that analysts have continued to aggressively raise their earnings estimates. Since February, year-ahead earnings have increased by roughly 10%, to $338 from $308 per share. Notably, the largest increase occurred in mid-March, even as the market was selling off. This divergence helps explain why the P/FE ratio fell more sharply than the index during that period.
Because the ratio reflects a current price relative to expected earnings, the riskiness of an investment in the index lies in one of two places: the multiple investors are willing to pay, or the expectations for the earnings themselves. This year, the risk is shifting from the more visible multiple toward uncertain earnings expectations.
Historically, it’s rare to see such a large divergence between declines in index levels and the P/FE ratio. Earnings expectations typically do not rise during market sell-offs. More often, they fall, particularly when the downturn is driven by economic concerns. The chart below shows rolling drawdowns for the S&P 500 Index (in orange) and the P/FE ratio (in blue).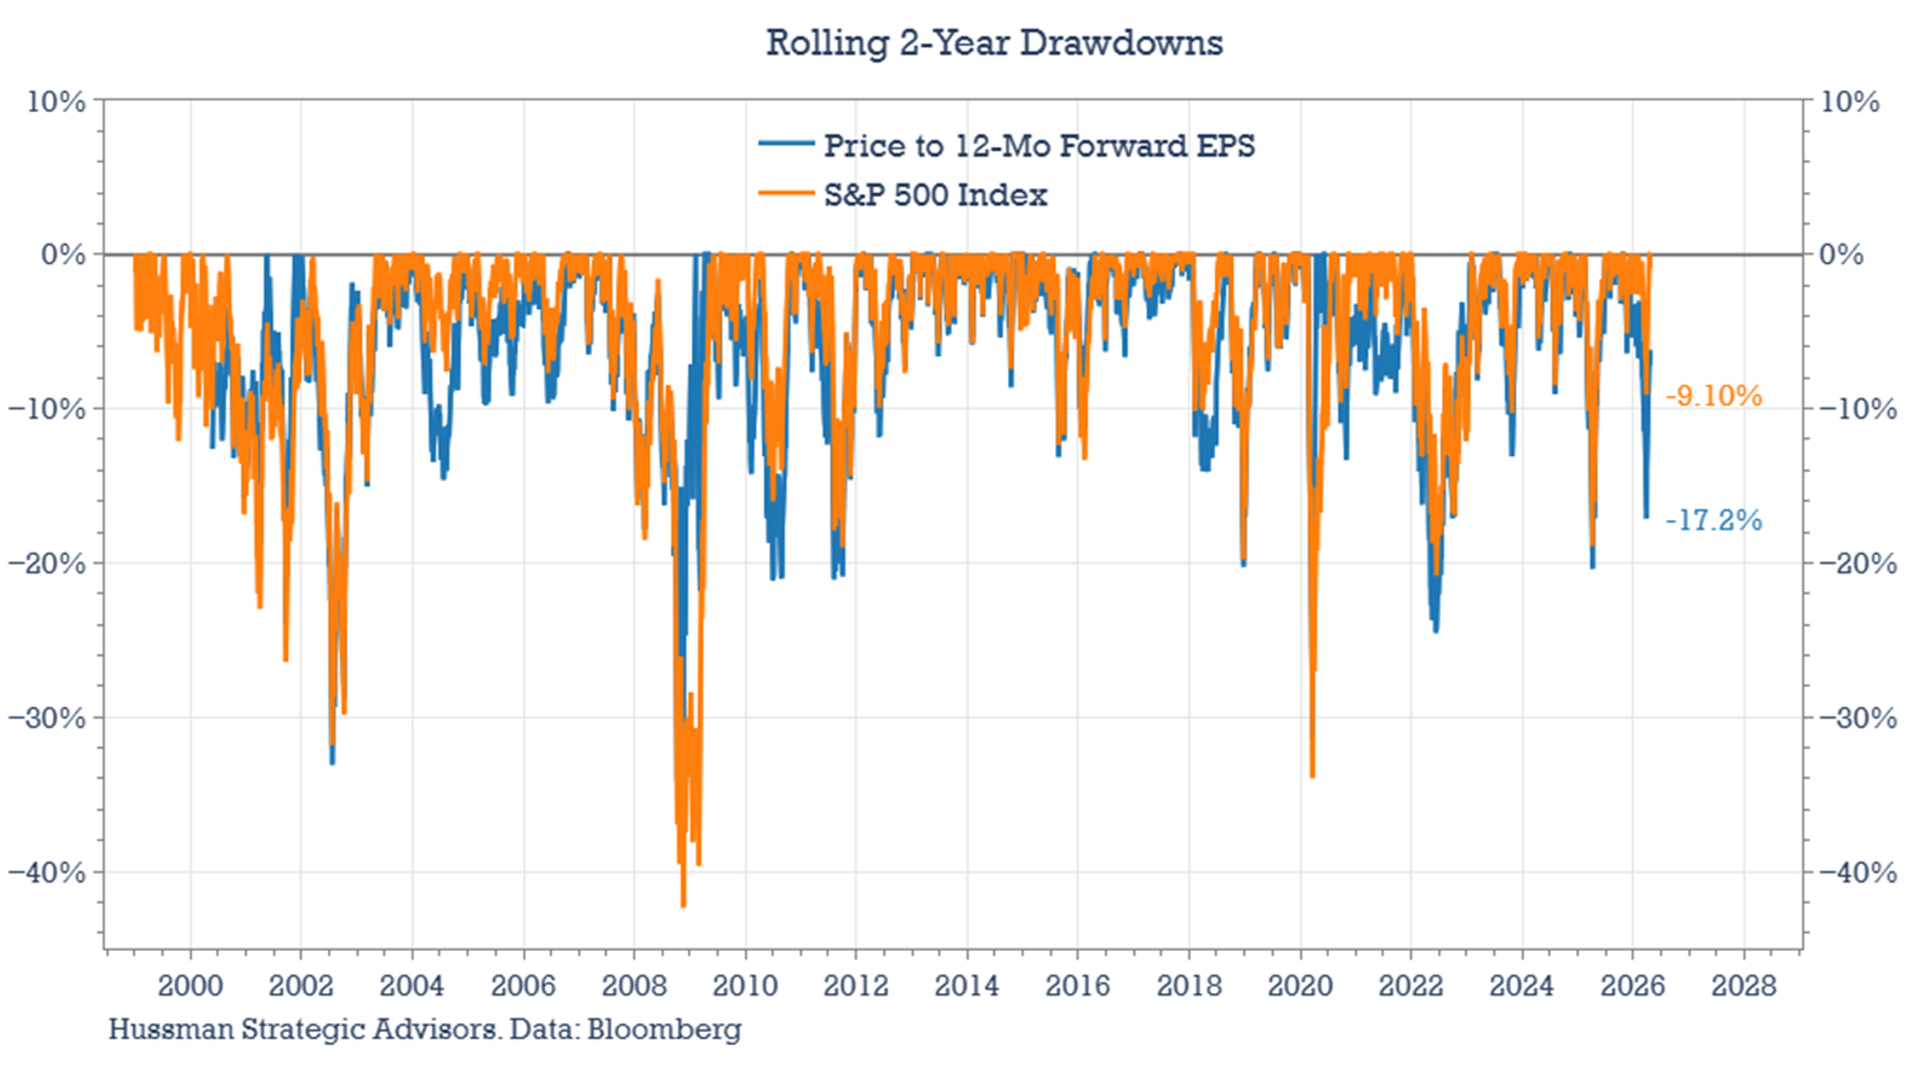
The data suggest that prices and multiples usually move together, with relatively small gaps between them. By contrast, the recent divergence stands out. The recent gap between the magnitude of the market’s decline and the contraction in the P/FE ratio at the low is among the largest on record.
The Expectations in Expected Earnings
We can break expected earnings into two components: expected sales growth and expected margin expansion. Sales growth is the initial driver. In the chart below, on the left is sales growth, including the past six years of quarterly data alongside forecasts for 2026 through 2028. On the right is expected earnings per share growth over the same time period.
In the sales chart, I’ve also included year-over-year nominal GDP growth. Over the past 20 years, real GDP growth and real sales growth for the largest U.S. companies have been nearly identical, each averaging just under 2% annually. Including inflation brings long-term nominal sales growth to roughly 4.5%.
Sales do not track GDP perfectly quarter to quarter — at times they run above trend, at others below — but they tend to converge over time. I’ve also included consensus forecasts for real GDP and inflation, which together imply nominal growth of a little over 4%.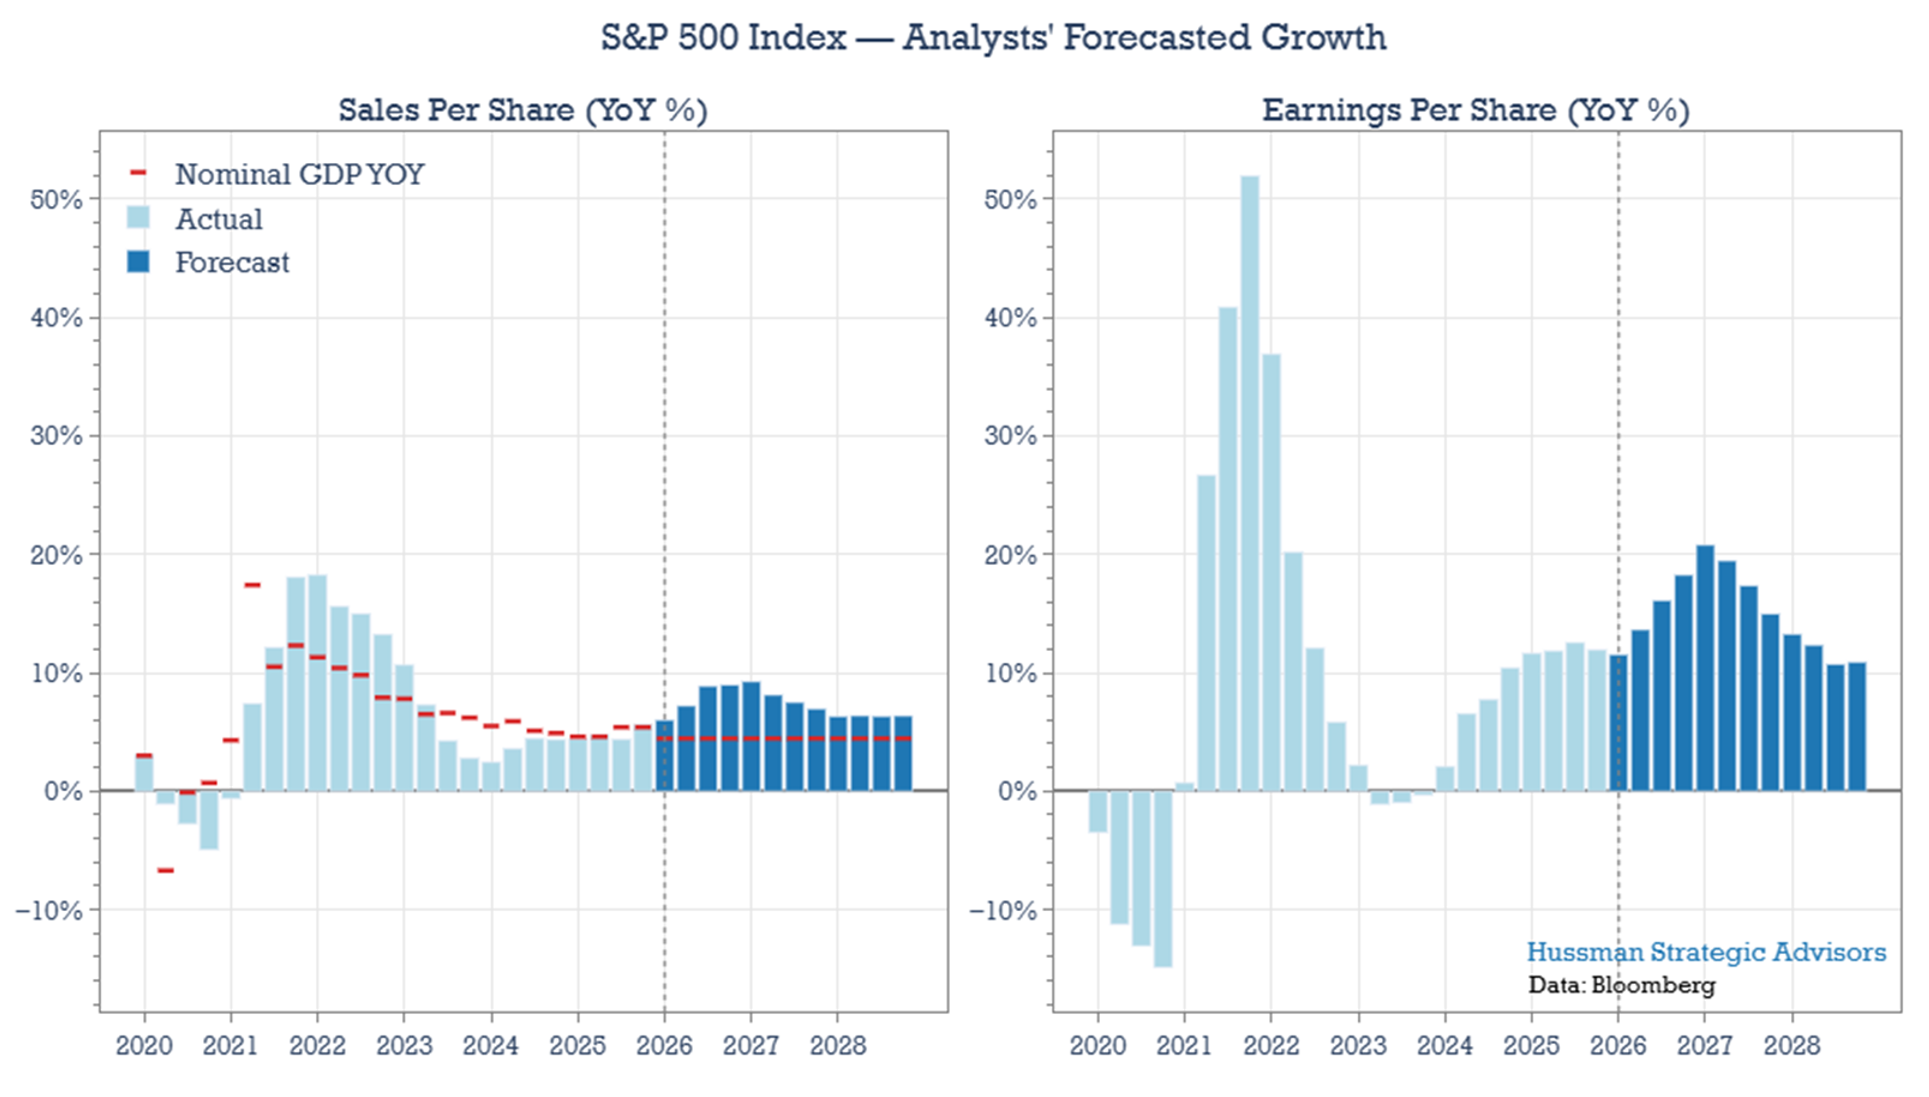
Two observations stand out. First, current forecasts, especially for next year, imply sales growth at roughly twice the expected pace of GDP. Historically that typically has occurred when the U.S. economy was coming out of a recession. Second, sales growth is projected to exceed GDP growth for each of the next three years. This would not be unprecedented, but taken together, these assumptions represent the first clear sign of elevated optimism in the forecasts.
On the earnings side, expectations are even more ambitious. Earnings growth is projected to run at roughly twice the pace of sales growth, implying meaningful margin expansion. For example, earnings are expected to grow by about 20% in 2027. This is again the type of growth that typically occurs in post-recession environments, when sales rebound and labor costs remain below pre-contraction levels.
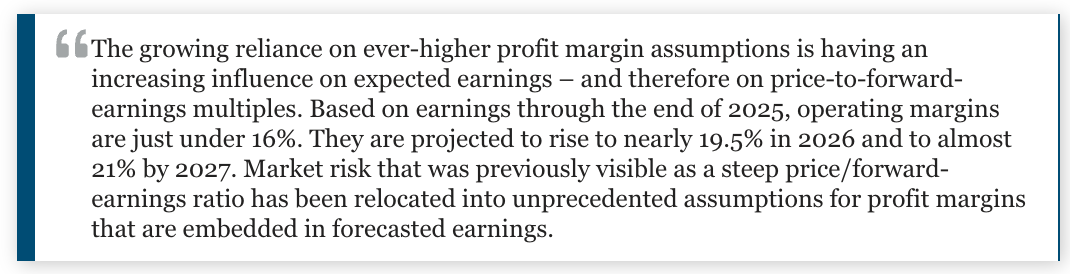
The bridge between roughly 9% sales growth and 20% earnings growth is a significant increase in margins. This is where the most optimistic assumptions are embedded and will be the primary focus of the remaining discussion. Currently, based on earnings through the end of 2025, operating margins are just under 16%. They are projected to rise to nearly 19.5% in 2026 and to almost 21% by 2027.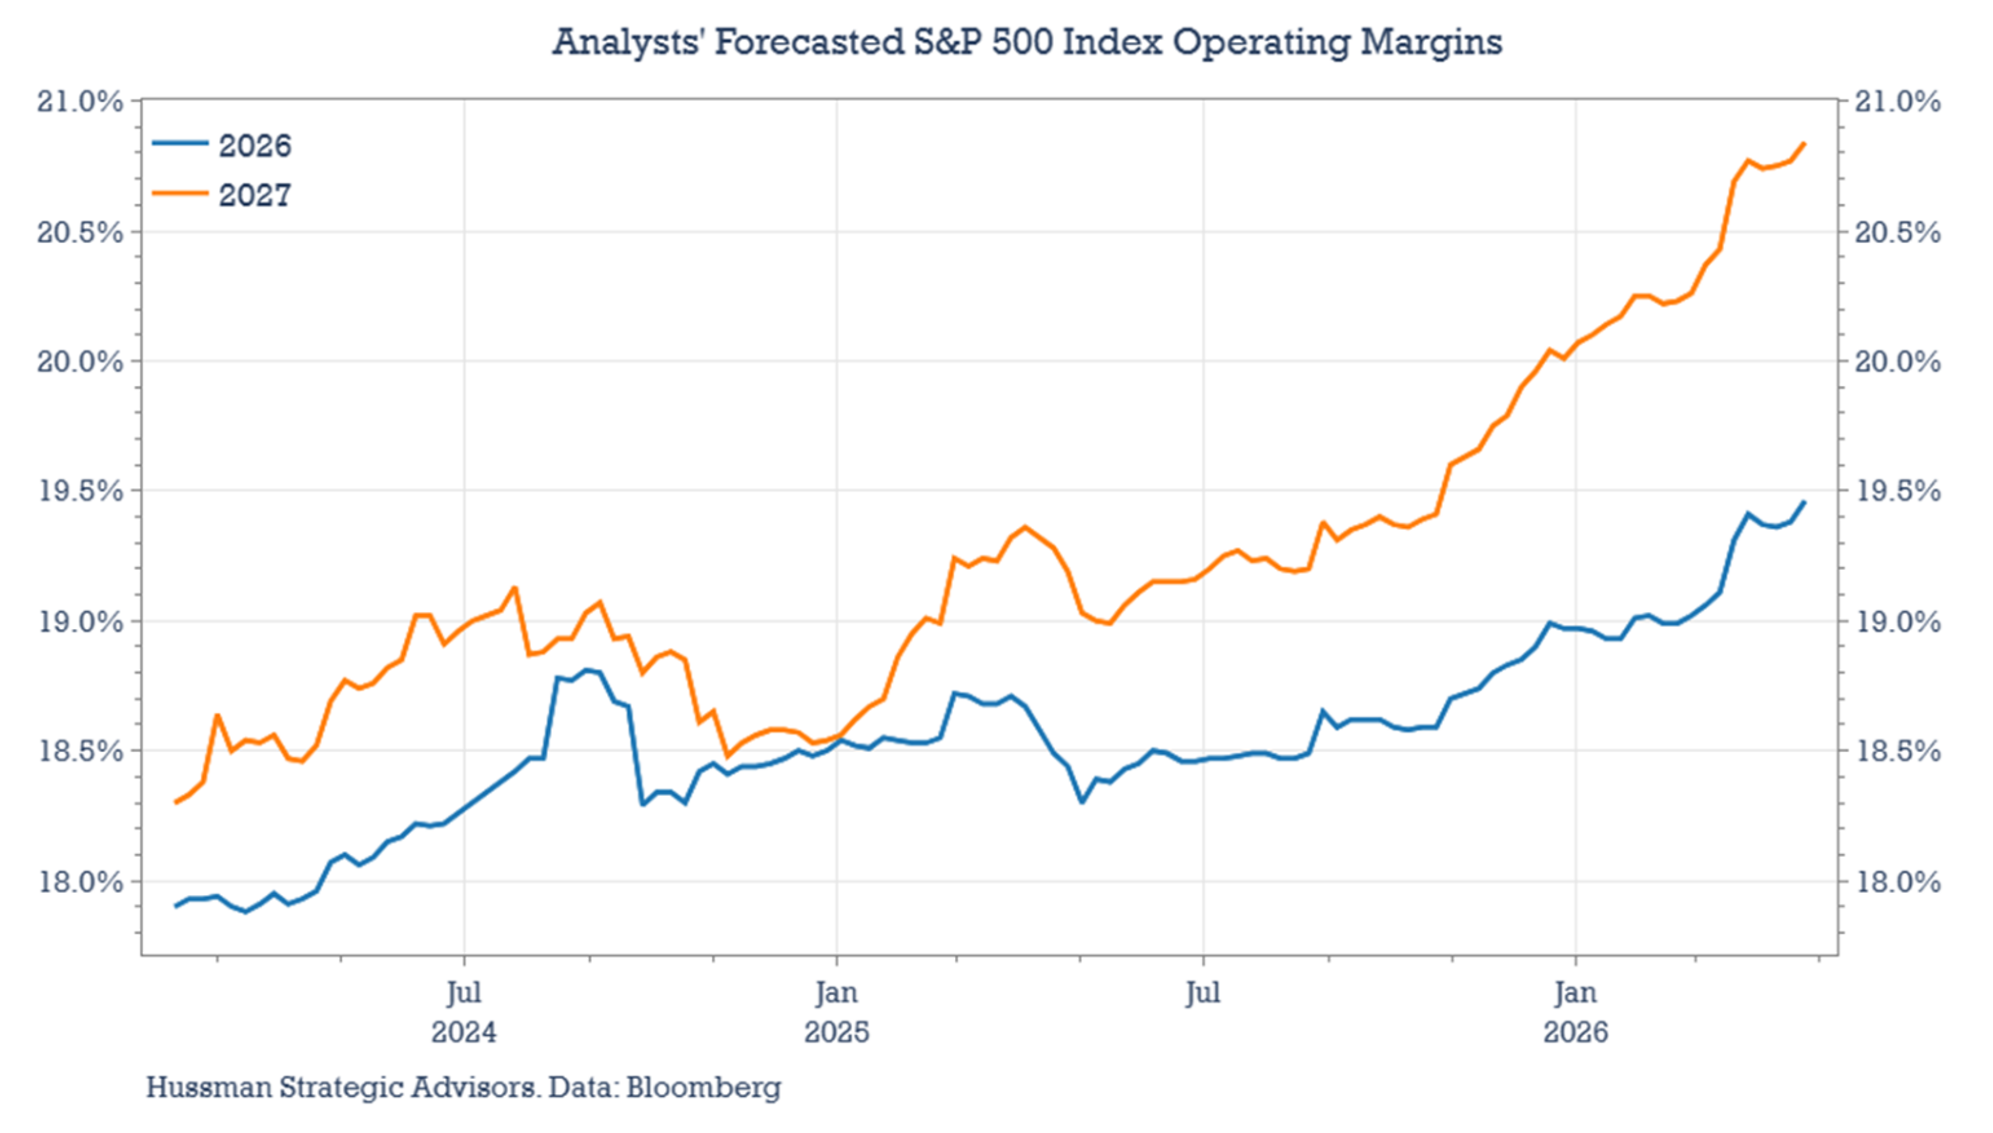
One possible explanation for the recent shift in earnings expectations and margin forecasts is the growing influence of artificial intelligence. Much as the enthusiasm surrounding AI has driven dispersion across equity markets – boosting semiconductor stocks while weighing on segments of software, for example – it also appears to be shaping expectations for corporate profitability.
The timing is interesting. The acceleration in margin forecasts began last year, roughly coinciding with the introduction of coding agents such as Anthropic’s Claude Code and OpenAI’s Codex. These tools have delivered tangible productivity gains for users, particularly in tasks like coding, analysis, and model building. It’s possible that analysts, experiencing these gains firsthand while constructing financial models, have extrapolated them to the broader corporate landscape.
If so, that extrapolation is doing meaningful work in current forecasts. The implied margin expansion points not just to isolated efficiency gains, but to a broad-based improvement in profitability across companies and sectors. In other words, the expectations embedded in earnings estimates assume that the benefits of AI will be both significant and widely distributed – and, importantly, realized quickly. This is the component of earnings expectations that appears the most ambitious.
Profitability Expectations Broaden
If that’s the case, analysts are effectively assuming that this surge in profitability will be broad-based – cutting across companies of all sizes and industries, with expectations for significantly higher margins across the board. The chart below shows the path of expected profit margins from current levels through 2026 and 2027. The top section shows margins for S&P’s large, mid-sized, and small company indexes. The bottom section shows the path of margins for sectors in the S&P 500 index.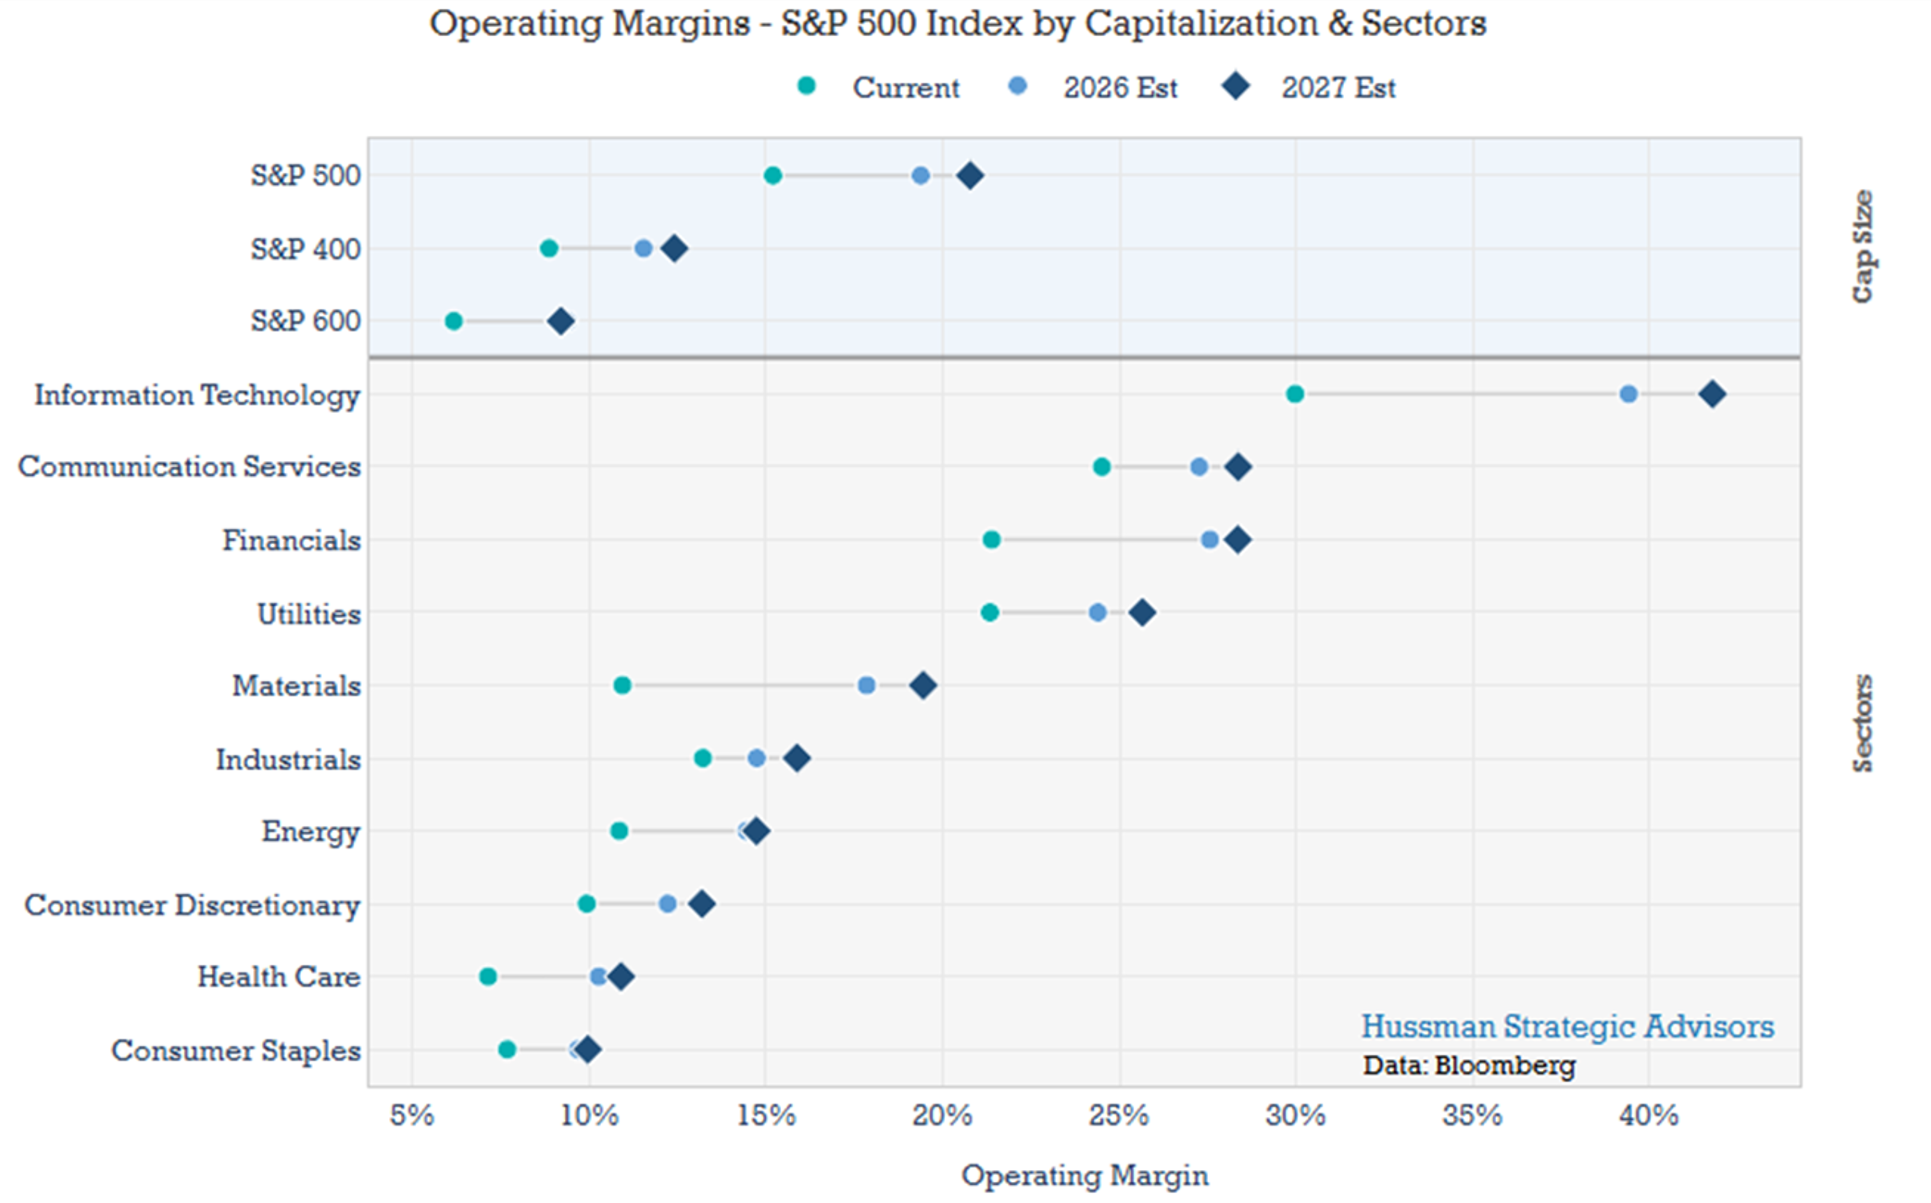
The chart highlights several risks embedded in current earnings expectations. First, the anticipated improvement in profitability is remarkably broad. Across companies of all sizes and sectors, expectations are optimistic for most publicly traded firms. By these assumptions, there are few, if any, losers from the adoption of AI – only uniform gains in productivity across the economy. And again, these benefits are expected to materialize relatively quickly.
Second, the largest sectors in the S&P 500 – Information Technology and Communication Services, which together account for nearly half the index – are projected to become significantly more profitable. For example, the profit margin of the Information Technology sector is projected to increase by 12 percentage points, reaching roughly 42%. What was once the domain of only a handful of the most highly profitable companies is now expected to extend across an entire sector.
One additional point is worth emphasizing. If we do see a meaningful and sustained increase in operating margins – margins before interest and taxes – it would represent a full-scale structural shift, not simply a continuation of an existing trend. That distinction matters, because many investors seem to assume that operating margins have been rising steadily and can continue to do so without constraint.
To highlight this point, the charts below present three data series side by side. Each chart includes a trend line to summarize the direction and rate of change in the data. Trend lines are imperfect tools. They can be influenced by the choice of start and end points, as well as by outliers in the data. But they provide a reasonable way to estimate changes in margins and to understand how expectations for those changes are evolving.
The first set of charts focuses on the S&P 500 Index. The chart on the left shows the long-term trend in profit margins, which have risen over the past 20 years.
The middle chart shows operating margins, or earnings before interest and taxes. While these have also increased, the pace has been more modest – roughly half the rate of the rise in overall profit margins (and as discussed below, the largest companies have driven much of this increase). In other words, a significant portion of the improvement in profit margins has been driven by lower corporate taxes and declining interest costs.
The third chart incorporates forward estimates of operating margins and highlights the current optimism embedded in expectations for continued margin expansion. Companies are expected to improve operating margins at a much faster pace than they have over the past 15 years.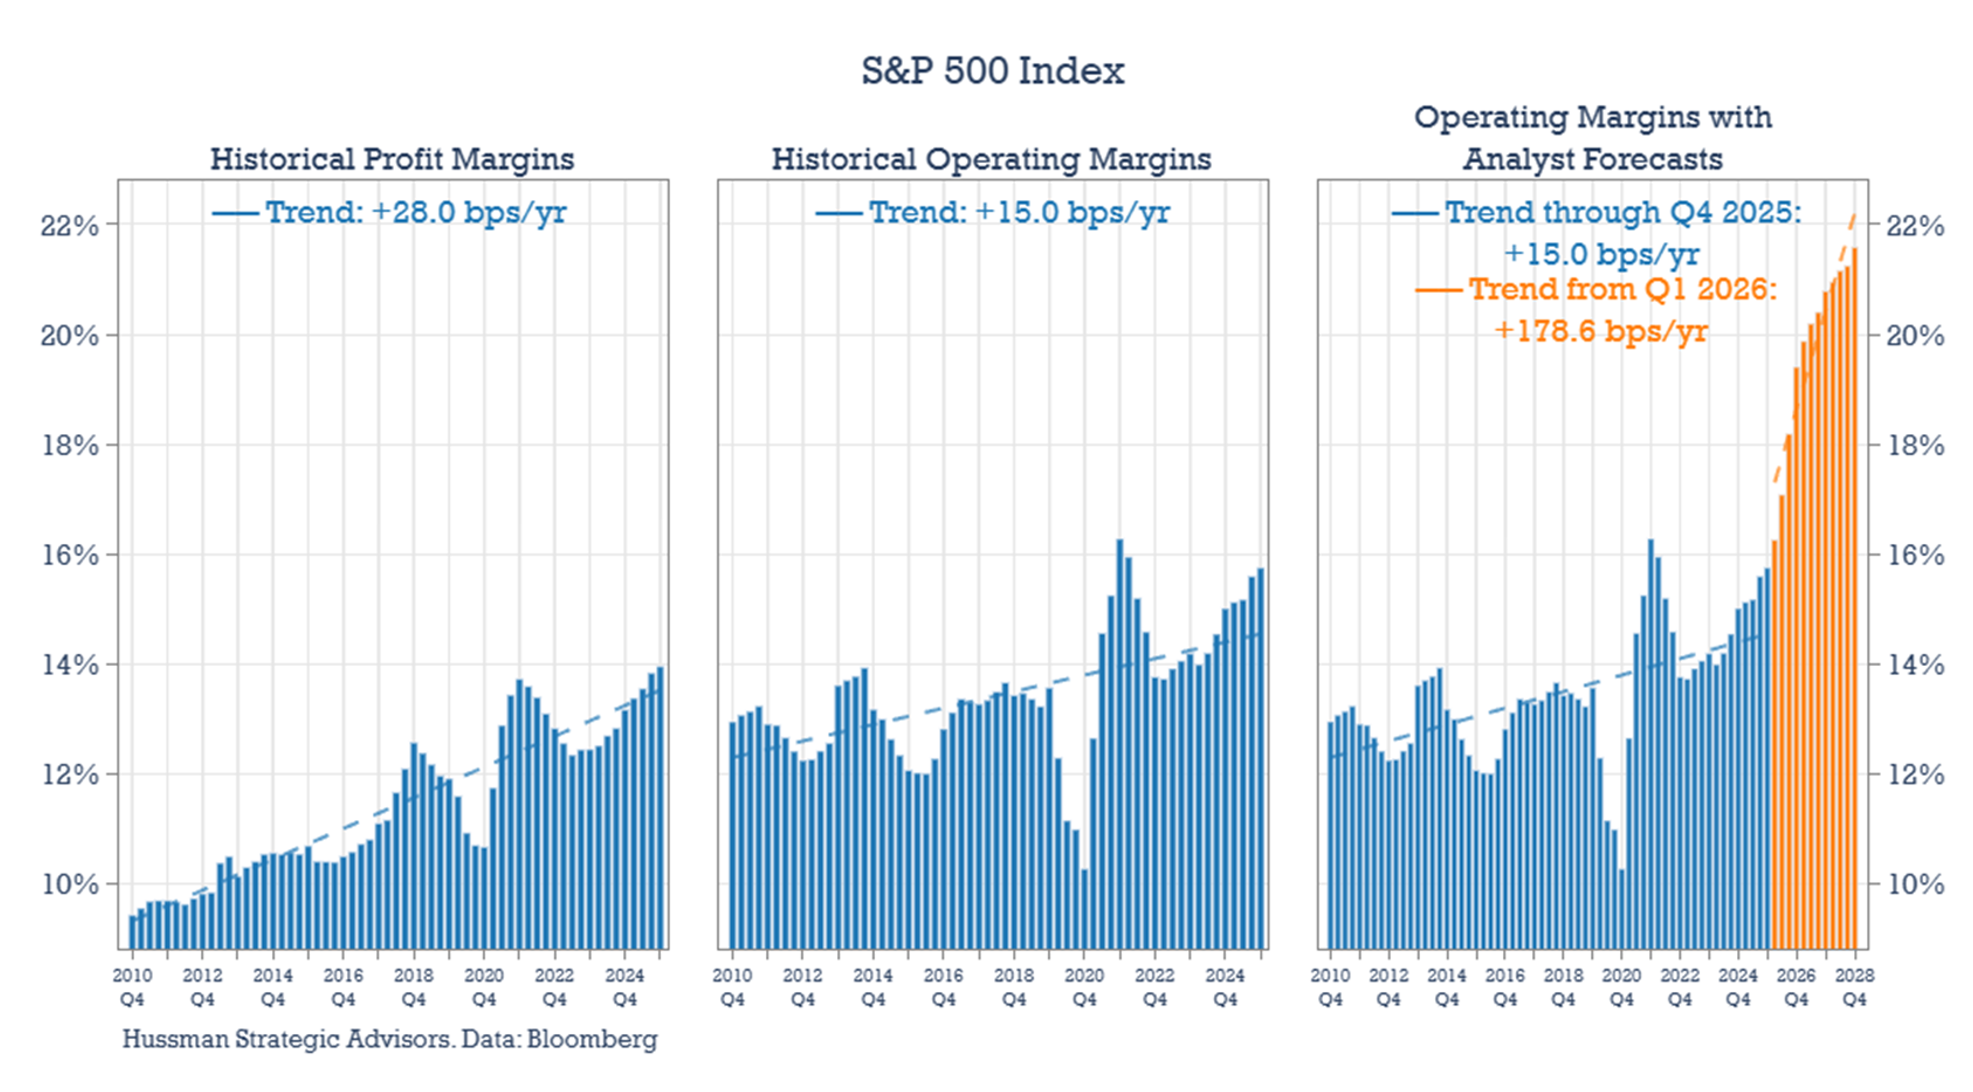
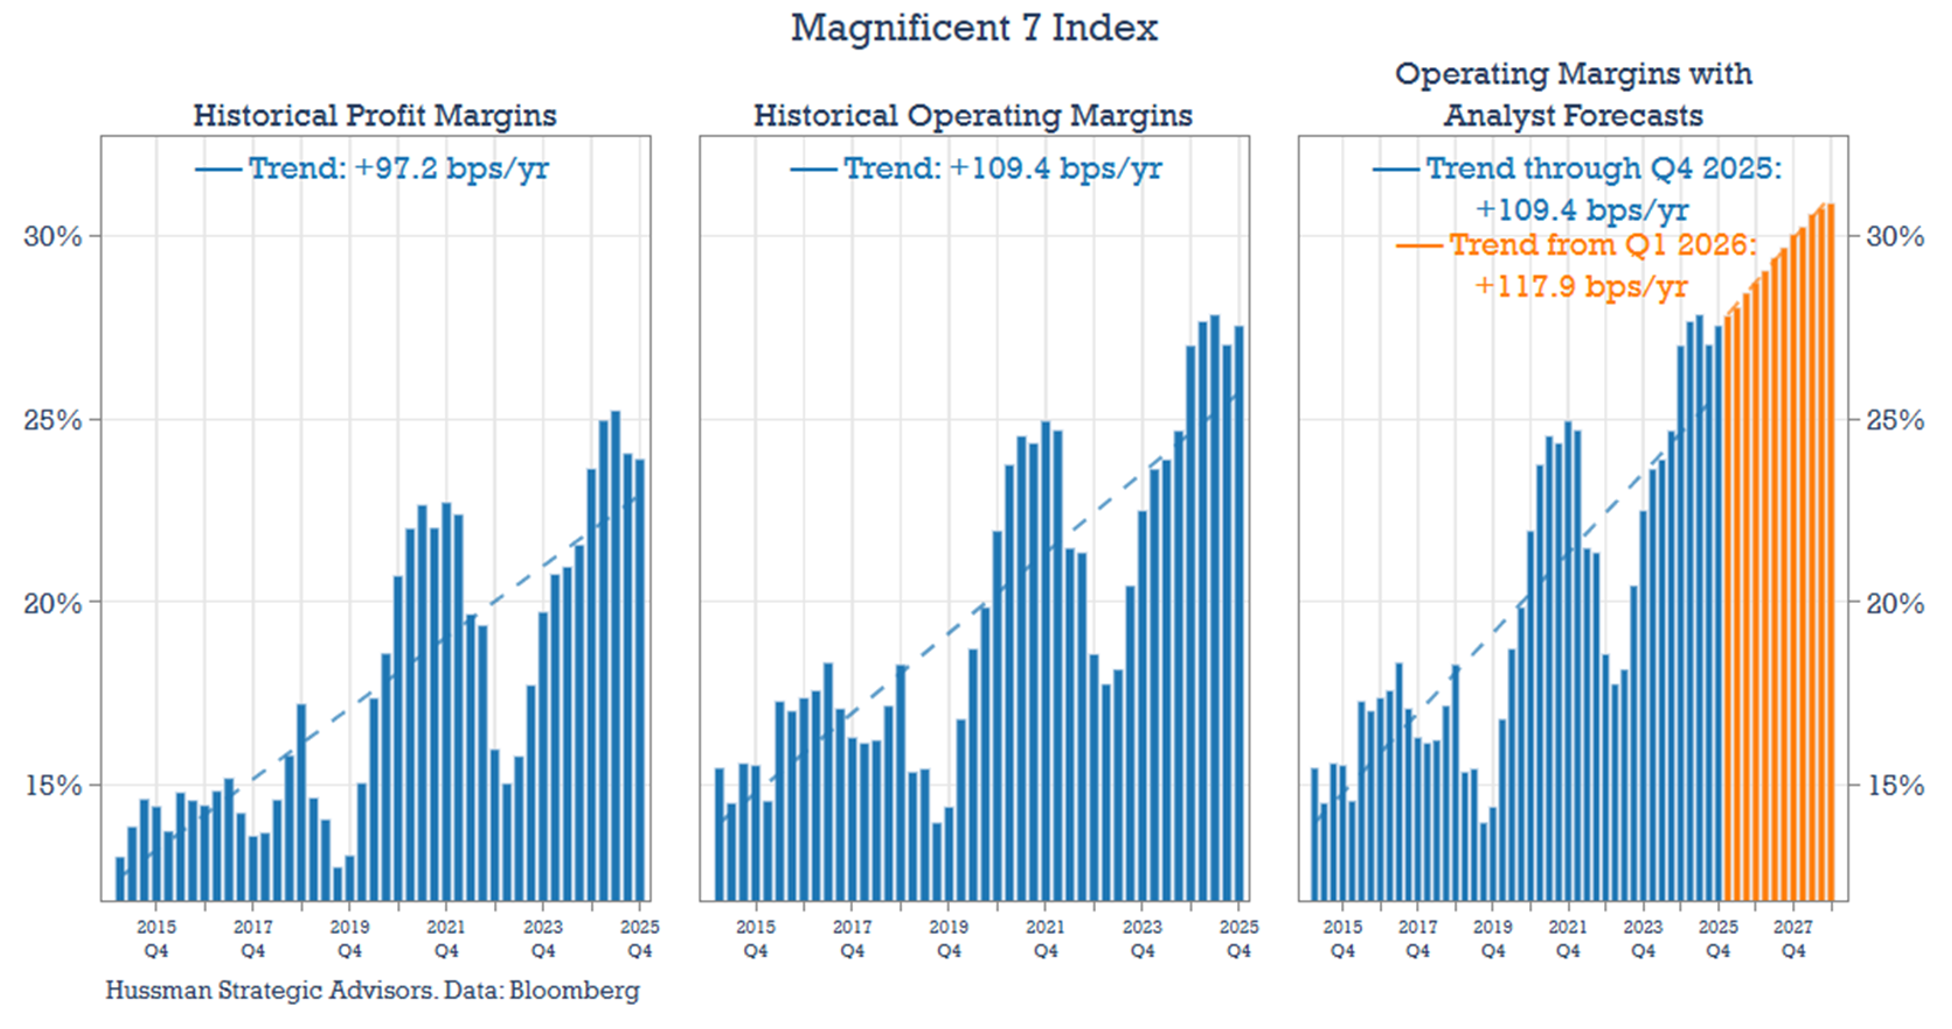
The structural shift in profit margins would have to be particularly steep among stocks that don’t happen to fall into the list of the very largest stocks. The performance of the Magnificent 7 stocks (Alphabet, Amazon, Apple, Microsoft, Meta, NVIDIA, and Tesla) over the past decade has been exceptional – especially relative to the rest of the market. Margin expectations for the Mag-7 basically extrapolate the diagonal trend of recent years. That said, they are also some of the most highly valued stocks and therefore have the most to lose if those historical trends fail to hold.
Two characteristics stand out for the Magnificent 7 stocks, which are shown in the chart below. First, profit margins and operating margins have risen in tandem, by roughly 1 percentage point per year. This pattern partly reflects their historically low debt levels, which reduce the drag from interest costs. Second, while current forecasts remain optimistic, they are broadly in line with the trajectory of the past decade. Analysts expect margins to continue expanding at roughly 1.2 percentage points per year. In effect, these expectations assume there is no end in sight for the rise in this group’s dominance and profitability.
When we separate out the rest of the S&P 500 – the other 493 companies – a very different picture emerges. Profit margins have trended higher, rising by about 18 basis points per year. Operating margins, however, have been less impressive, increasing at a little more than half that pace. Today, the margins of this group are only modestly above levels seen during the 2016–2019 period.
Forward profit margin expectations for these 493 companies are strikingly disconnected from the trend of recent years. Operating margins are projected to rise from roughly 13% to more than 19%, an increase of nearly 2 percentage points per year. That represents a sharp acceleration. What was once largely a margin expansion story concentrated in large-cap technology stocks is now projected to extend much more broadly across the corporate sector.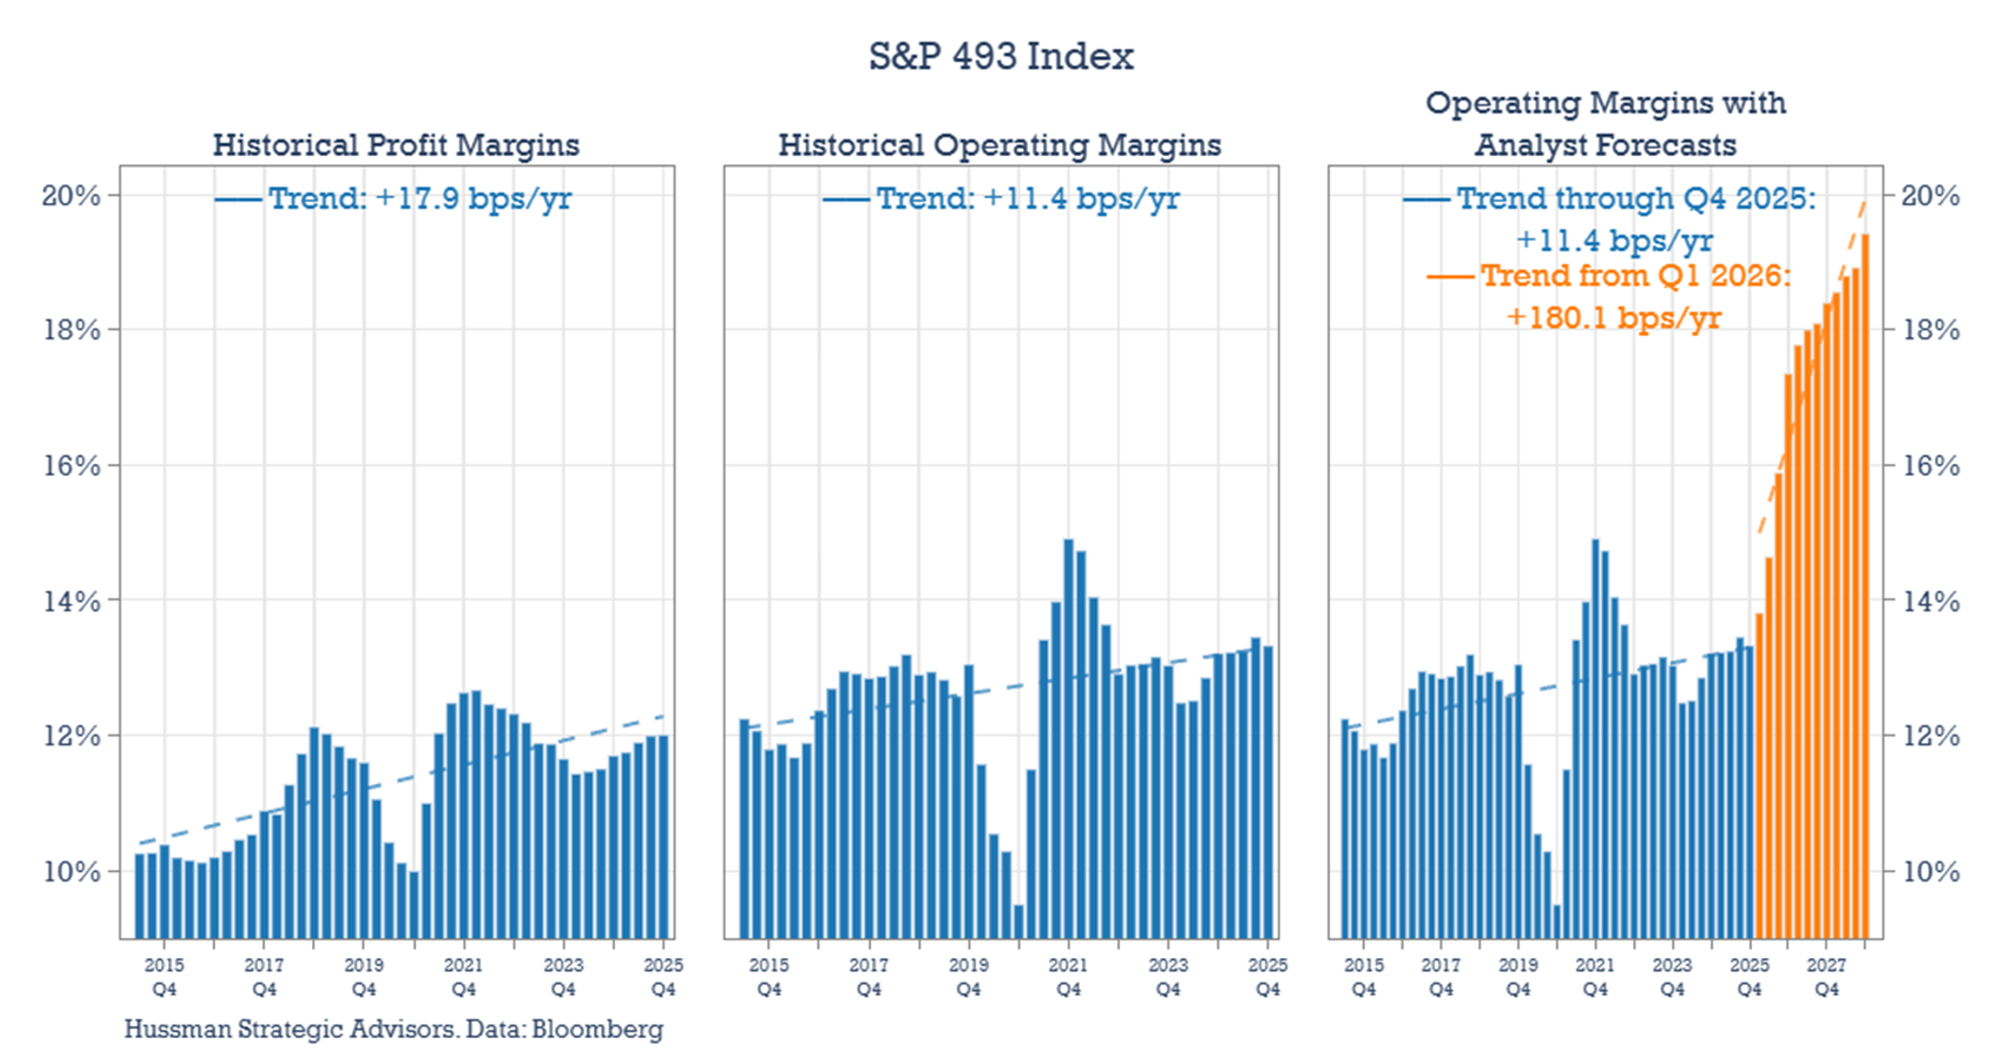
The same optimism is being applied to mid-cap and small-cap companies. That likely helps explain the relative outperformance of smaller companies versus large caps over the last six months, especially prior to the start of the Iran war.
It’s important to understand why different groups of stocks are moving – and whether the underlying assumptions about fundamentals are reasonable. The chart below shows the same analysis for the S&P 600 Index, which tracks smaller companies and is generally considered a higher-quality subset relative to the Russell 2000. (The results for the S&P 400, the mid-cap index, has similar trends to the S&P 600 Index.)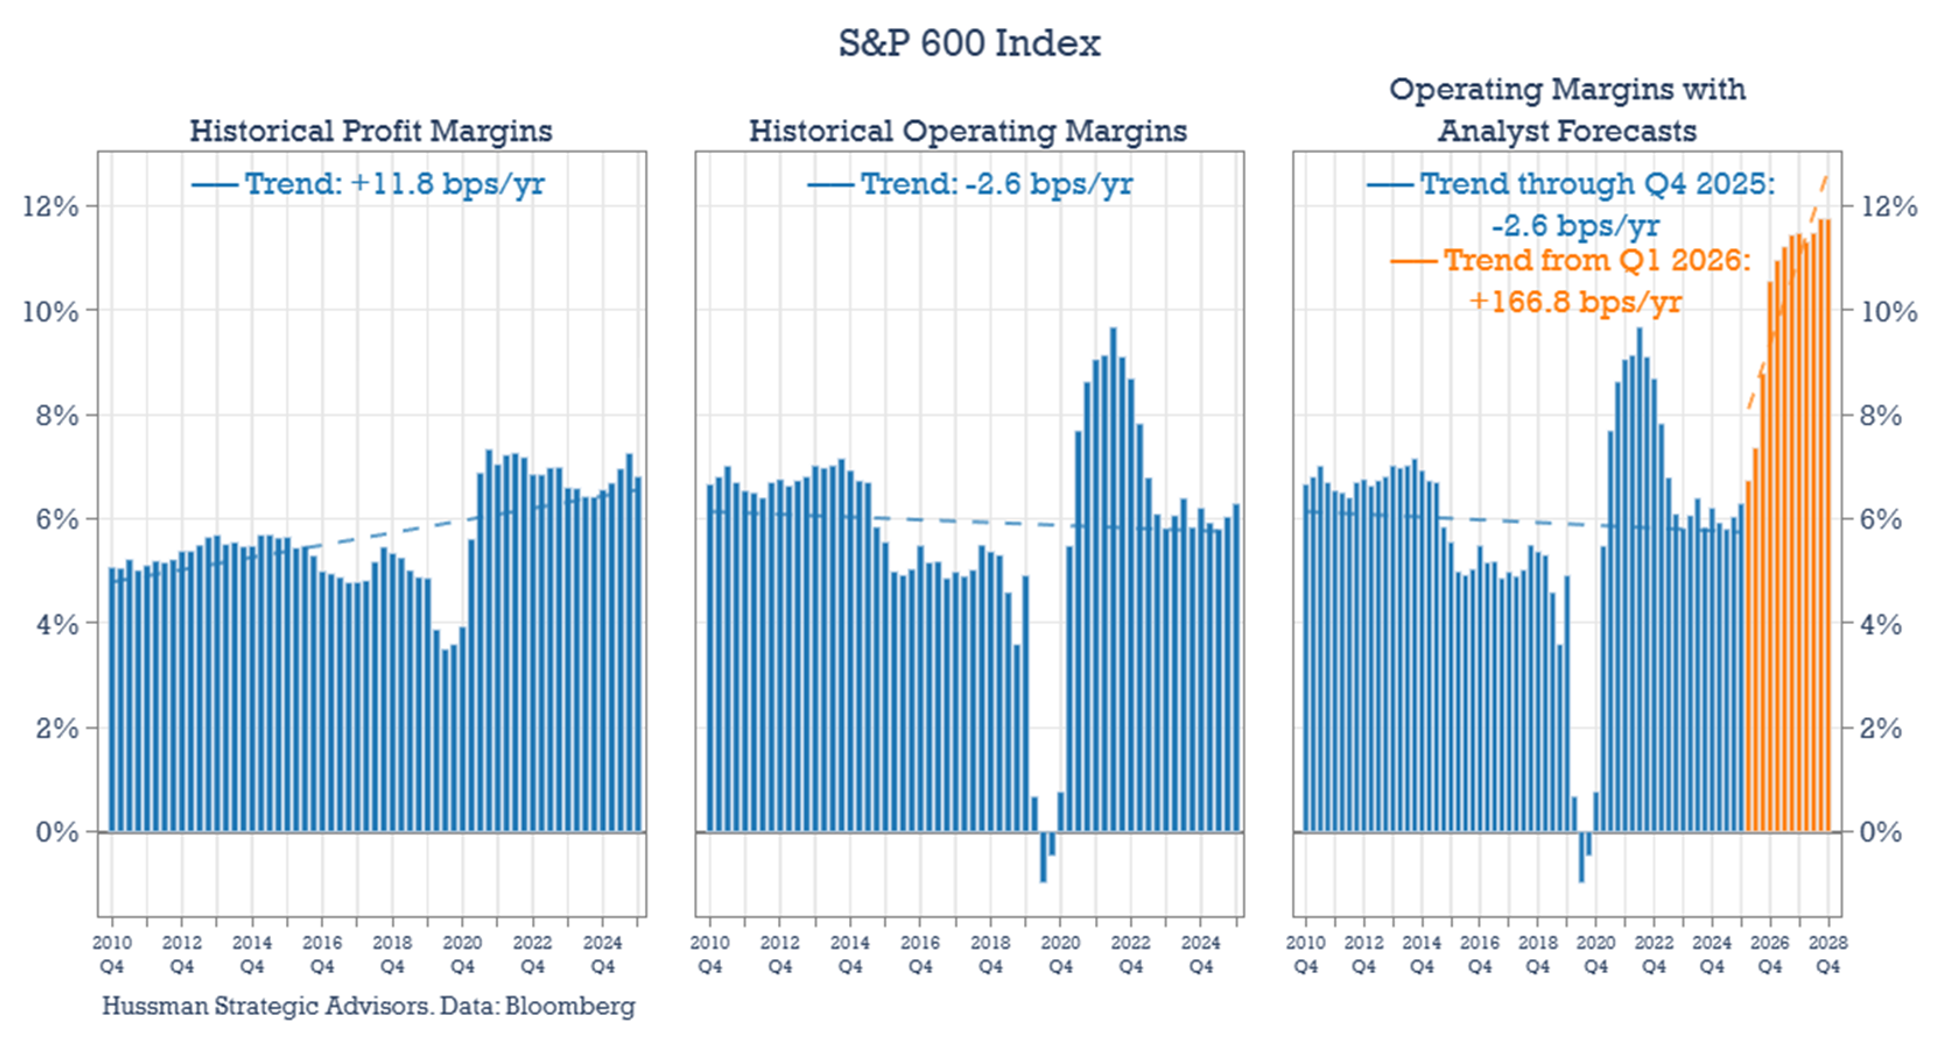
Here we see the same characteristics observed earlier. First, profit margins have drifted higher over the past decade. Second, operating margins have been largely flat to down slightly, suggesting that most of the improvement in profit margins has not come from improvements in their core operating performance. Third, and most notably, expected operating margins are projected to rise sharply – by roughly 160 basis points per year – implying a near doubling of margins by 2028.
The final chart in this series considers the Philadelphia Stock Exchange Semiconductor Index (SOX). It is an important index because it has played a leading role in driving U.S. equity markets higher this year. Although semi stocks represent less than 15% of the MSCI U.S. Index, they have accounted for nearly 40% of the advance since the March low. Roughly a dozen stocks in the index are up more than 40% from the bottom, reflecting strong investor enthusiasm for the sector.
Look at the expectations embedded in forward earnings. I’ve removed the trend lines because operating margins for semiconductor companies have not followed a steady upward trajectory historically. Instead, they have oscillated through recurring boom-and-bust cycles. Yet current forecasts tell a very different story. Operating margins are projected to roughly double and, over the forecast horizon, remain stable at those elevated levels. These are the types of optimistic assumptions that, while not immediately visible, have been steadily accumulating in earnings expectations over the past year.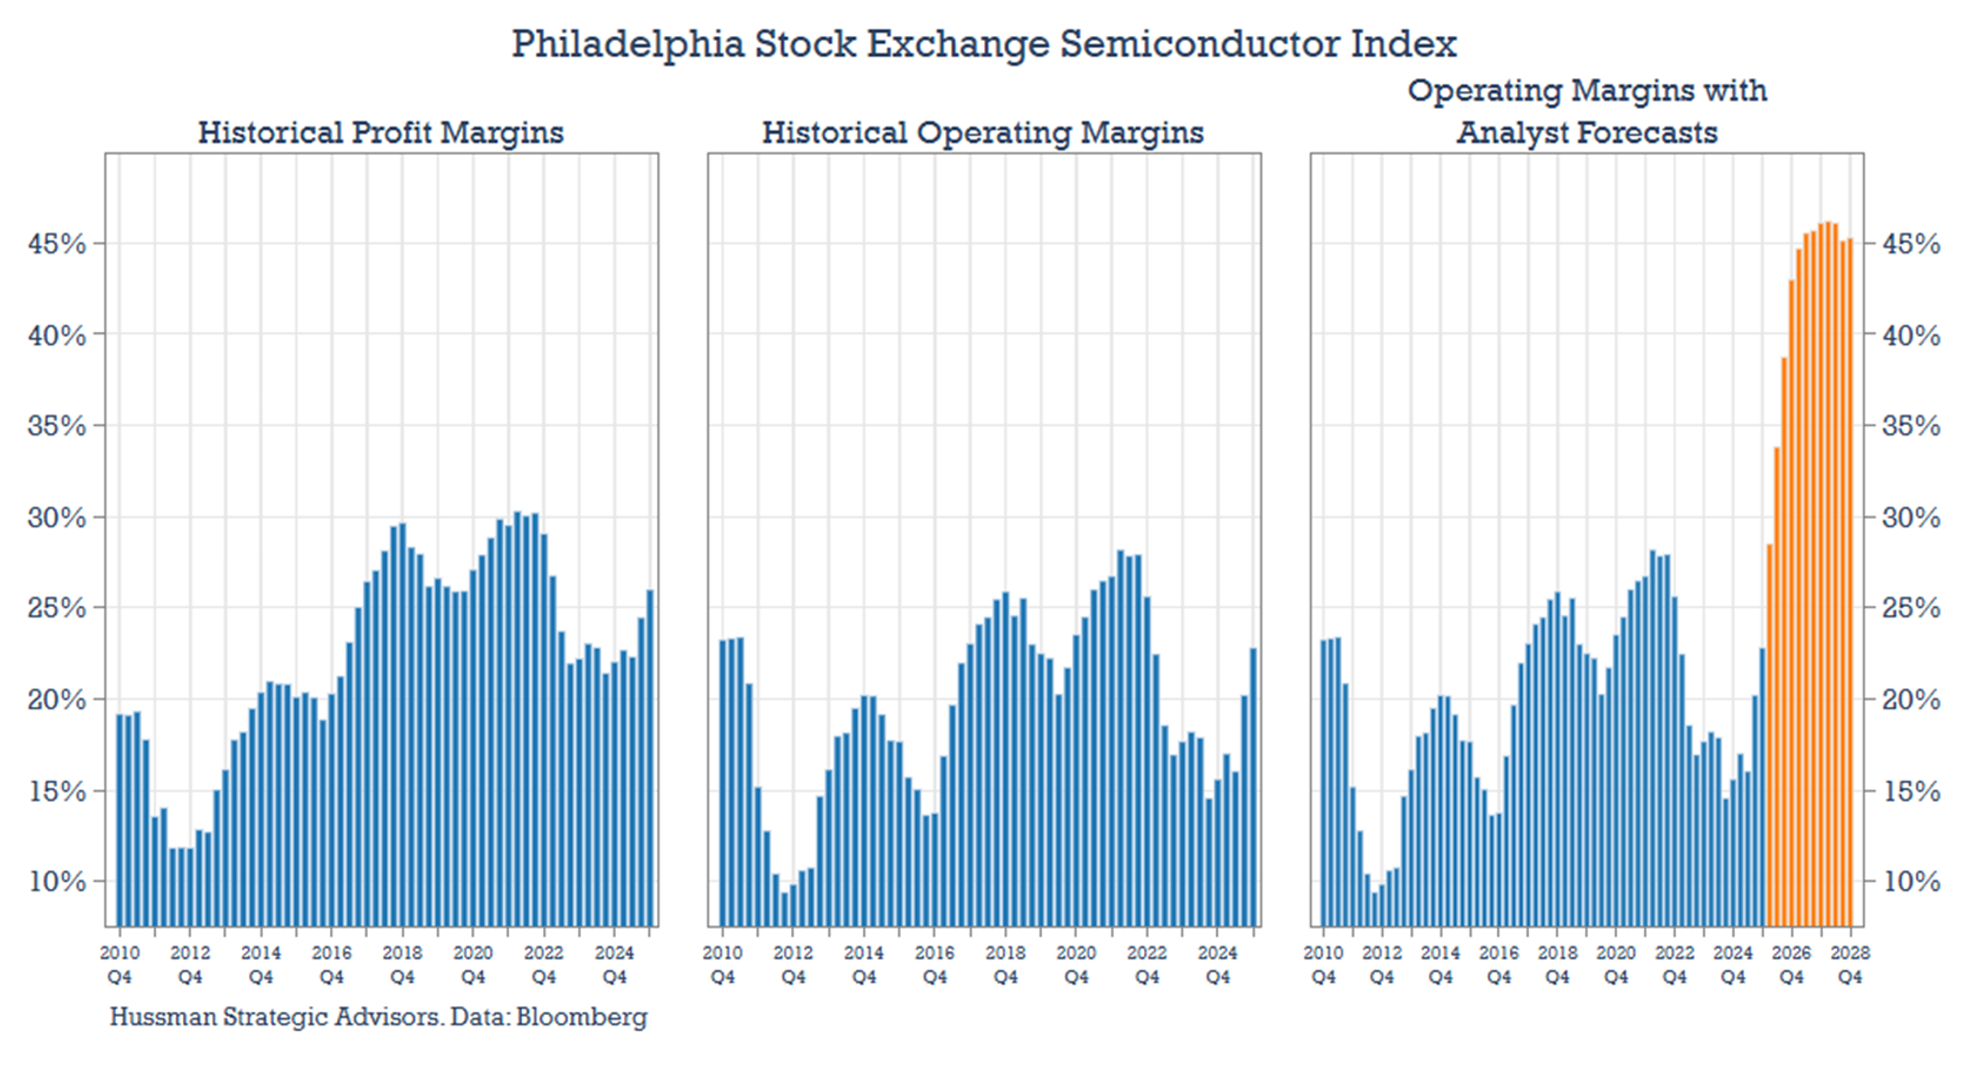
The point of this discussion is not that these forecasts are necessarily wrong. Index-level earnings reflect the aggregated views of hundreds of analysts, many of whom have followed these companies for years. Nor is this necessarily a call on the market’s near-term direction. In mid-2024, earnings growth expectations for 2025 for the S&P 500 were around 14%. Actual growth came in somewhat lower, at roughly 12.5%, yet the market is higher today than it was then. Missing optimistic earnings expectations is not unusual.
The issue is that the growing reliance on ever-higher profit margin assumptions is having an increasing influence on expected earnings – and therefore on price-to-forward-earnings multiples. If the market were to decline, whether due to concerns about a slowing economy or a realization that the benefits of AI investment will take longer to materialize, both components – price multiples and expected earnings – could fall meaningfully.
The chart below illustrates how the embedded risk of holding equities has been shifting away from the observable price-to-forward multiple ratio toward increasingly optimistic margin assumptions. It shows the contributions to returns of the S&P 500 Index since the beginning of 2025. The black line is the total return of the index, the orange line is the P/FE ratio, and the green line represents the expansion in margins. The purple and blue lines represent the component that comes from sales growth and dividends.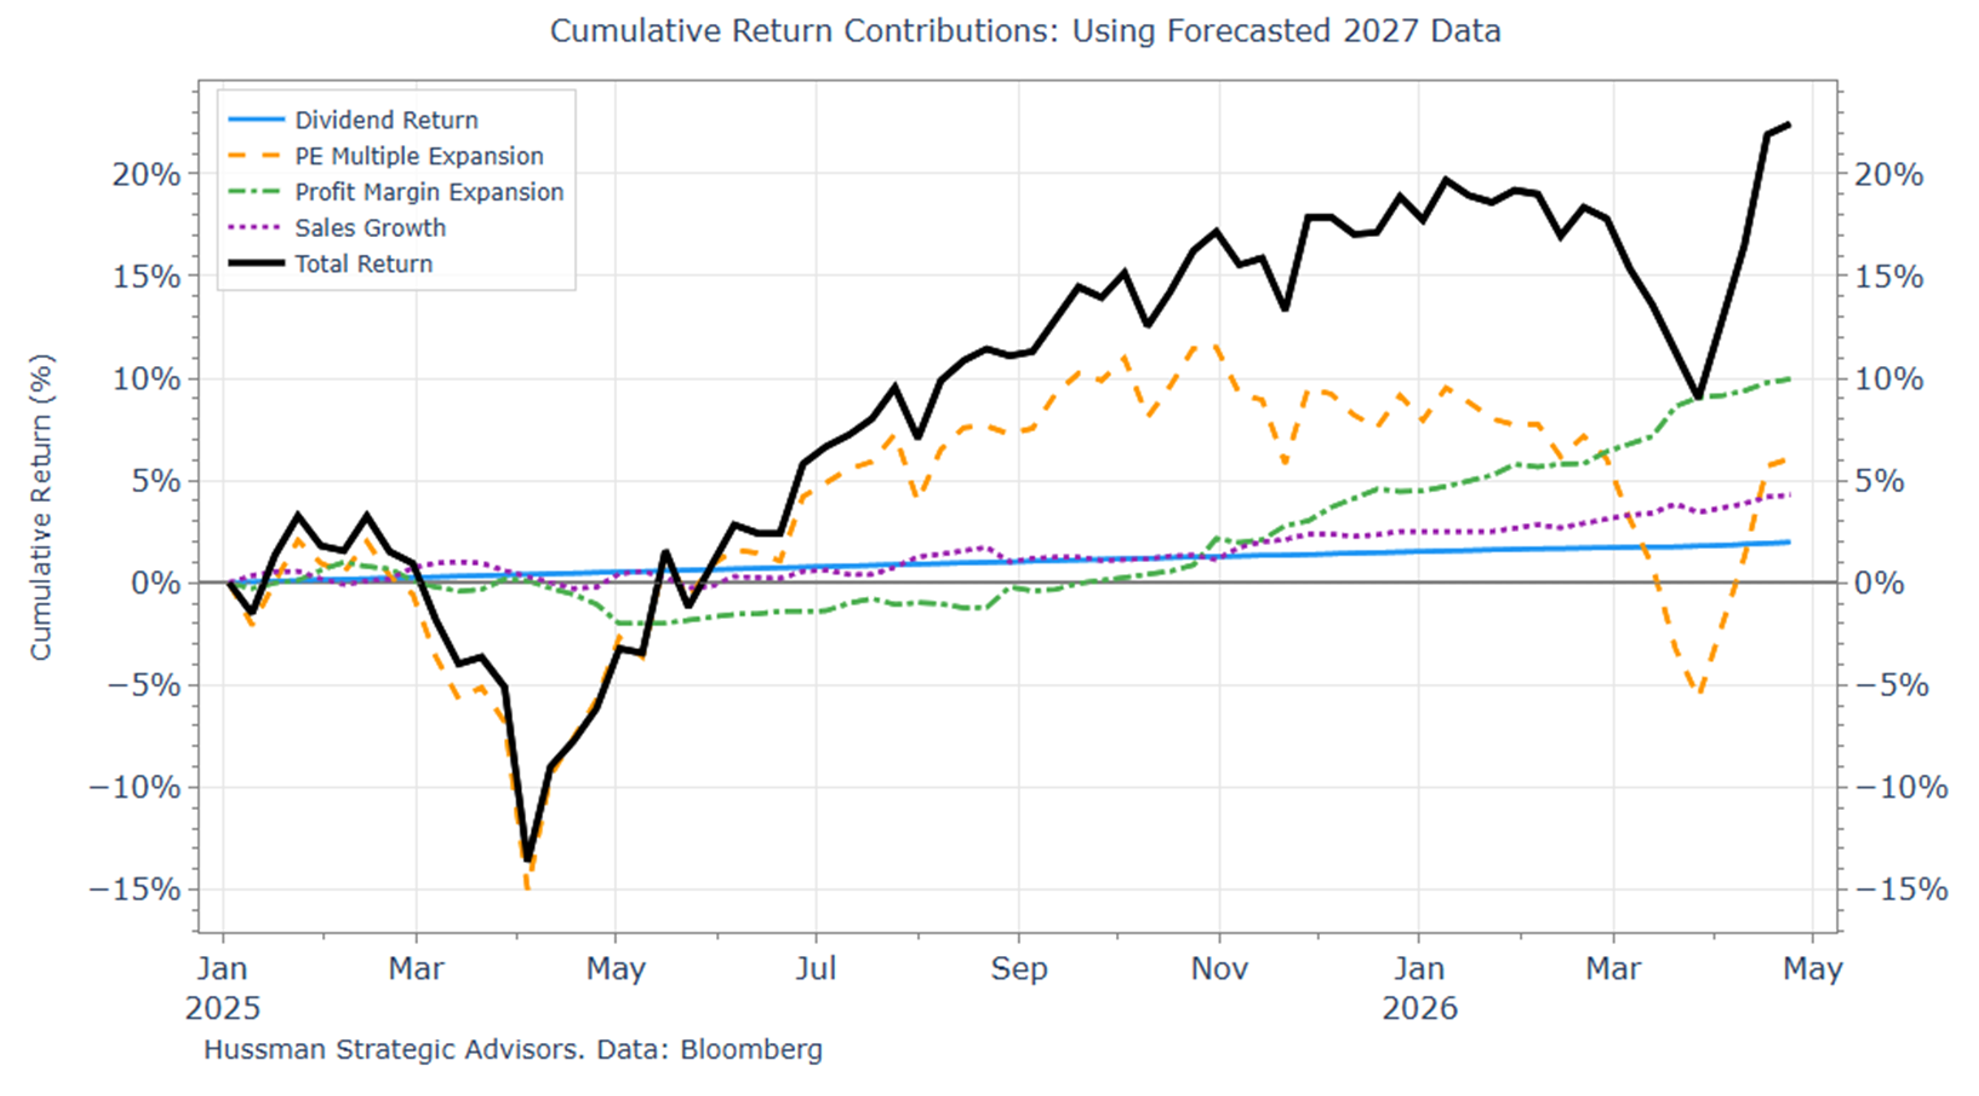
The initial rebound from the April 2025 bottom was driven largely by multiple expansion. Later in the year, as analysts began to raise margin and earnings growth expectations more aggressively, multiples based on forward earnings declined. And then, even as stock prices fell, multiples continued to contract at a faster pace than the decline in prices themselves. This chart effectively highlights how market risk that was previously visible as a steep price/forward-earnings ratio has been relocated into unprecedented assumptions for profit margins that are embedded in forecasted earnings.
Valuation Crosscheck
All of this is why it can be useful to cross-check valuations using the price-to-sales ratio or other smoother reported fundamentals. On a P/FE basis using 2027 earnings, stocks appear “cheaper,” with multiples down by roughly four points at the March low and still more than two points below levels from late last year, even though the market is at a new high.
However, the picture looks different on a price-to-sales ratio basis, which is nearly back to record highs. If operating margin expectations for this year and next are overstated, then the apparent improvement in P/FE may be misleading. In that case, equities are likely closer to record valuation levels, rather than being meaningfully cheaper relative to valuations a few months ago.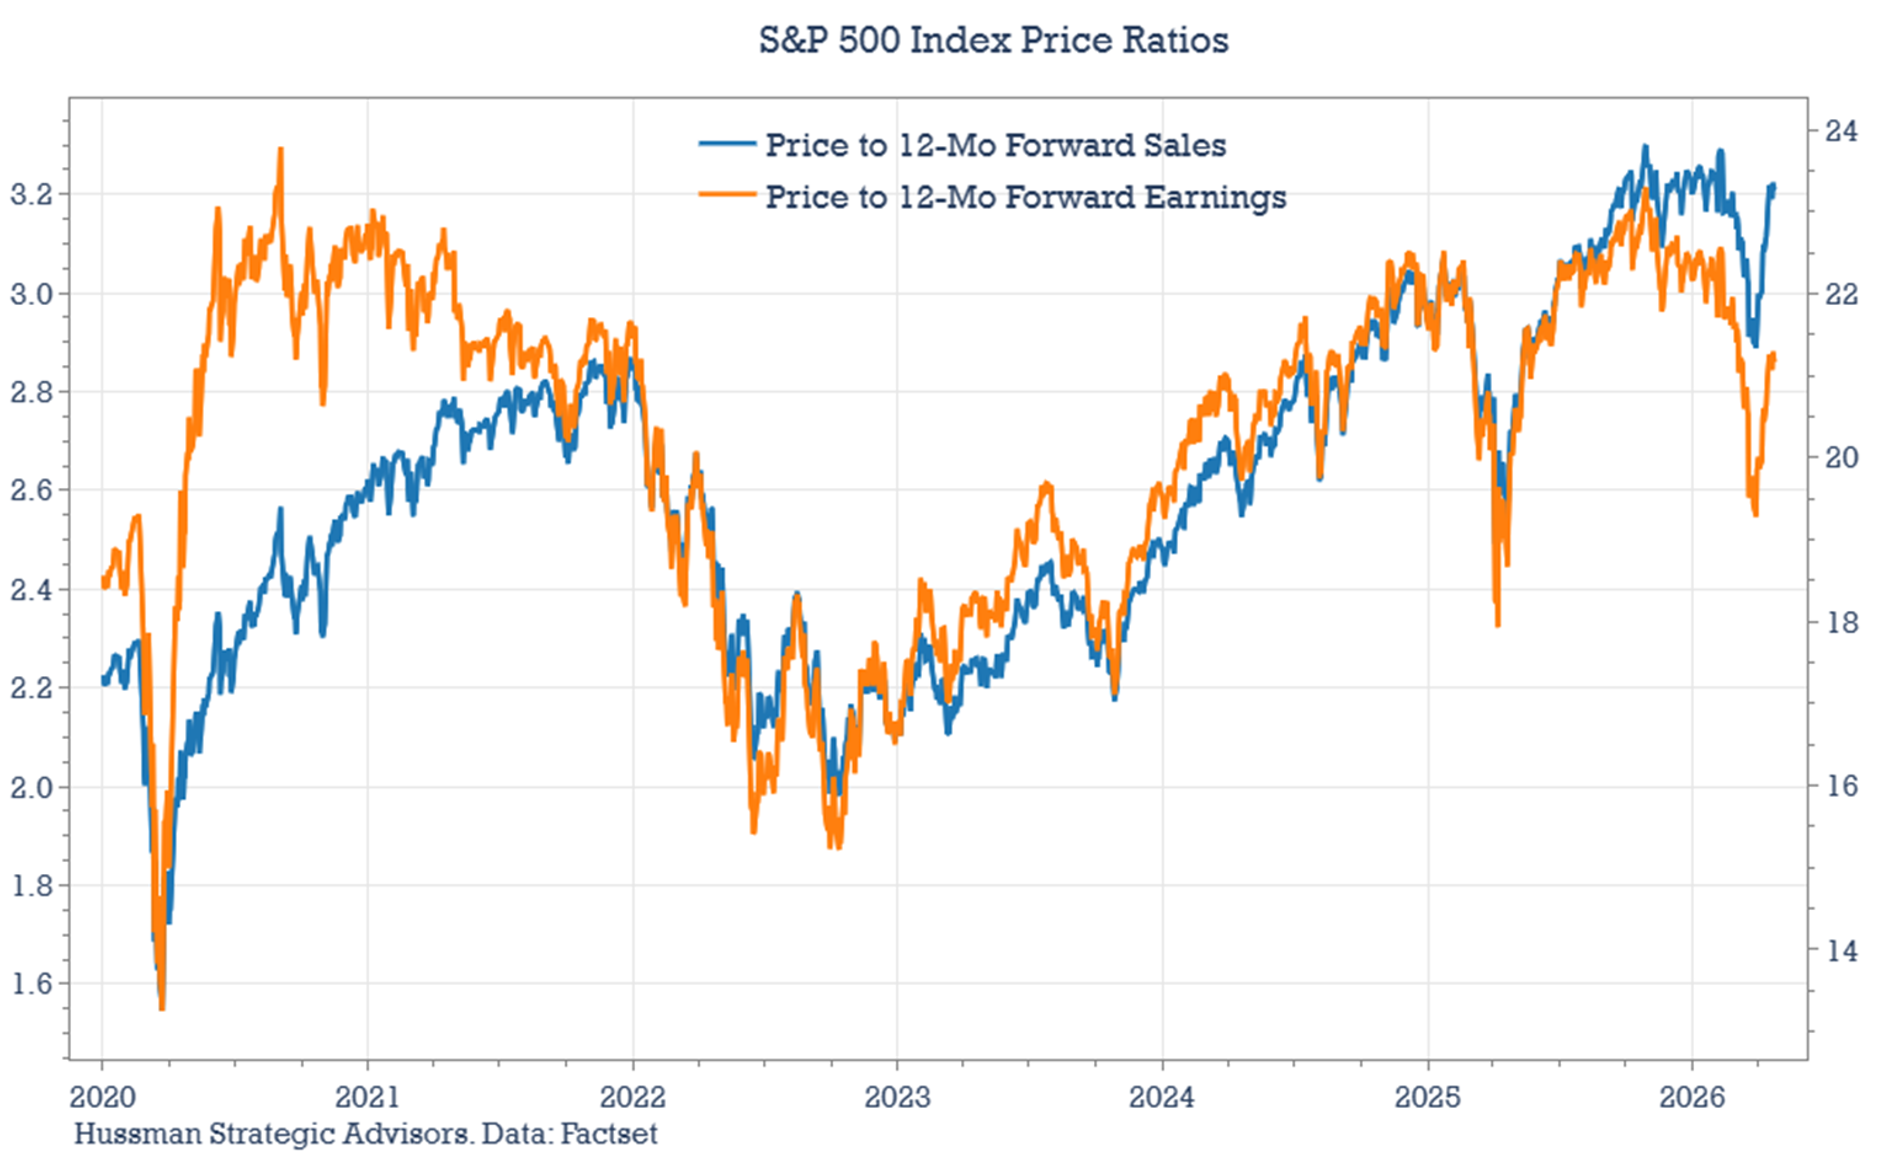
Equity valuations may appear less stretched as forward P/E multiples decline, but this shift reflects rising earnings expectations rather than lower prices. Much of the recent compression in valuation multiples has been driven by increasingly optimistic assumptions about sales growth and, more importantly, significant margin expansion.
These expectations are both unusually ambitious and broadly applied across companies, sectors, and market capitalizations. In short, risk has not disappeared – it has been relocated from observable price multiples to more uncertain forward earnings. If economic growth slows or the benefits of AI take longer than expected to materialize, both earnings expectations and valuation multiples could adjust simultaneously, leaving equities more exposed to risk than valuation metrics based on these unprecedented earnings estimates may suggest.
A message from Advisor Perspectives and VettaFi: Discover something new! Click here to register for our upcoming webcasts.
Prospectuses for the Hussman Strategic Market Cycle Fund, the Hussman Strategic Total Return Fund, and the Hussman Strategic Allocation Fund, as well as Fund reports and other information, are available by clicking Prospectus & Reports under “The Funds” menu button on any page of this website.
The S&P 500 Index is a commonly recognized, capitalization-weighted index of 500 widely-held equity securities, designed to measure broad U.S. equity performance. The Bloomberg U.S. Aggregate Bond Index is made up of the Bloomberg U.S. Government/Corporate Bond Index, Mortgage-Backed Securities Index, and Asset-Backed Securities Index, including securities that are of investment grade quality or better, have at least one year to maturity, and have an outstanding par value of at least $100 million. The Bloomberg US EQ:FI 60:40 Index is designed to measure cross-asset market performance in the U.S. The index rebalances monthly to 60% equities and 40% fixed income. The equity and fixed income allocation is represented by Bloomberg U.S. Large Cap Index and Bloomberg U.S. Aggregate Index. You cannot invest directly in an index.
Estimates of prospective return and risk for equities, bonds, and other financial markets are forward-looking statements based the analysis and reasonable beliefs of Hussman Strategic Advisors. They are not a guarantee of future performance, and are not indicative of the prospective returns of any of the Hussman Funds. Actual returns may differ substantially from the estimates provided. Estimates of prospective long-term returns for the S&P 500 reflect our standard valuation methodology, focusing on the relationship between current market prices and earnings, dividends and other fundamentals, adjusted for variability over the economic cycle. Further details relating to MarketCap/GVA (the ratio of nonfinancial market capitalization to gross-value added, including estimated foreign revenues) and our Margin-Adjusted P/E (MAPE) can be found in the Market Comment Archive under the Knowledge Center tab of this website. MarketCap/GVA: Hussman 05/18/15. MAPE: Hussman 05/05/14, Hussman 09/04/17.
Membership required
Membership is now required to use this feature. To learn more:
View Membership BenefitsSponsored Content
Upcoming Virtual Events View All


