April showers came in the form of more inflows raining down on the exchange-traded fund (ETF) market last month. Assets under management (AUM) have now grown to a staggering $14.7 trillion for the year. That’s punctuated by year-to-date (YTD) net inflows of over $636 billion. At this pace, ETFs are assuredly on track to overtake last year’s ~$1.5 trillion inflows.
Key Takeaways:
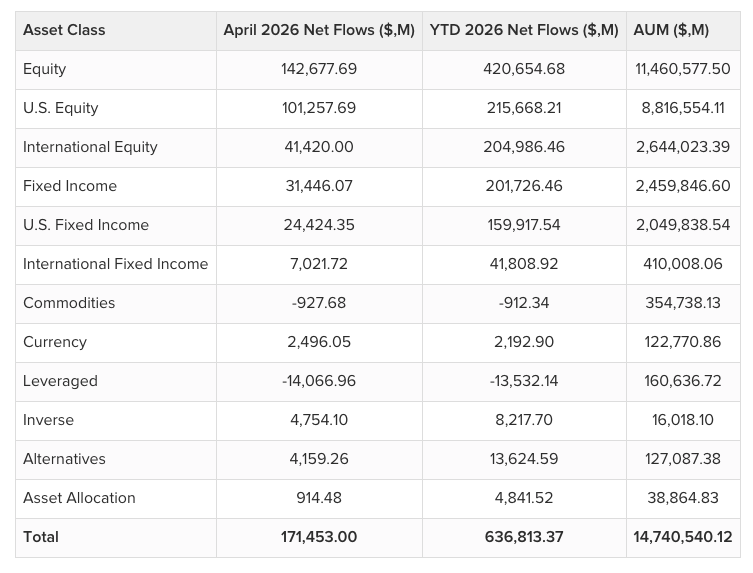
- The total assets under management for the ETF industry have reached a significant milestone of $14.7 trillion, driven by year-to-date inflows exceeding $636 billion.
- Investors are showing a massive preference for U.S. large-cap equity exposure, with the top three S&P 500 trackers alone capturing nearly $47 billion in April.
- A notable divide has emerged in the semiconductor space, as long-term investors pile into growth funds while tactical traders utilize leveraged inverse products to hedge against potential corrections.
Fixed Income’s Quiet Storm
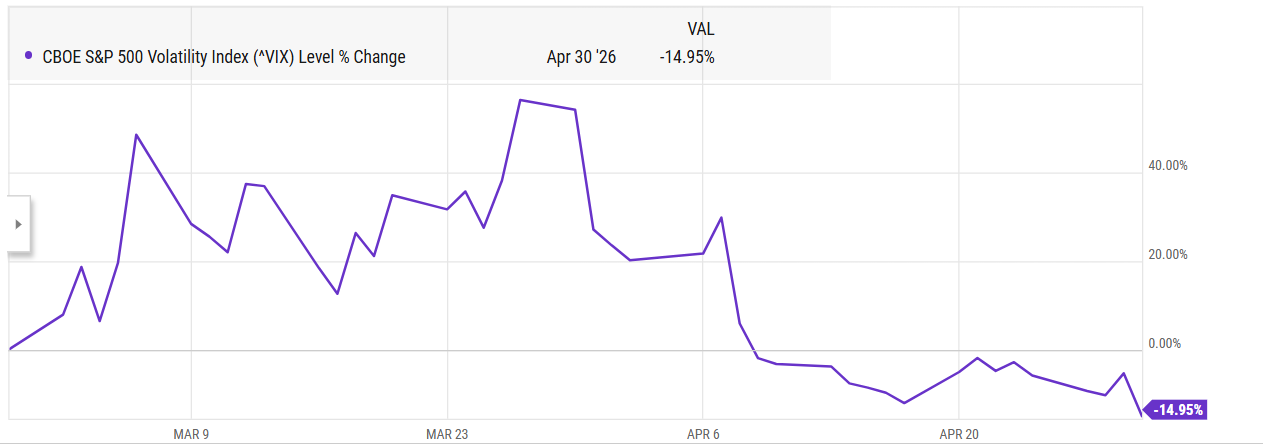
April marked a drop-off in volatility after spiking in March, leading to an open invitation for a risk-on sentiment to return. This resulted in an unrelenting downpour of inflows for equities. However, a quiet storm is and has been brewing for fixed income.

Totaling over $2.4 trillion in AUM so far this year, the fixed income asset class has seen over $201 billion in YTD net flows, and over $31.4 billion in April. This represents a significant portion of total market inflows relative to its AUM size. That could signal that advisors are rebalancing portfolios toward bonds in order to lock in yields amid a higher-for-longer rate environment.
As mentioned, the 2026 data largely favors U.S. equities and, more specifically, tech growth. International equities continue to see interest, accounting for 29% of net flows into equities. Additionally, negative April flows for leveraged ETFs (-$14 billion) and the slight retreat from commodities could suggest that investors are gravitating to quality and stability.
A Deluge of Inflows in Equities
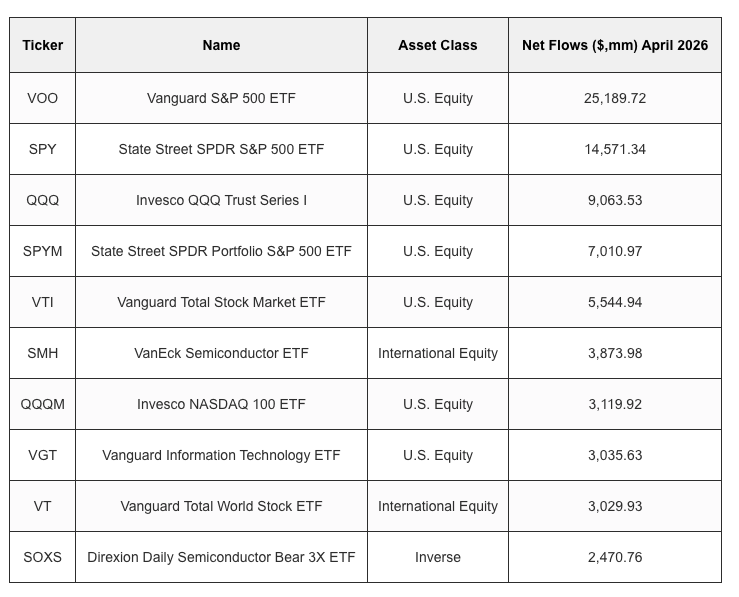
April 2026 flow data revealed a deluge of inflows into broad-market U.S. equity exposure, especially the S&P 500. The big three S&P 500 trackers included usual suspects like the Vanguard S&P 500 ETF (VOO), SPDR S&P 500 ETF Trust (SPY), and SPDR Portfolio S&P 500 ETF (SPYM). This trio collectively hauled in over $46.7 billion. Vanguard’s VOO led the charge with just over $25 billion.
The Vanguard Total Stock Market ETF (VTI) proved its status as a core portfolio staple in April, capturing $5.54 billion in net flows as investors sought comprehensive exposure to the entire U.S. equity landscape from large-caps to small-caps and all points in between. Meanwhile, the Vanguard Total World Stock ETF (VT) remains the go-to ETF for those seeking a global footprint, drawing in over $3.02 billion for April.
As mentioned, tech continues to the see the lion’s share of inflows. The Invesco QQQ Trust (QQQ) and its lower-cost sibling, the Invesco NASDAQ 100 ETF (QQQM), saw combined inflows of over $12 billion. Adding to the confidence in tech was over $3 billion into the Vanguard Information Technology ETF (VGT).
The semiconductor trade shows a fascinating divide, indicating two different investing mindsets in chips. The VanEck Semiconductor ETF (SMH) attracted nearly $3.9 billion, but it is joined on the top-10 list by the Direxion Daily Semiconductor Bear 3X ETF (SOXS), which brought in $2.47 billion. This suggests that while long-term investors are piling into chips, tactical traders are utilizing leveraged inverse products to hedge against potential overextension or to bet on a short-term correction after the most recent earnings run.
While they didn’t crack the top-10 list, the fixed income story underscores the search for yield. The iShares Broad USD High Yield Corporate Bond ETF (USHY), iShares iBoxx $ Investment Grade Corporate Bond ETF (LQD), and the Vanguard Intermediate-Term Corporate Bond ETF (VCIT) took in around $2 billion apiece during April.
Eyeing the Halfway Mark
Looking ahead, the resilience of equities and the quiet storm of fixed income could continue, as 2026 gets deeper into Q2 while already heading towards the halfway mark. As total AUM marches toward the $15 trillion milestone for ETFs, the industry continues to grow into a diverse financial ecosystem conducive to long-term wealth accumulation and short-term tactical maneuvering.
Whether the second half of the year brings clearer skies or more volatility, the massive $636 billion YTD flows cushion suggests that the ETF industry is well-positioned to navigate any macroeconomic surprises. We’ll see what the rest of the year brings.
For more news, information, and analysis, visit VettaFi | ETF Trends.
Originally published on ETF Trends
A message from Advisor Perspectives and VettaFi: Discover something new! Click here to register for our upcoming webcasts.
Read more commentaries by VettaFi