It’s likely not a bubble. Earnings are high. Prices are high because they anticipate future high earnings growth. The historical record shows that growth rate is achievable.
Introduction
The problem with earnings per share (EPS) forecasts is that, at some point, they switch from being next-year forecasts to being two-year-ahead forecasts. And then, there is often a jump in the price-to-forward earnings ratio. The clever folks at Bloomberg finally came up with a solution: blend one- and two-year ahead earnings forecasts so when the former drops out, the change is continuous. According to the handy LLM assistant now embedded into the Bloomberg terminal (via ASKB), the formula for this bit of wizardry is:
Blended Forward EPS = (Days until next FY / Total trading days in year) × FY1 EPS + (1 − Days until next FY / Total trading days in year) × FY2 EPS.
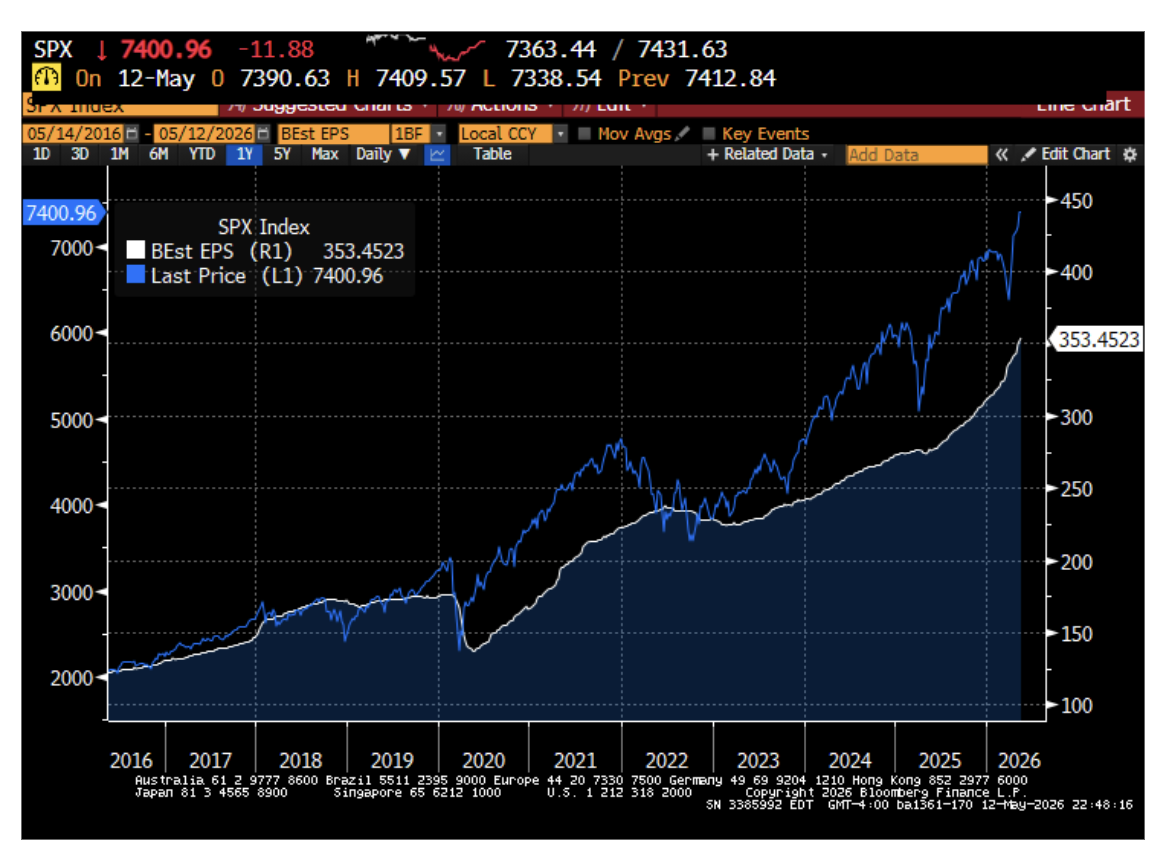
The next chart shows this smoothed version of year-ahead analyst earnings forecasts, plotted alongside the S&P 500 index itself. What jumps out is that stock prices (blue line) lead earnings per share forecasts (white line). Since stock prices are forward-looking discounters of future earnings, this is not surprising.

The second thing that jumps out is that both series are at all-time highs. Stock prices are high because earnings and earnings forecasts are high. A lot of this has to do with AI and the fact that AI productivity gains are now starting to get monetized. An interesting synopsis is in this FT article from Erik Brynjolfsson. Whatever the reason, Q1 2026 S&P 500 earnings were, by any measure, stupendous.
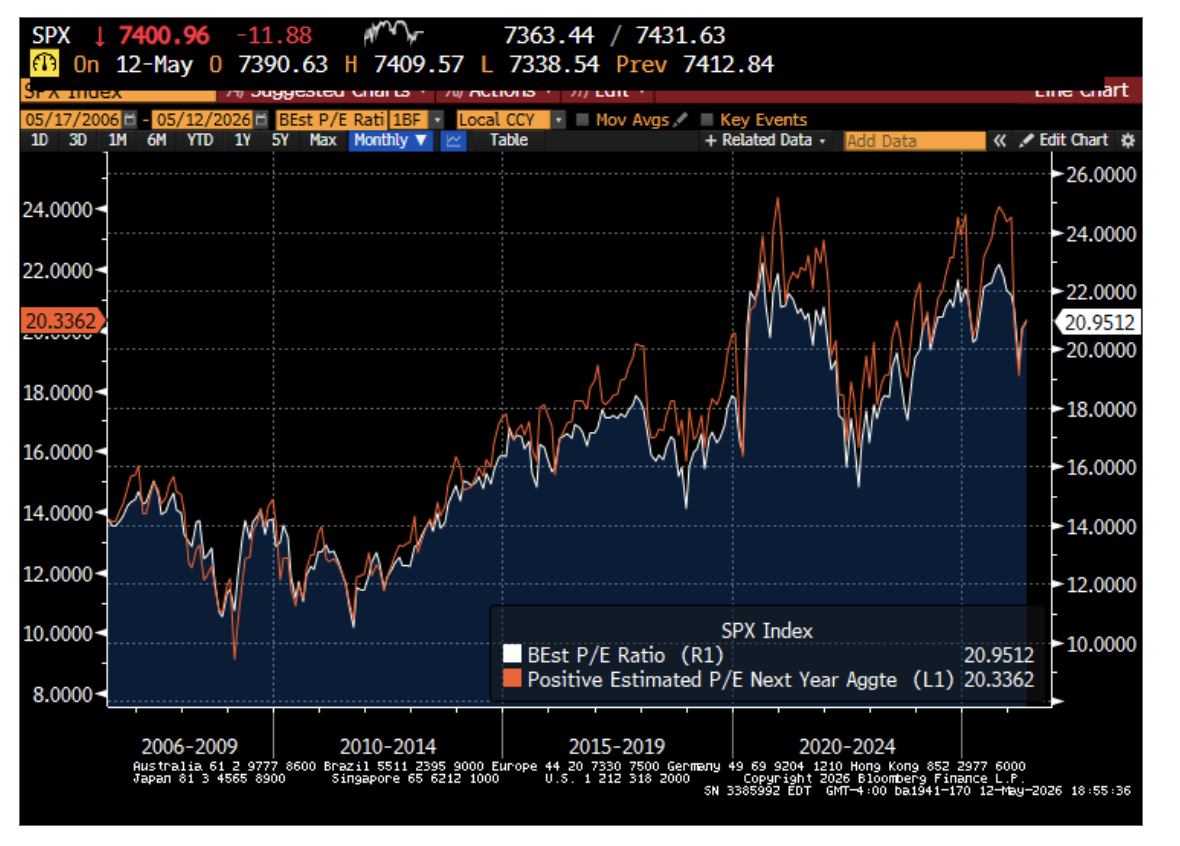
The astute observer will notice that, despite the fact that both are at all-time highs, the ratio of the market price to year-ahead blended EPS appears to be at the high end of its historical range. The white line in the next chart shows the price-to-forward earnings ratio. Even accounting for currently high EPS forecasts, stock prices still appear relatively high. So what gives?
Stock prices consist of two components: anticipated future earnings discounted back to today by anticipated future expected returns. When stock prices are high, it can be either because the market anticipates high future earnings or because the market anticipates low future returns, or some combination of the two. So where are we now?
The orange line in the above chart is another version of the price-to-forward earnings ratio (where earnings are measured as positive, expected next-year EPS estimates). This is a slightly different version of earnings per share than the blended EPS discussed earlier, but the main takeaway is that both price-to-EPS (P/E) series track each other reasonably well, though not perfectly.
Reversion to the mean
The concern around current valuations implicitly assumes that stocks can’t maintain such lofty P/E levels forever, and so must invariably come down to earth over some time period, which will be characterized by low realized returns. To quantify this intuition, let’s see what happens if all the relevant pieces needed to forecast future stock returns just converge to their steady-state levels over the next ten years. This would mean that:
- Currently low S&P 500 dividend yields revert back to their historical, roughly 2% level over the next ten years.
- Price-to-EPS ratios revert from their currently elevated levels to their steady-state levels over the next ten years.
- EPS grows over the next ten years in line with its historical growth rate.
Together, these three projections allow us to calculate the anticipated future return from owning the S&P 500.
A brief aside on forecasts. Please keep in mind that the subsequent analysis is a projection that depends on many, highly stylized assumptions. Reality will, of course, be different. And different assumptions lead to very different projections. Future stock prices may be much lower than what this exercise suggests.
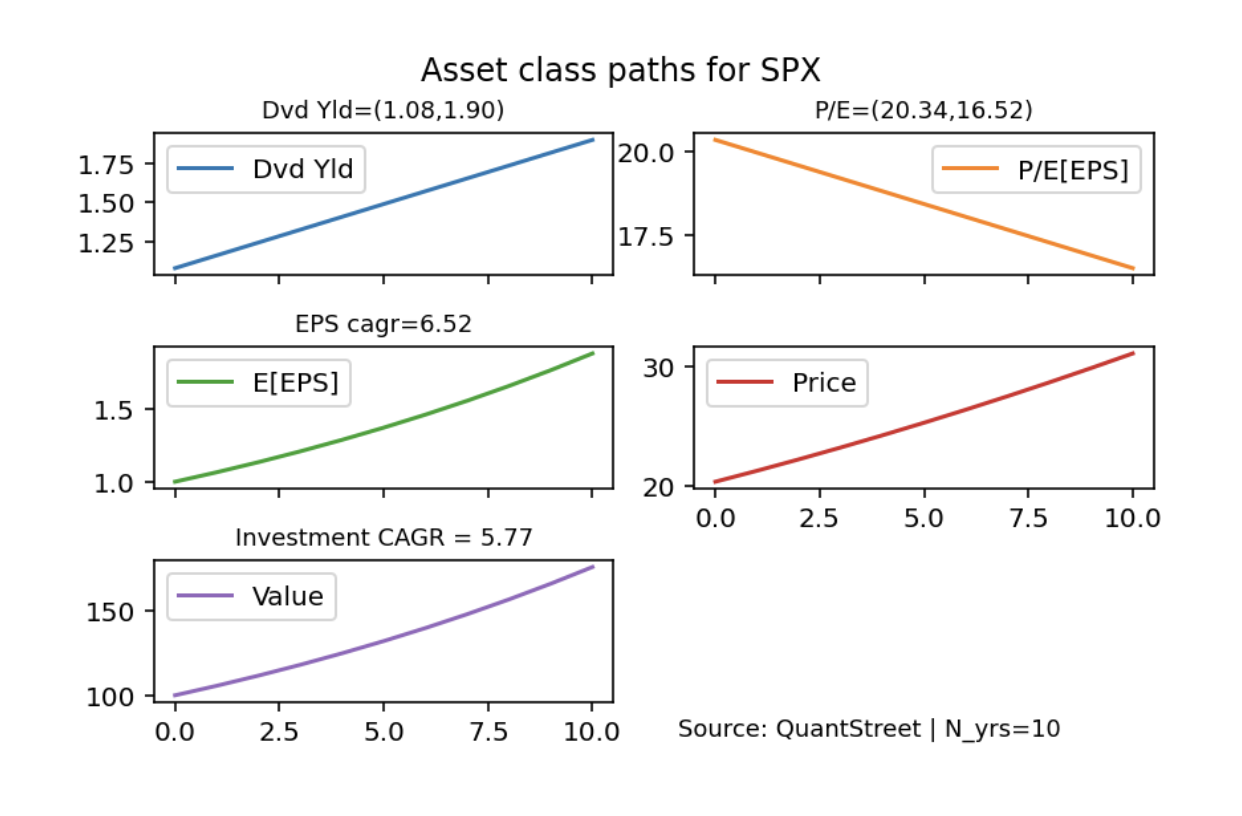
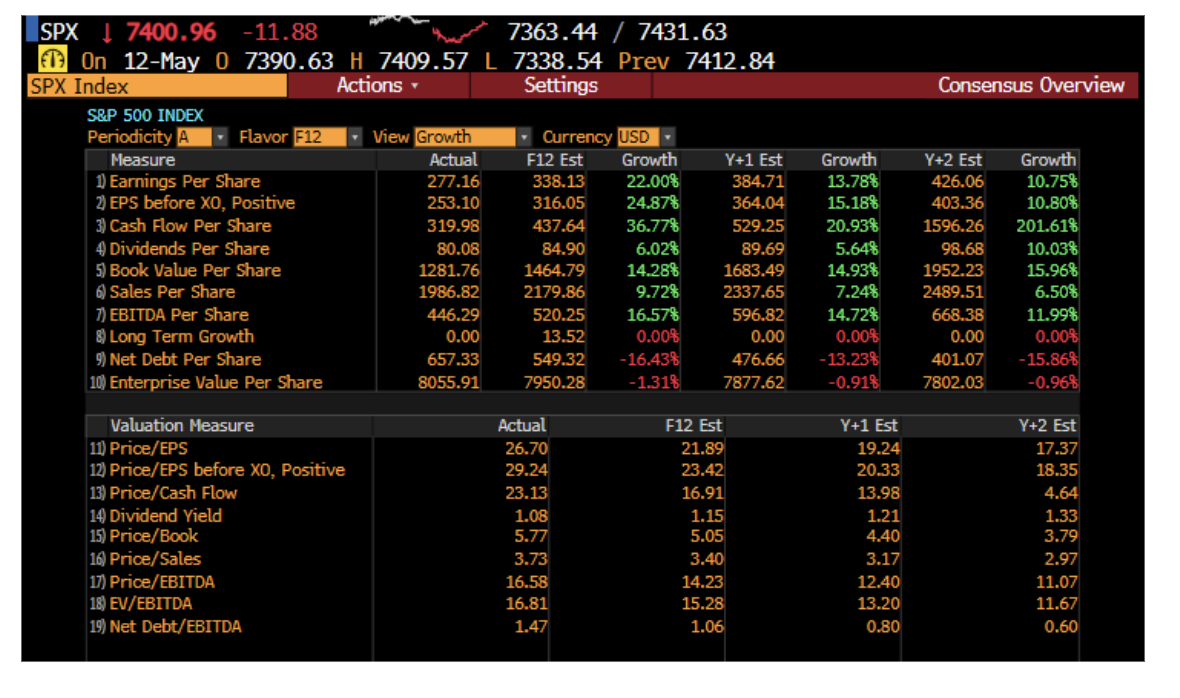
The next set of figures shows what happens if this return-to-steady-state scenario plays out over the next ten years. The dividend yield on the S&P 500 index would increase from the current 1.08% to the steady state 1.90%. The price-to-forward earnings ratio would fall from the currently elevated 20.34 to the steady state 16.52. A dollar of current earnings would grow to around $1.88 at the historical S&P 500 EPS growth rate of 6.52%. Since the price equals the current EPS forecast times the price-to-EPS forecast ratio, the price of a security entitling its owner to $1 of S&P 500 earnings would grow from roughly $20 to just over $30, reflecting higher future EPS forecasts but lower future price-to-EPS ratios. Finally, the total return from investing in the S&P 500 index is the future price plus the dividend yield earned in the meantime. In this scenario, the annualized ten-year return would be 5.77%.
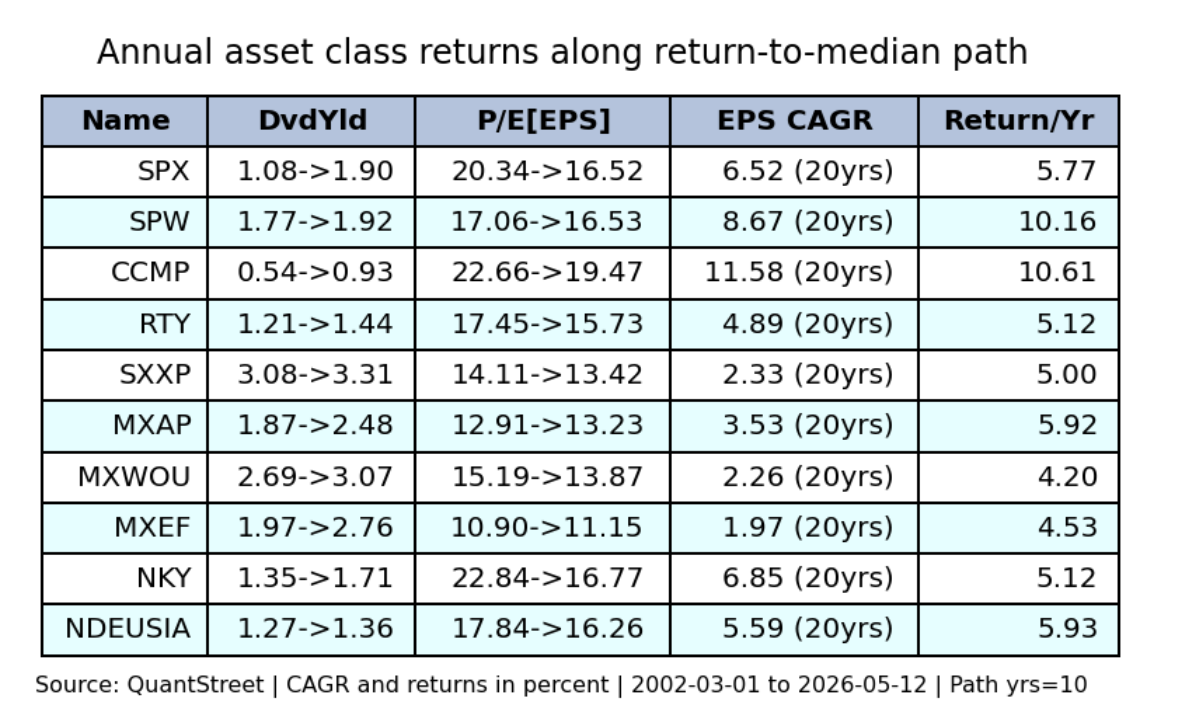
The next table shows exactly the same exercise repeated for other US and global markets. The equal-weighted S&P 500 index (SPW) and the Nasdaq index (CCMP) are projected to return just over 10% in the return-to-steady-state scenarios, while European stocks (SXXP), Asian stocks (MXAP), and global stocks ex-US (MXWOU) are forecasted to return 5.00%, 5.92%, and 4.20%, respectively.
Key for global stock market tickers: SPX = S&P 500; SPW = equal-weighted S&P 500; CCMP=Nasdaq; RTY=Russell 2000; SXXP=Europe; MXAP=Asia; MXWOU=Global ex-US; MXEF=Emerging market; NKY=Nikkei; NDEUSIA=India.
Again, these are all just forecasts in one highly stylized scenario, and no one knows what will really happen. But based purely on current and historical valuations, and the historical EPS growth rates for different indexes, the S&P 500 is not forecast to do any worse than other major global stock markets.
Scenarios
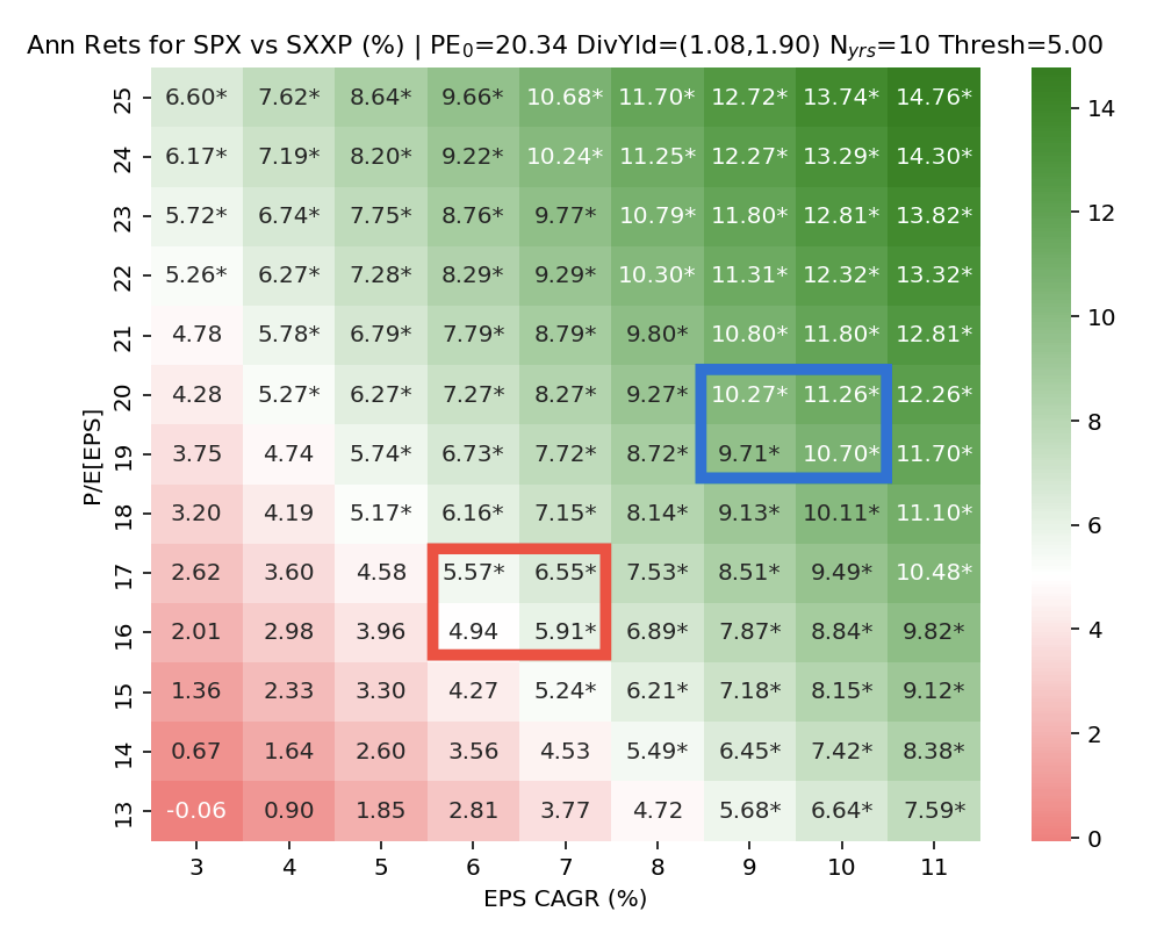
Despite the relatively sanguine forecasted S&P 500 performance, an absolute return of 5.77% per year is still not very attractive, representing only a 1.3% risk premium over the current 10-year Treasury yield. So what might the market be thinking? The next table shows the range of possible S&P 500 return outcomes as a function of the assumed future price-to-earnings ratio and the assumed EPS growth rate over the next ten years.
The historical average EPS growth for the S&P 500 is 6.5% and the historical P/E ratio is 16.5. That gets us into the annualized returns shown in the red box, i.e., the 5.77% return bogie mentioned before.
But what if earnings growth averages 9.5% a year and the future P/E multiple is at 19.5 times (still below the current 20.3 level)? That puts the range of future return outcomes on the S&P 500 into the blue box, somewhere between 9.5% and 11% annualized returns for the next ten years.
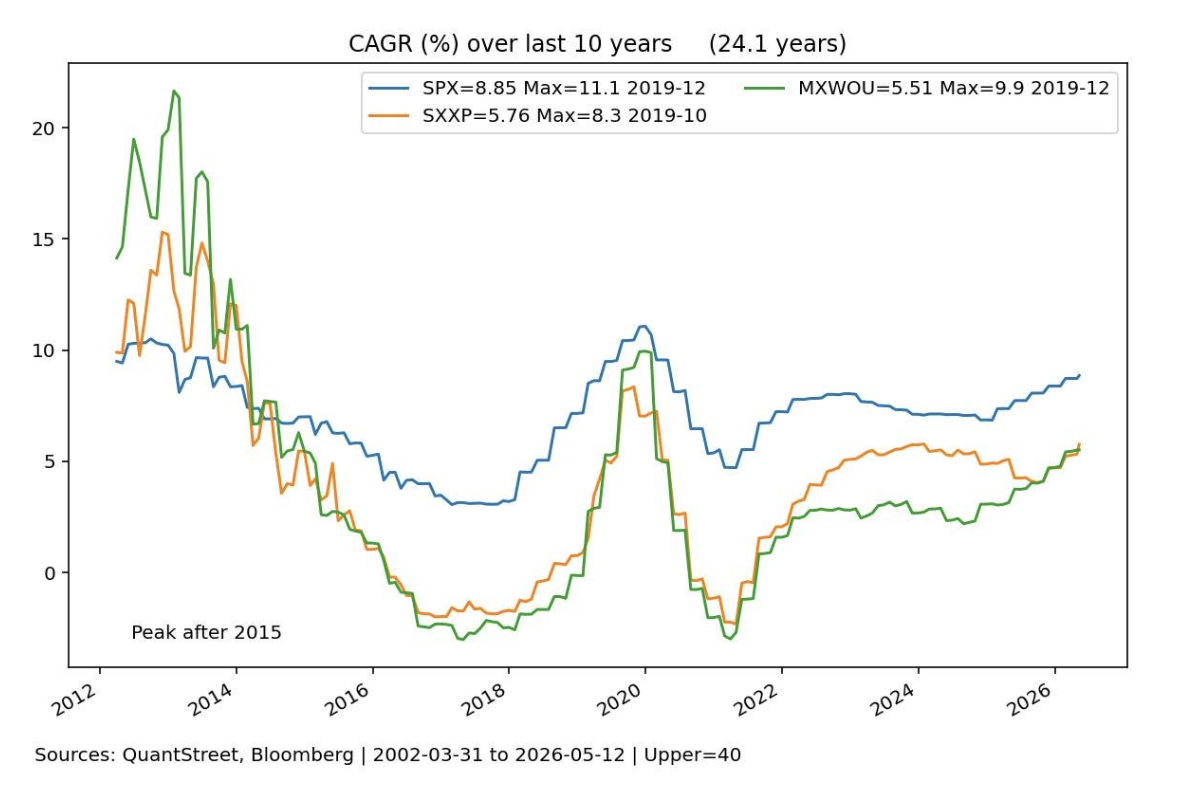
Is this range of EPS growth rates plausible? Bloomberg analyst consensus has S&P 500 EPS growing at 13.78% and 10.7% per year over the next one and two years, respectively. A 9–10% EPS growth rate for a full decade is a tall order, but it’s consistent with current EPS growth estimates, and it’s happened before! See the chart below.
This chart shows the compounded annual growth rate (CAGR) of S&P 500 earnings calculated over rolling 10-year windows. The legend shows the most recent CAGR, as well as the highest CAGR observed over the entire sample.
Conclusion
With the caveat that these are just projections and no one knows what will really happen, the currently high level of stock prices relative to (the also high level of) earnings suggests one of two things:
- Future returns on the S&P 500 will be low.
- The future earnings growth rate of the S&P 500 will be high, which could be associated with high-single-digit or low-double-digit annualized market returns.
For the reasons laid out above, our view is that option 2 is the more likely outcome. But only time will tell.
Working with QuantStreet
QuantStreet is a registered investment advisor. It offers financial planning, wealth management, model portfolios, and portfolio analytics. The firm’s approach is systematic, data-driven, and shaped by years of investing experience. To work with or learn more about QuantStreet, contact us at [email protected] or sign up for our email list.
A message from Advisor Perspectives and VettaFi: Discover something new! Click here to register for our upcoming webcasts.
© QuantStreet Capital
Read more commentaries by QuantStreet Capital