Asset Allocation Interactive (AAI) is revealing something peculiar.
Right now, AAI’s two highest 10-year expected return forecasts are for large-cap value equity strategies outside the United States—Emerging Markets RAFI and Dev ex US Large RAFI. AAI’s expected return model anticipates valuations for equity strategies to mean revert and therefore tends to elevate out-of-favor regions and styles, predicting higher future returns for recently underperforming equity indices.
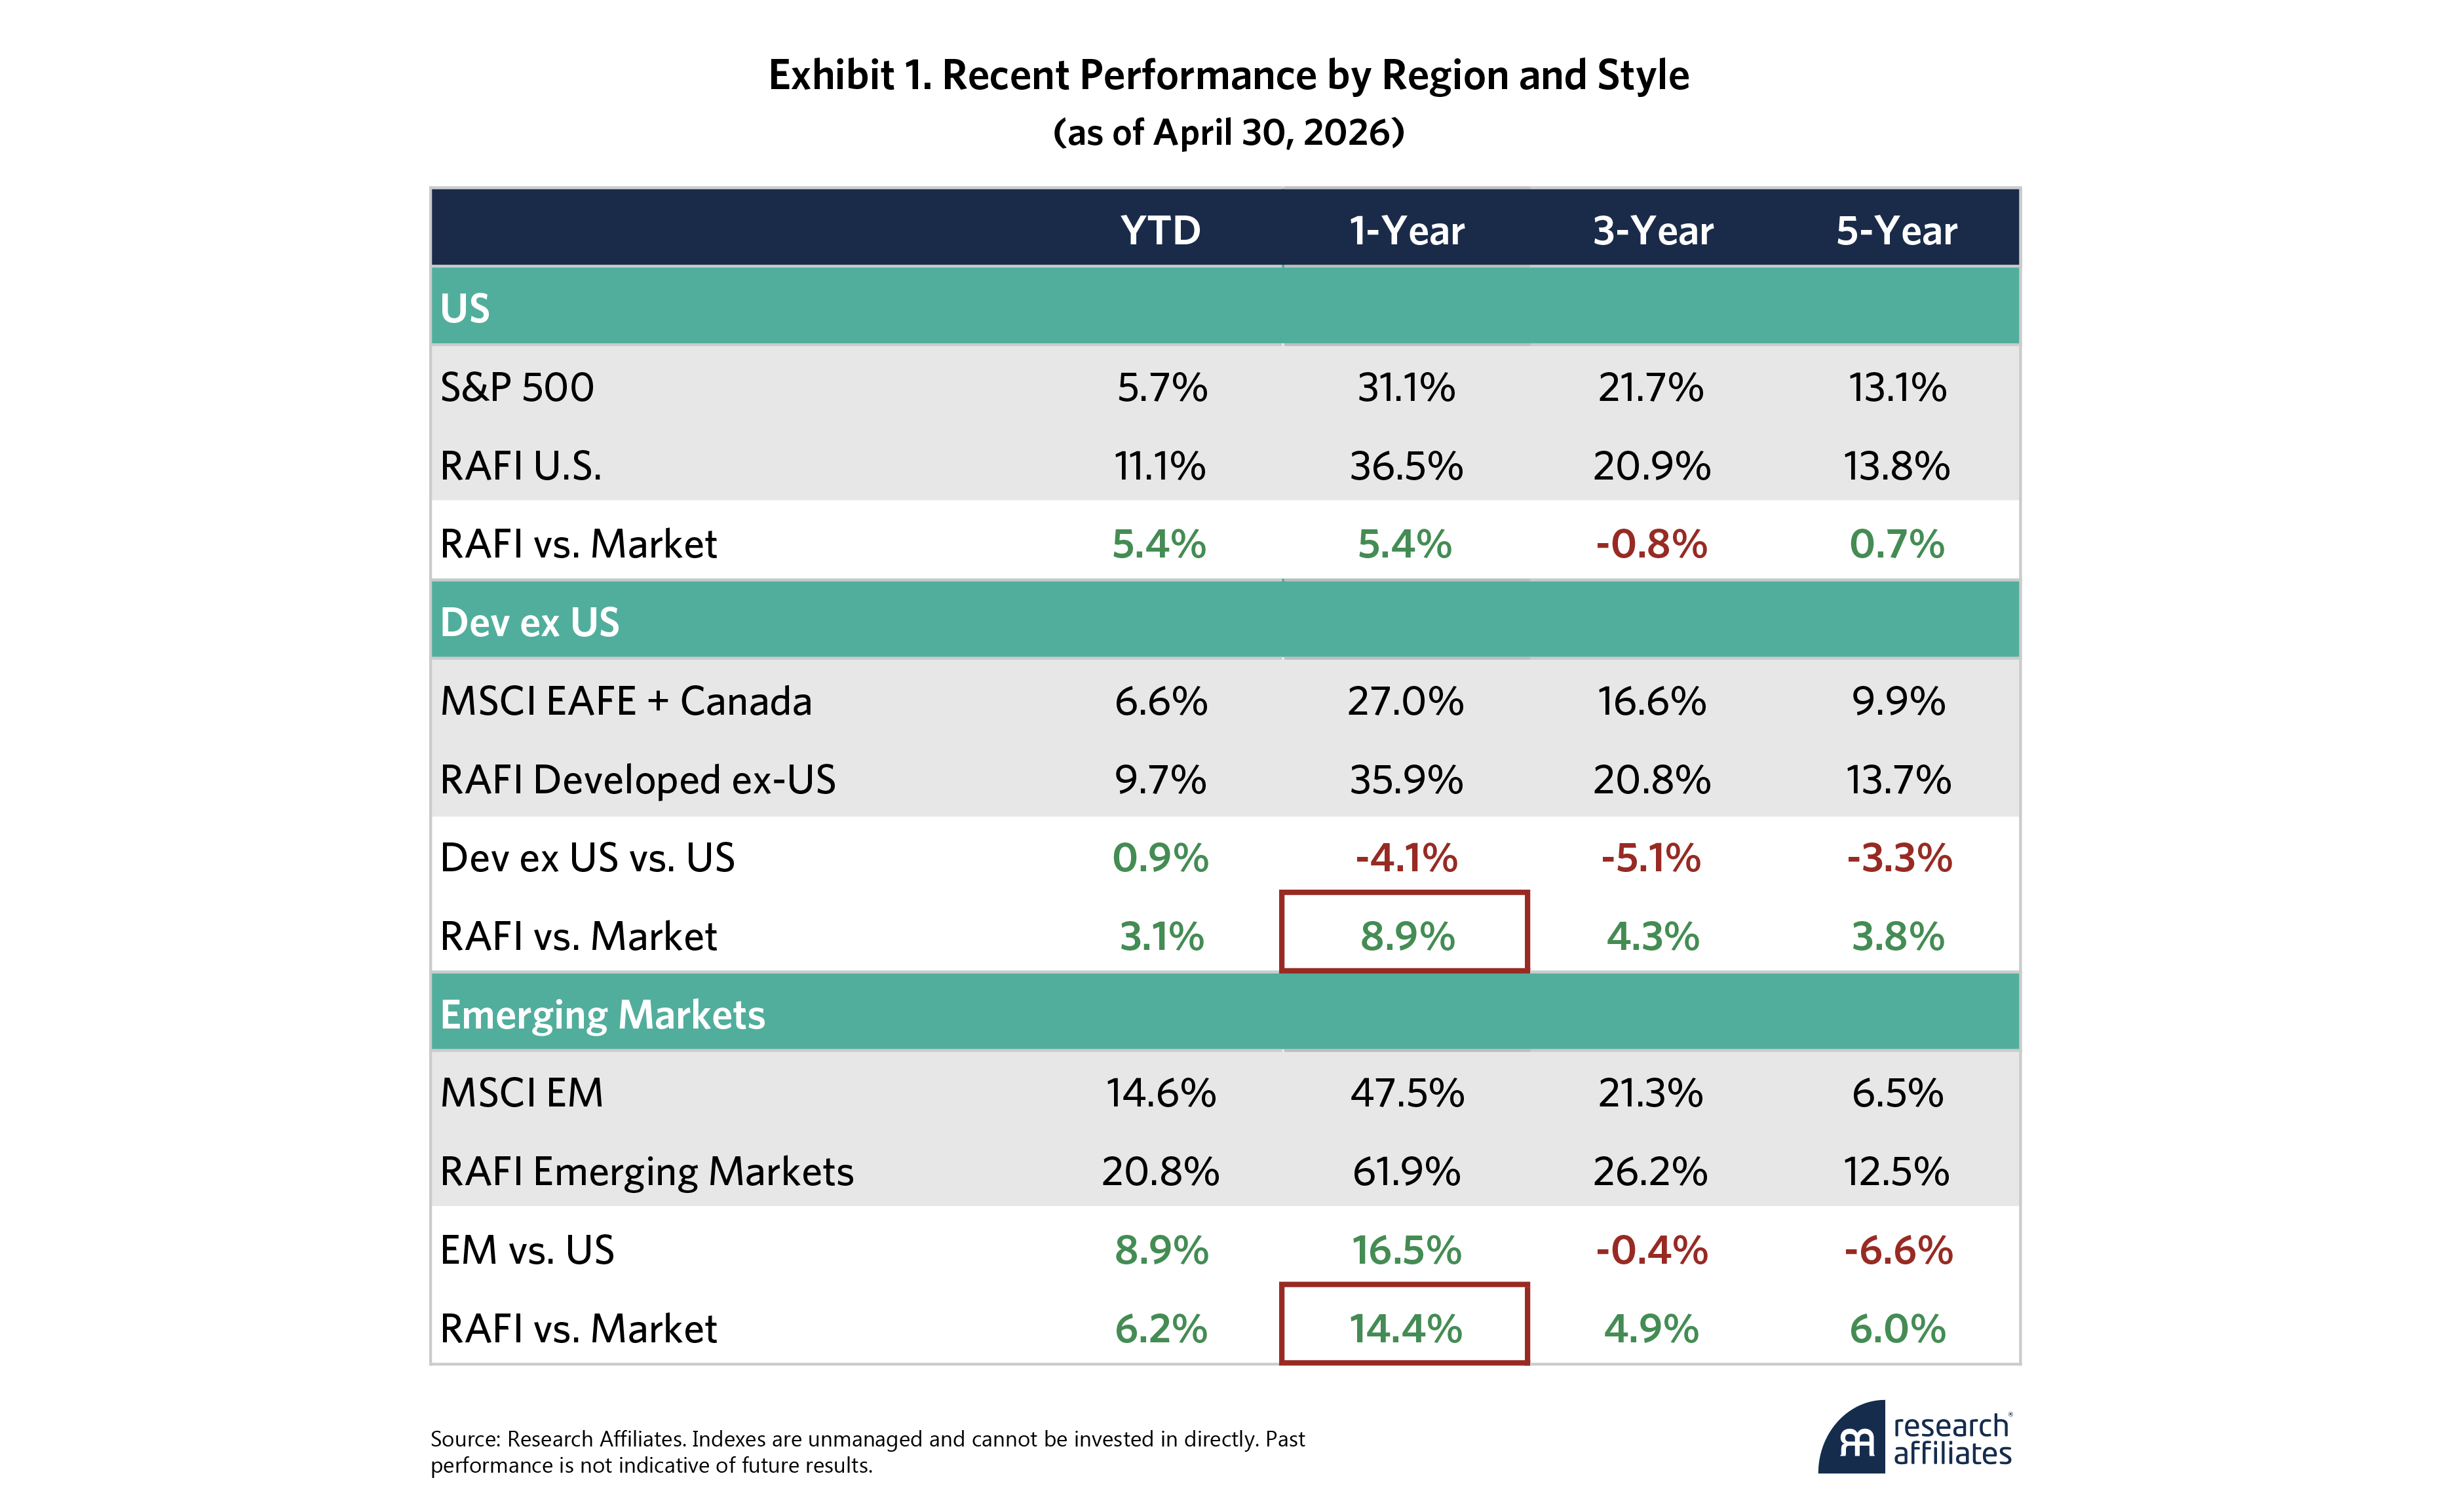
What is strange about today’s expectations is that Emerging Markets RAFI and Dev ex US Large RAFI have already demonstrated strong performance over the past year. Not only has value beaten core handily in both markets, but as Exhibit 1 shows, the style outperformance in Dev ex US was more than enough to make up for the lag of that market vs the U.S. In Emerging Markets (EM), the RAFI alpha vs the market was on top of the already double-digit outperformance of EM itself.

Yet both Dev ex US and EM value indices remain highly attractive according to AAI’s expected return model.
What explains this anomaly? To answer that, we drill into the underlying components of these forecasts.
Read more: Trading Fixed Income SMAs at Scale for Execution Advanta
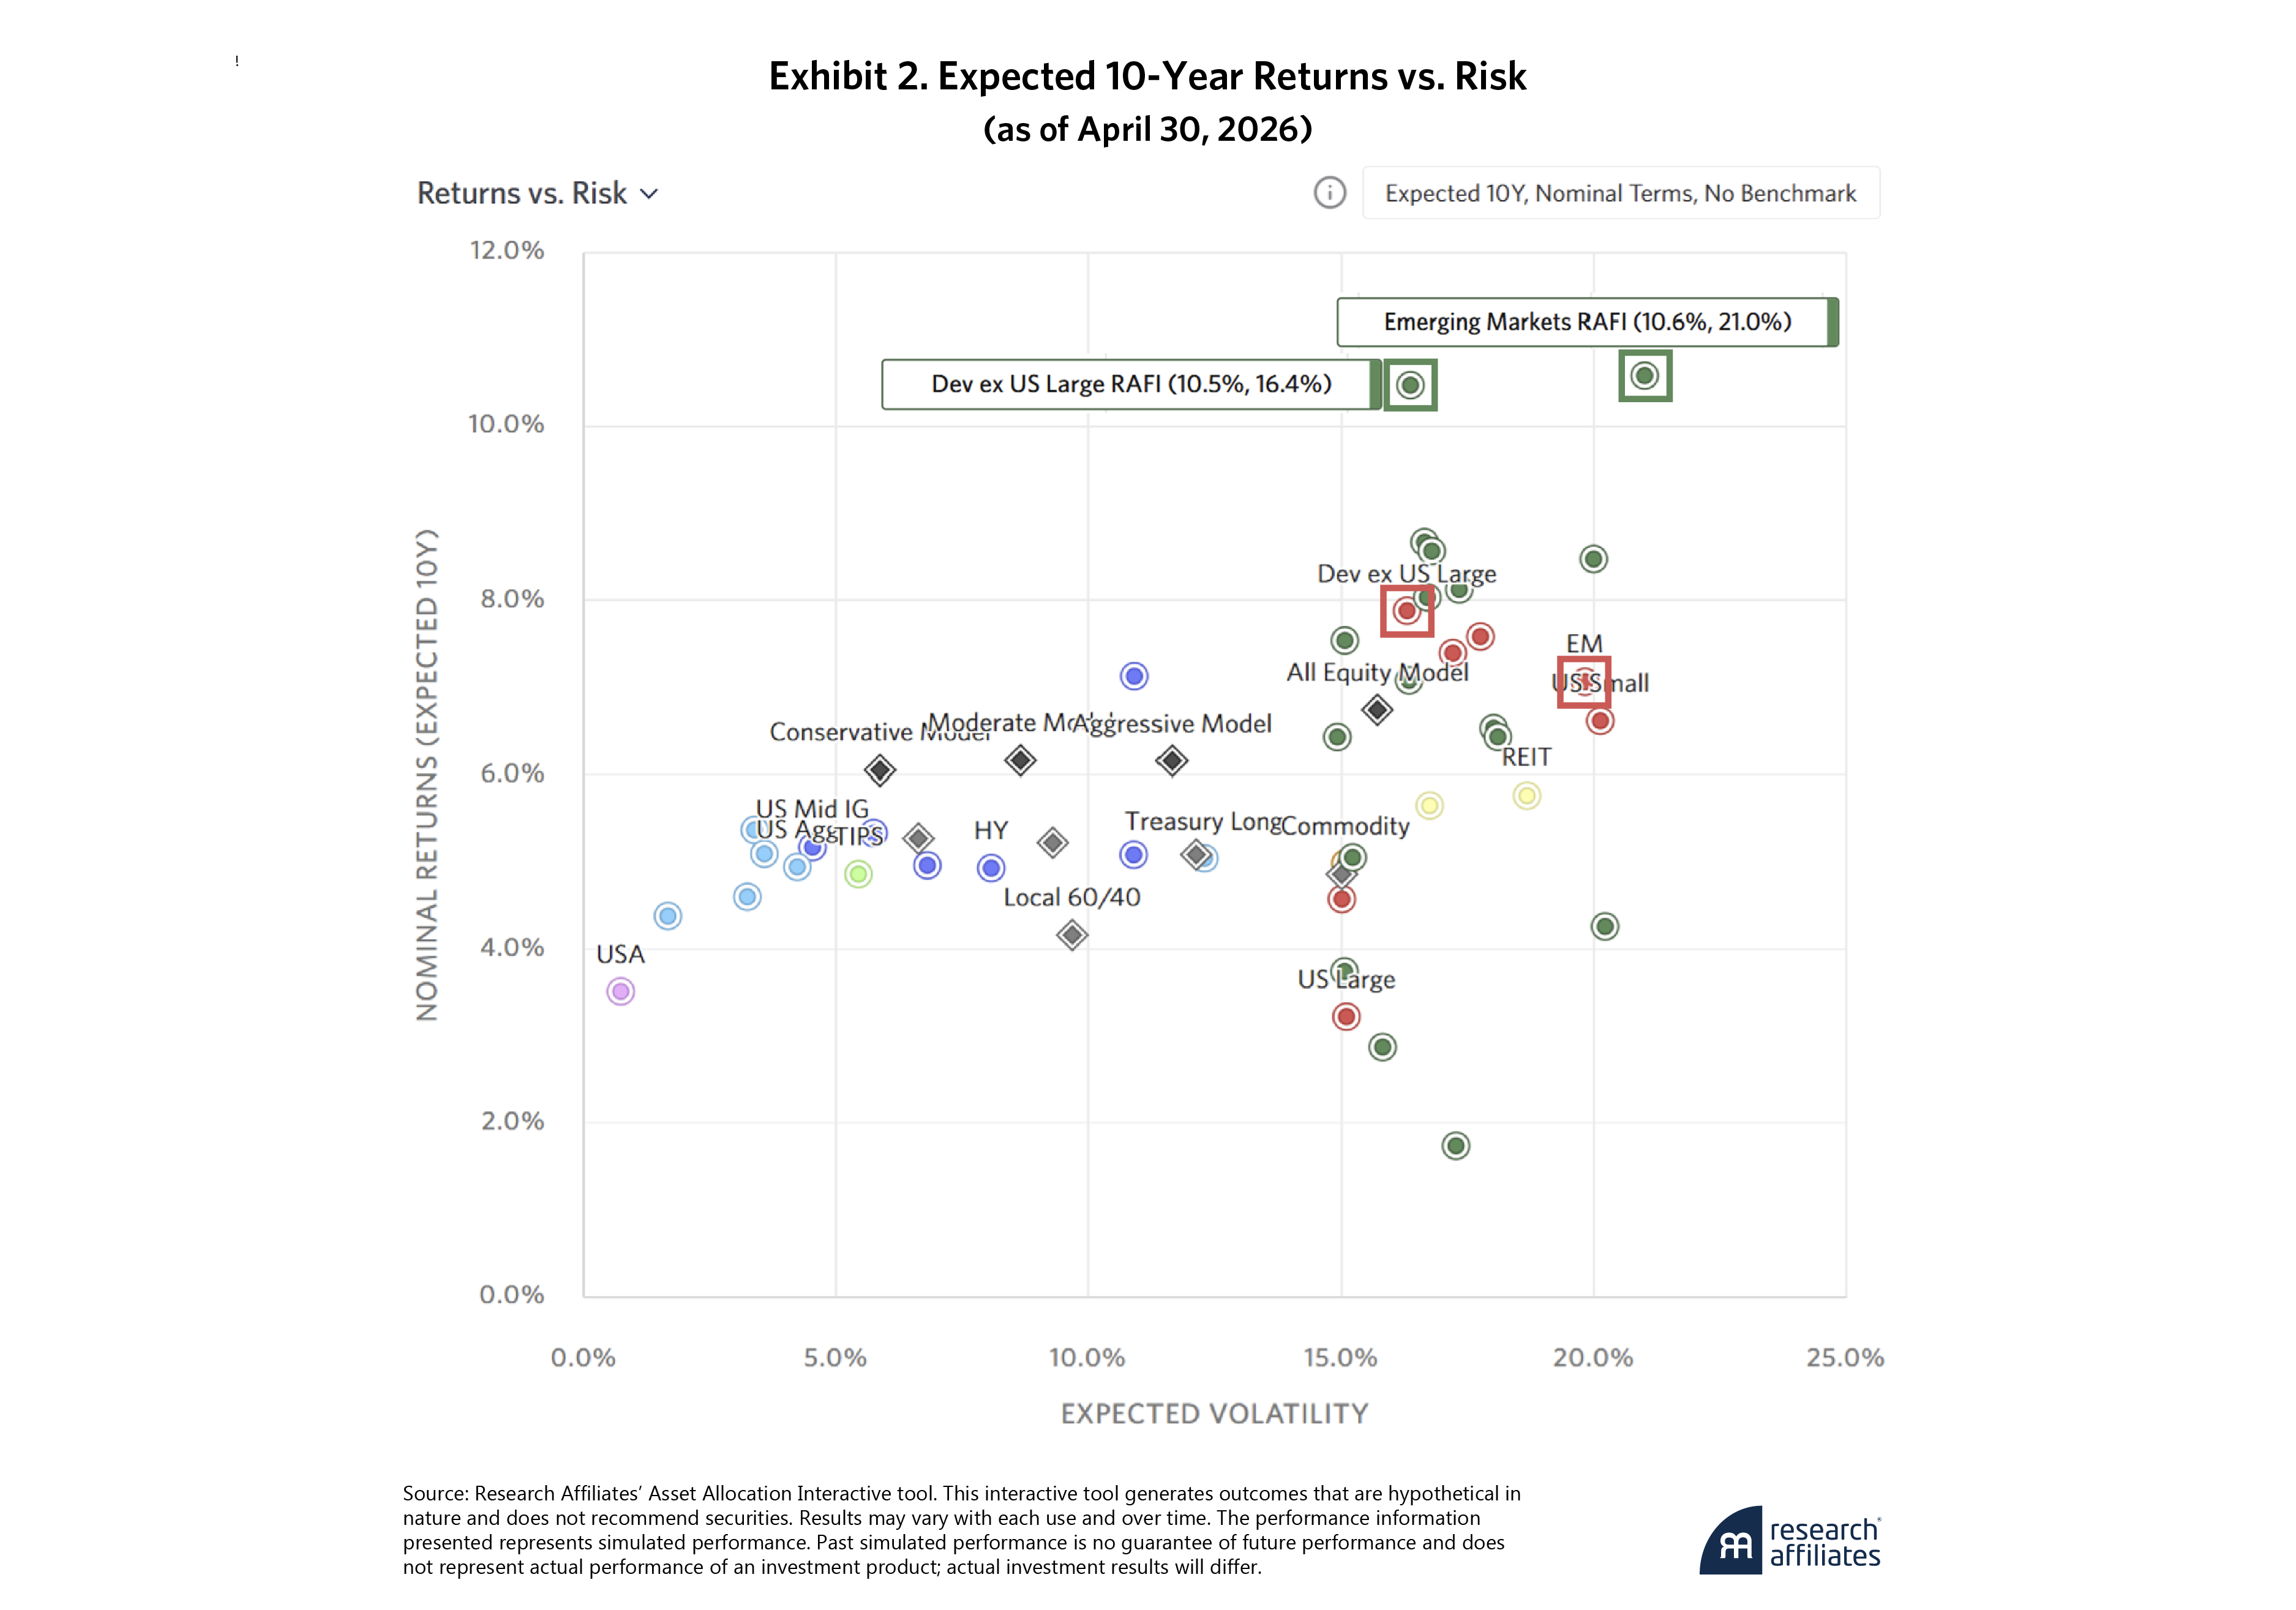
AAI applies our Yield + Growth + Valuation Change model for broad cap-weighted equity indices. CAPE ratios remain modest, at 21.3 and 22.2, respectively, for Developed ex US and Emerging Markets, and indicate strong yield and growth characteristics. As Exhibit 2 shows in red, our model forecasts nominal returns of 7.9% and 7.1%, respectively, for those same markets over the next 10 years.
AAI’s two highest 10-year expected return forecasts are for international large-cap value equity strategies – Emerging Markets RAFI and Dev ex US Large RAFI.
Dev ex US RAFI and Emerging Markets RAFI (both in green) are active equity styles within those markets. Each contains a fourth expected return component: Alpha.
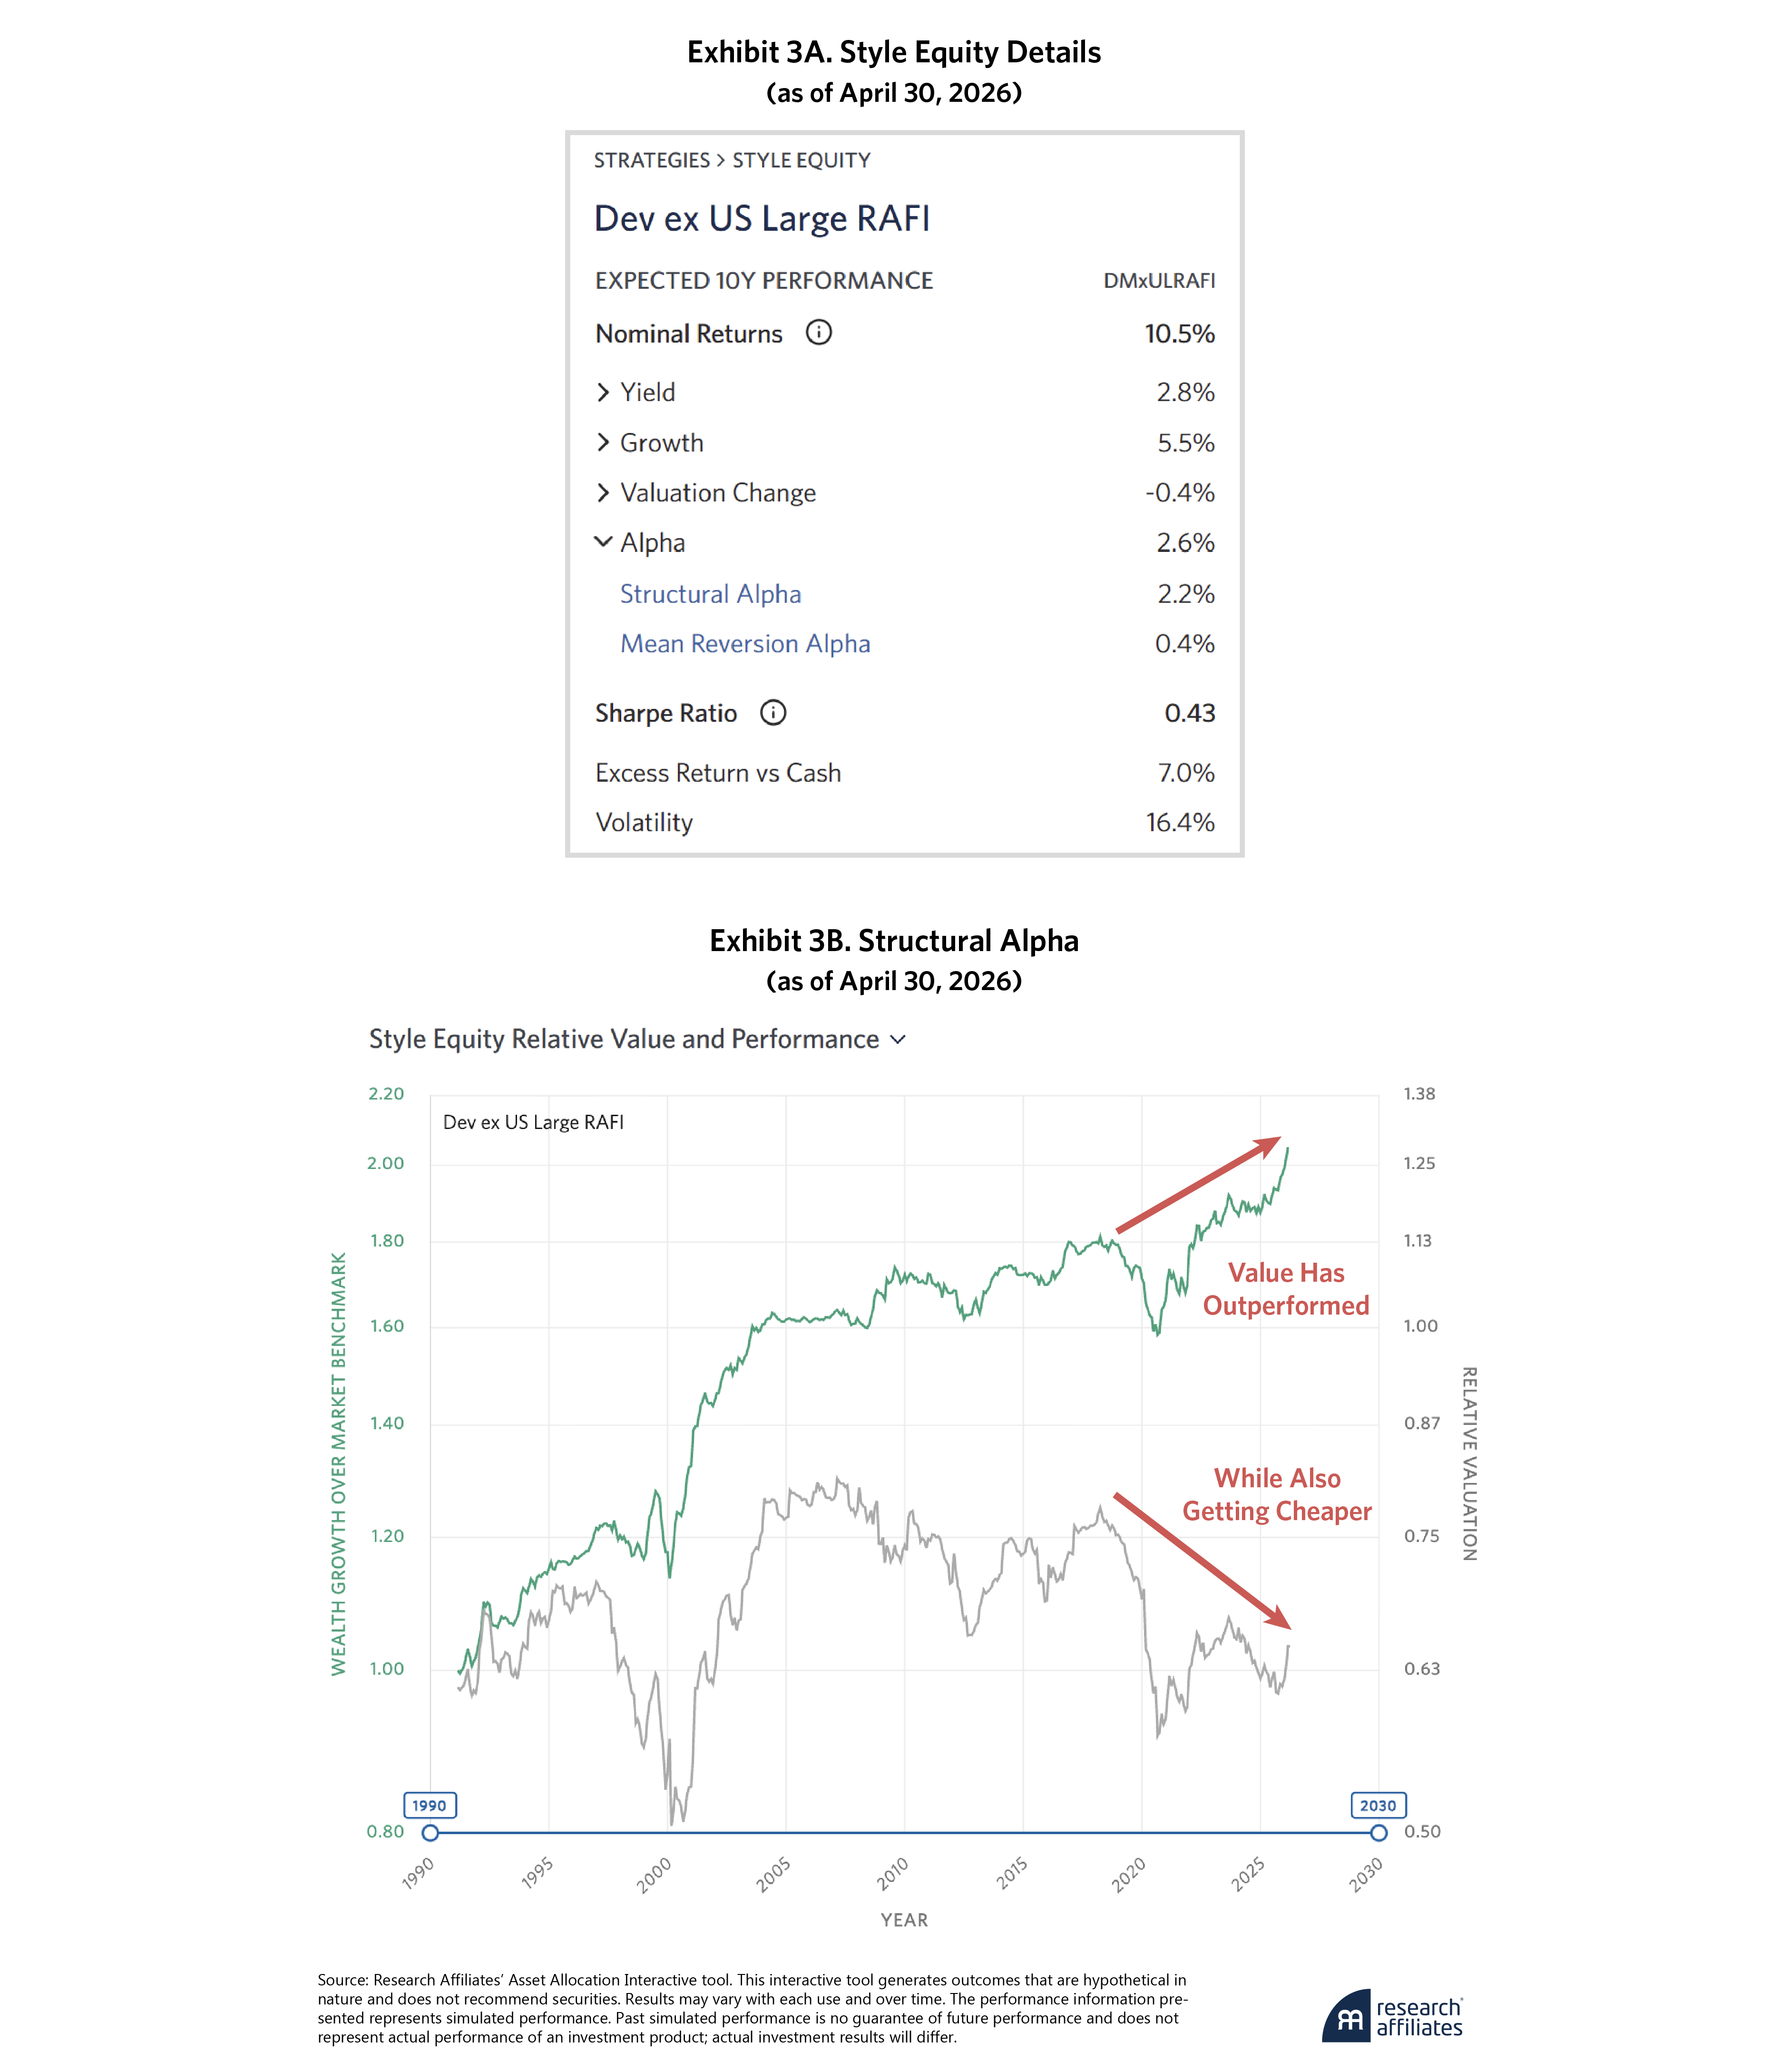
Dev ex US RAFI’s and Emerging Markets RAFI’s Alpha forecasts are 2.6% and 3.5% per annum, respectively, for the next 10 years. Style equity Alphas have two sources: Structural Alpha and Mean Reversion Alpha. Selecting these from a Style Equity’s details table surfaces additional charts that provide further insight into each alpha category.
Exhibit 3B shows the relative performance of Dev ex US RAFI versus the cap-weighted market in green. It increases when the strategy is beating the market and decreases when it is lagging. The gray line and right axis indicate the RAFI index’s relative valuation: It is high when the strategy is expensive compared to the market and low when it is cheap.
Normally, the green and gray lines move in parallel, especially over short spans: When a strategy outperforms, it tends to get more expensive, and our future alpha expectations fall. Likewise, though difficult to stomach as an investor, when underperformance sends its price lower, its future alpha expectations increase. Over longer periods, like our 35-year span, the two lines diverge as the index earns a persistent premium beyond its valuation’s ebbs and flows. We call the long-term widening in this gap a strategy’s “Structural Alpha.”
Though they typically move in tandem, Dev ex US RAFI’s relative performance and valuation have actually diverged significantly in recent years. Despite its outperformance over the last one-, three-, and five-year samples, as Exhibit 1 shows, outside the tech bubble and COVID-19 crisis, international value has rarely been cheaper. Why? Because of a combination of rebalancing out of expensive stocks, sectors, and regions into cheaper ones, and improving fundamentals leading to lower valuation ratios.
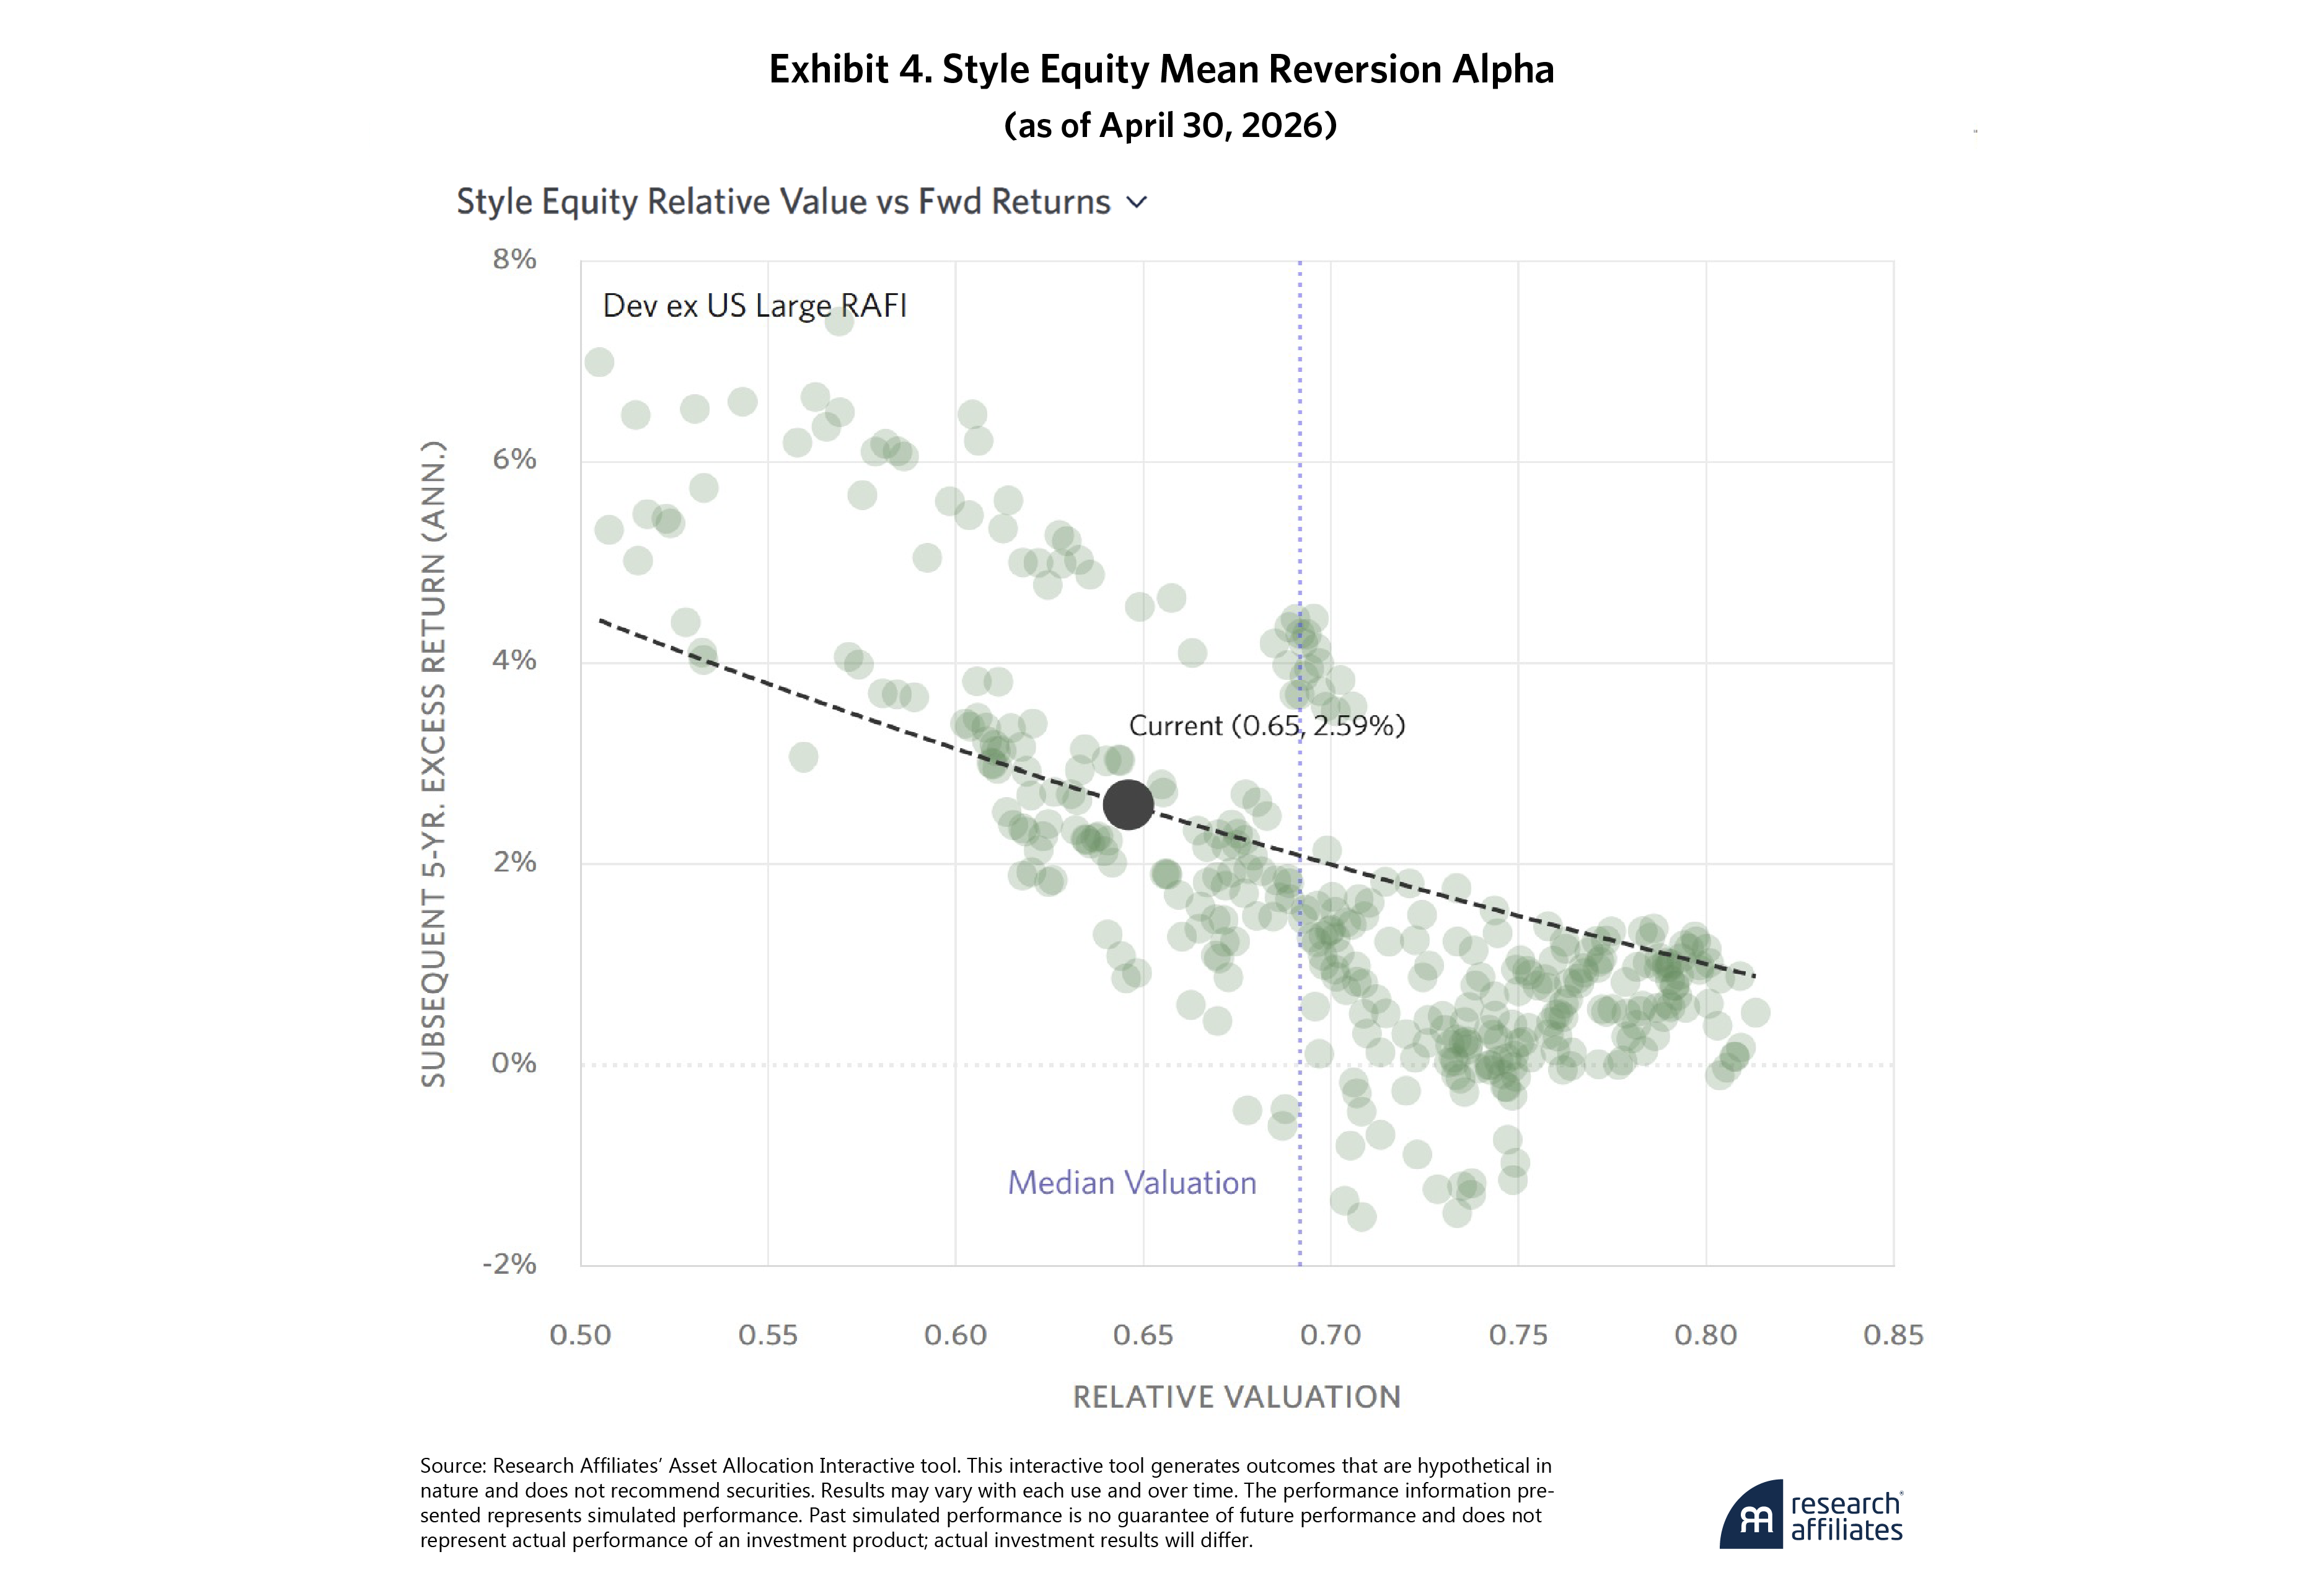
Note that Dev ex US RAFI’s current 0.65 valuation level has historically been a great entry point for investors seeking exposure to the strategy. Exhibit 4 shows its relative valuation against the subsequent five-year excess return. (Readers can explore charts for this and any other style equity strategy on AAI by selecting the “Mean Reversion Alpha” link in the strategy’s details.)
[O]utside the tech bubble and COVID-19 crisis, international value has rarely been cheaper.
The index’s expected Alpha based on its current valuation level is represented by the dotted line. Mean reversion from this low valuation gives it an additional boost beyond its 2.2% Structural Alpha. If this model looks conservative at low valuations, it is. Historically, for a strategy this cheap relative to the market, a 2.8% subsequent alpha is well within reason. We encourage readers to dig into the same charts for the equally attractive Emerging Markets RAFI as well.
For those watching the resurgence of Developed ex US and Emerging Markets value strategies or looking at performance tables like Exhibit 1 from the shore and wondering whether they missed the boat, take heart. Our data indicates that the move could be just getting started.
Please read our disclosures concurrent with this publication: https://www.researchaffiliates.com/legal/disclosures#investment-adviser-disclosure-and-disclaimers.
Noah Beck is Vice President, Strategy Research, Equity Strategies at Research Affiliates.
© Research Affiliates
Read more commentaries by Research Affiliates