The Retirement Hack Hiding Inside Most DC Plans
Membership required
Membership is now required to use this feature. To learn more:
View Membership BenefitsMany debates in defined contribution (DC) circles focus on fees, new asset classes, and ever more complex solutions. But the biggest improvement available to plan participants may come from something far simpler: how their fixed income is managed. Active portfolio managers have touted the improved investor outcomes associated with their management style, while their passive counterparts stressed the simplicity of their approach and lower fees. But what does this all mean for plan participants? To answer this question, it is helpful to go beyond abstract concepts like “improved outcomes” or even the precise, but difficult to interpret, measures of performance such as “higher annual returns.”
We quantify the impact of actively managed fixed income on four easy to interpret objectives that are broadly relevant for participants saving for retirement:
- How much longer could retirees stretch their dollars in retirement and reduce the risk of running out of money?
- Could active management help them retire earlier, should they wish to do so?
- How much could active fixed income help for working age participants who may want to save more?
- How much more could investors afford to spend in retirement by choosing actively managed options?
As we will see, actively managed fixed income can significantly improve retirement outcomes without requiring higher contributions or added complexity.
Our approach
To evaluate how active management measures up against passive strategies, we examine a hypothetical plan participant who:
- Invests across their full lifecycle. This includes a 40‑year accumulation period during which they contribute to the plan and earn investment returns—followed by a 20‑to-30‑year retirement, during which they draw down their retirement plan nest egg while continuing to earn investment returns on the remaining assets.
- Follows a typical target date fund glide path (based on PIMCO’s flagship designI), with earnings, contributions and employer match patterns calibrated to national averages across ages.
The passively-managed reference portfolio assumes index‑based implementation across the portfolio, while the active approach assumes that only the fixed income assets—where a more consistent history of generating excess returns, or alpha, exists (see Figure 1)II —are managed actively and receive excess returns consistent with those in PIMCO’s flagship retirement product.III
Figure 1: Active fixed income typically outperforms their passive counterparts—at nearly twice the rate of active equityIV on average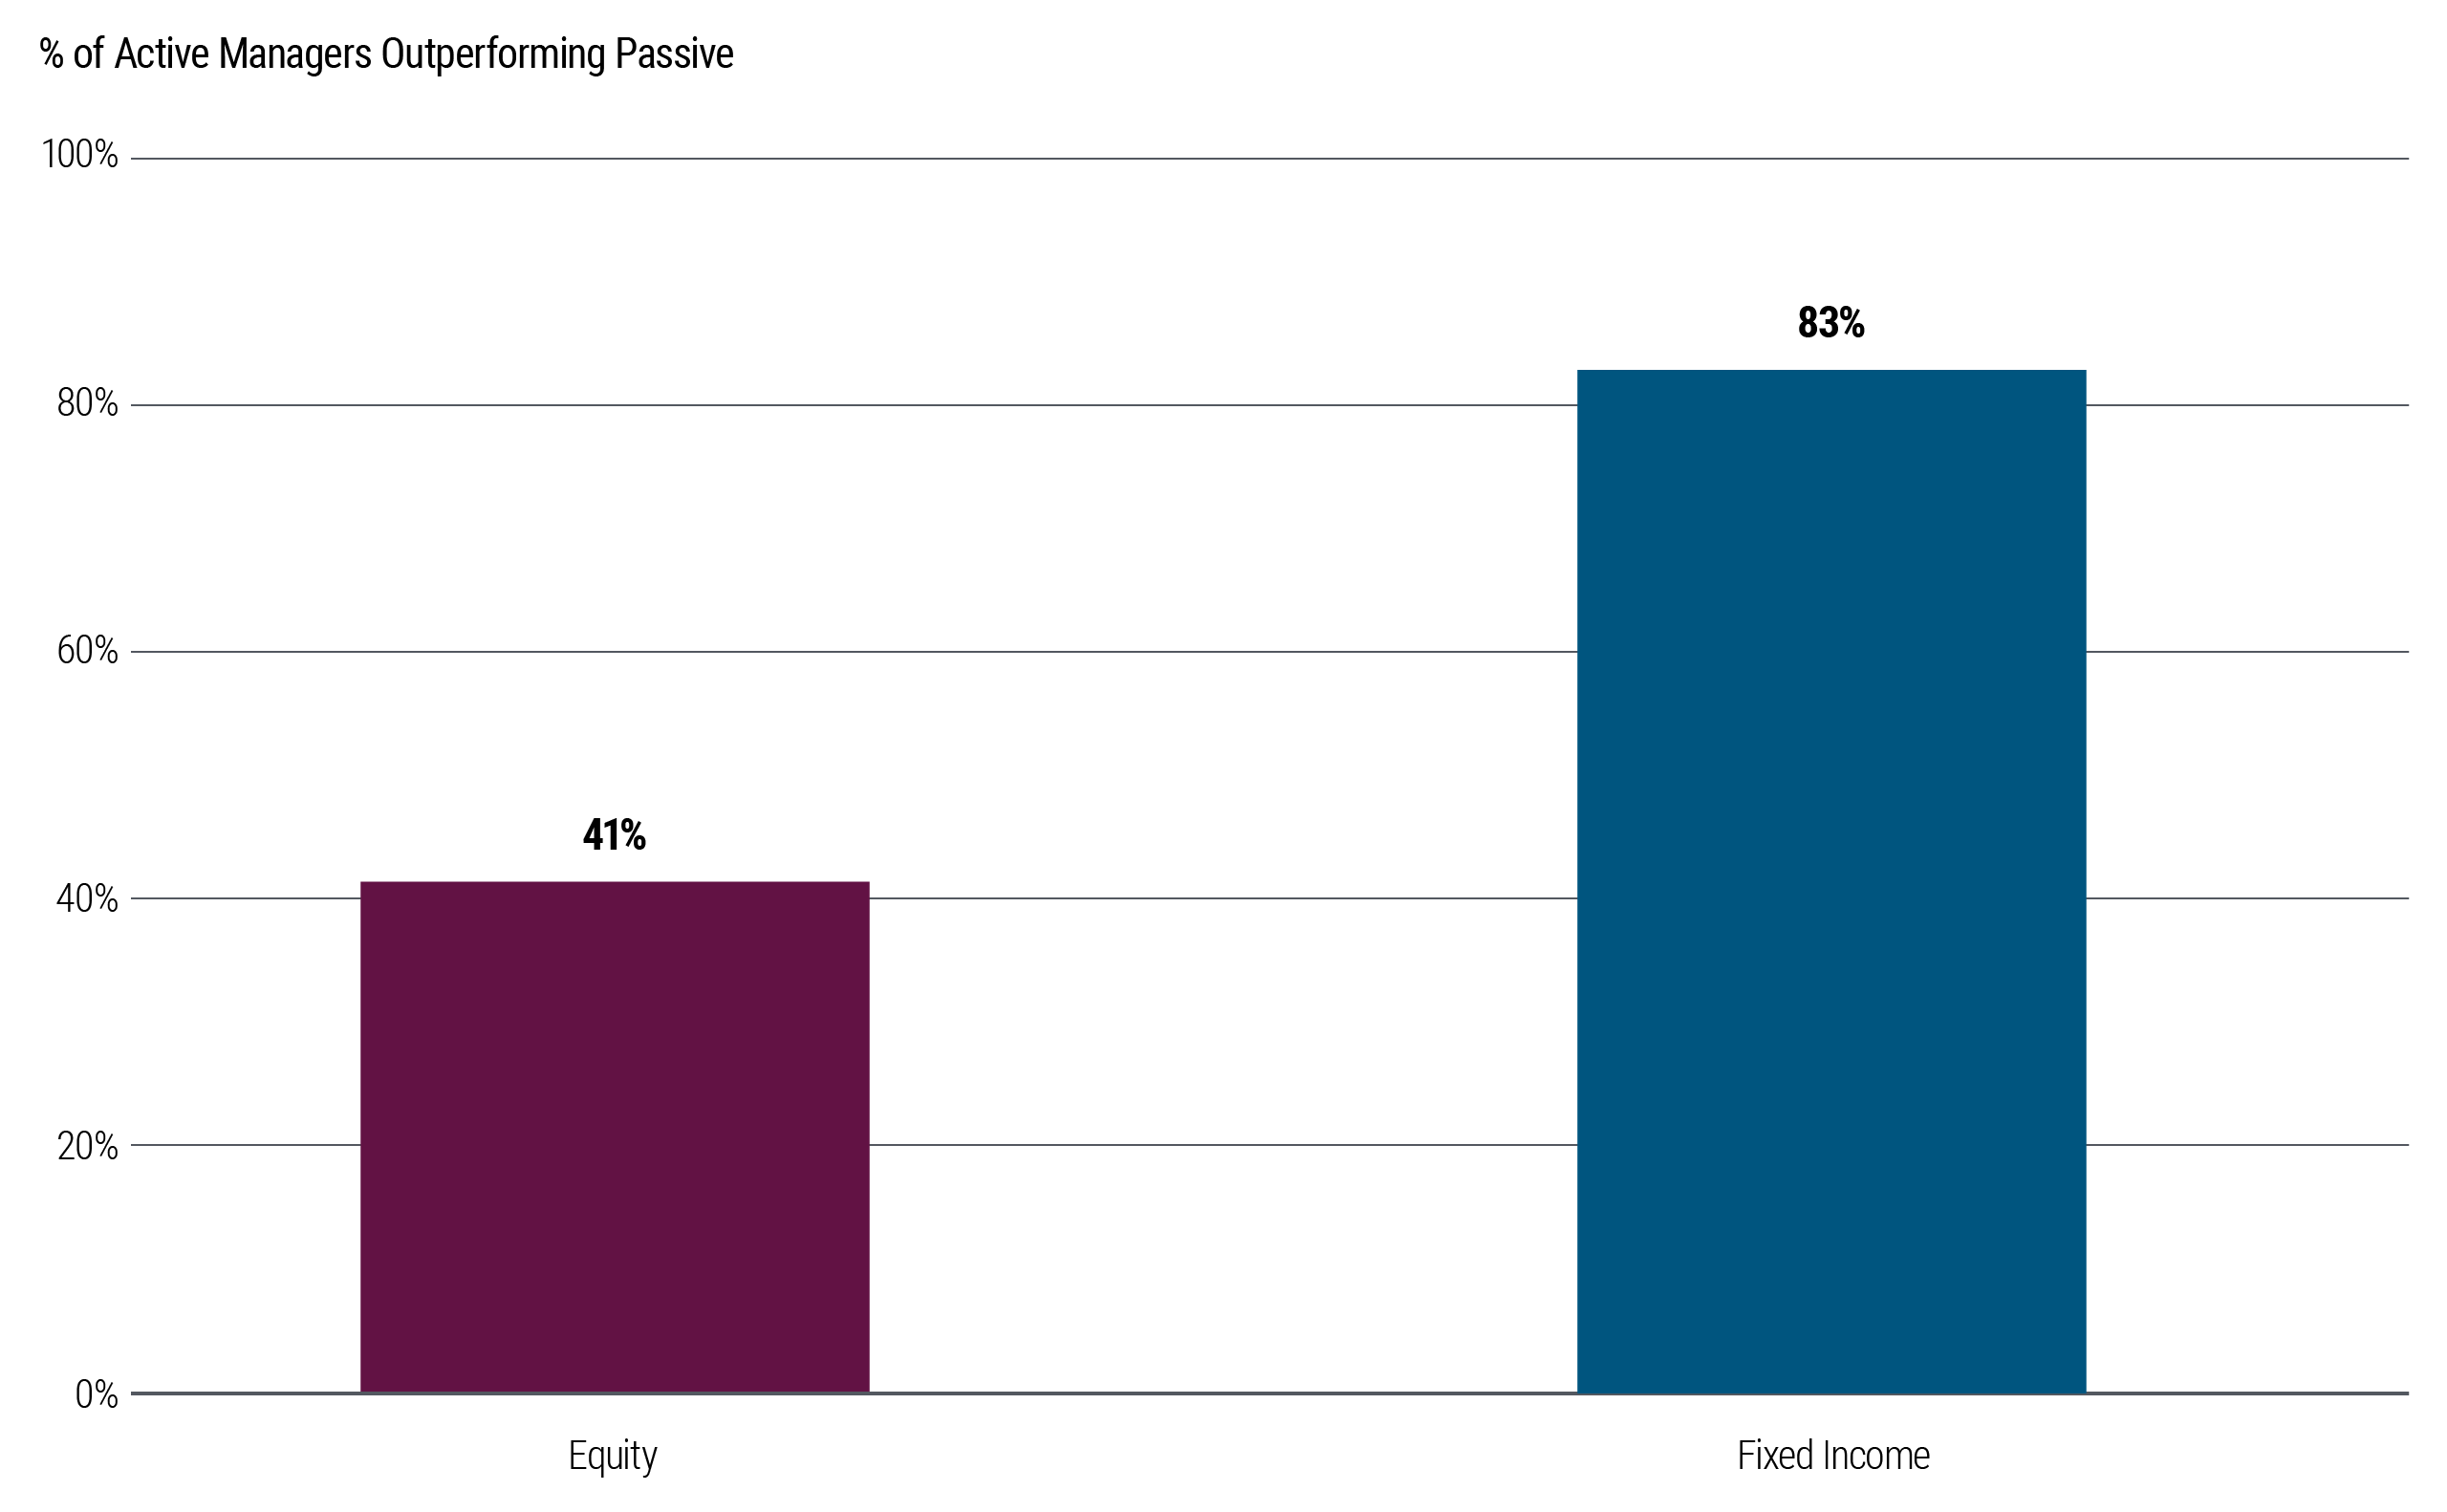
The outperformance provided by active fixed income provides substantial benefits to plan participants.
Concerned about “running out of money” in retirement?
One of the most common concerns for near- and already retired participants is the fear that they will outlive their retirement savings, especially as lifespans continue to increase and inflation forces them to consume a larger share of their accumulated assets each year. How could active fixed income extend their savings?
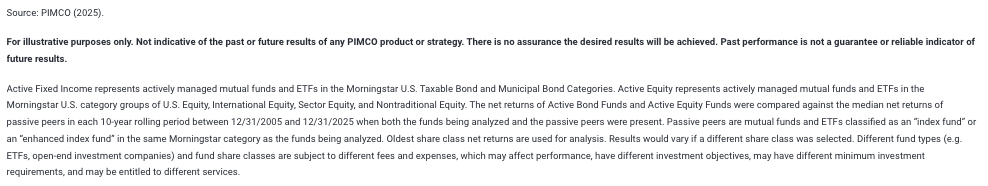
Our findings show that the incremental wealth associated with active fixed income excess returns and gained over the 40-year accumulation period may enable plan participants to extend the life of their retirement savings by an additional four years on average for those with a 20-year retirement planning horizon. For those concerned with longer retirements, the benefits are even more significant. A 30-year retirement could extend asset longevity by at least a full decade on average, as shown in Figure 2 below.
Figure 2: Active fixed income may help tetirement savings last longer than passive


In other words, for the same participant earnings and identical lifetime savings, market returns, inflation and (real) retirement spendingV, active fixed income alone can increase the longevity of a participant’s assets by 20% - 33%.
Wish you could retire earlier?
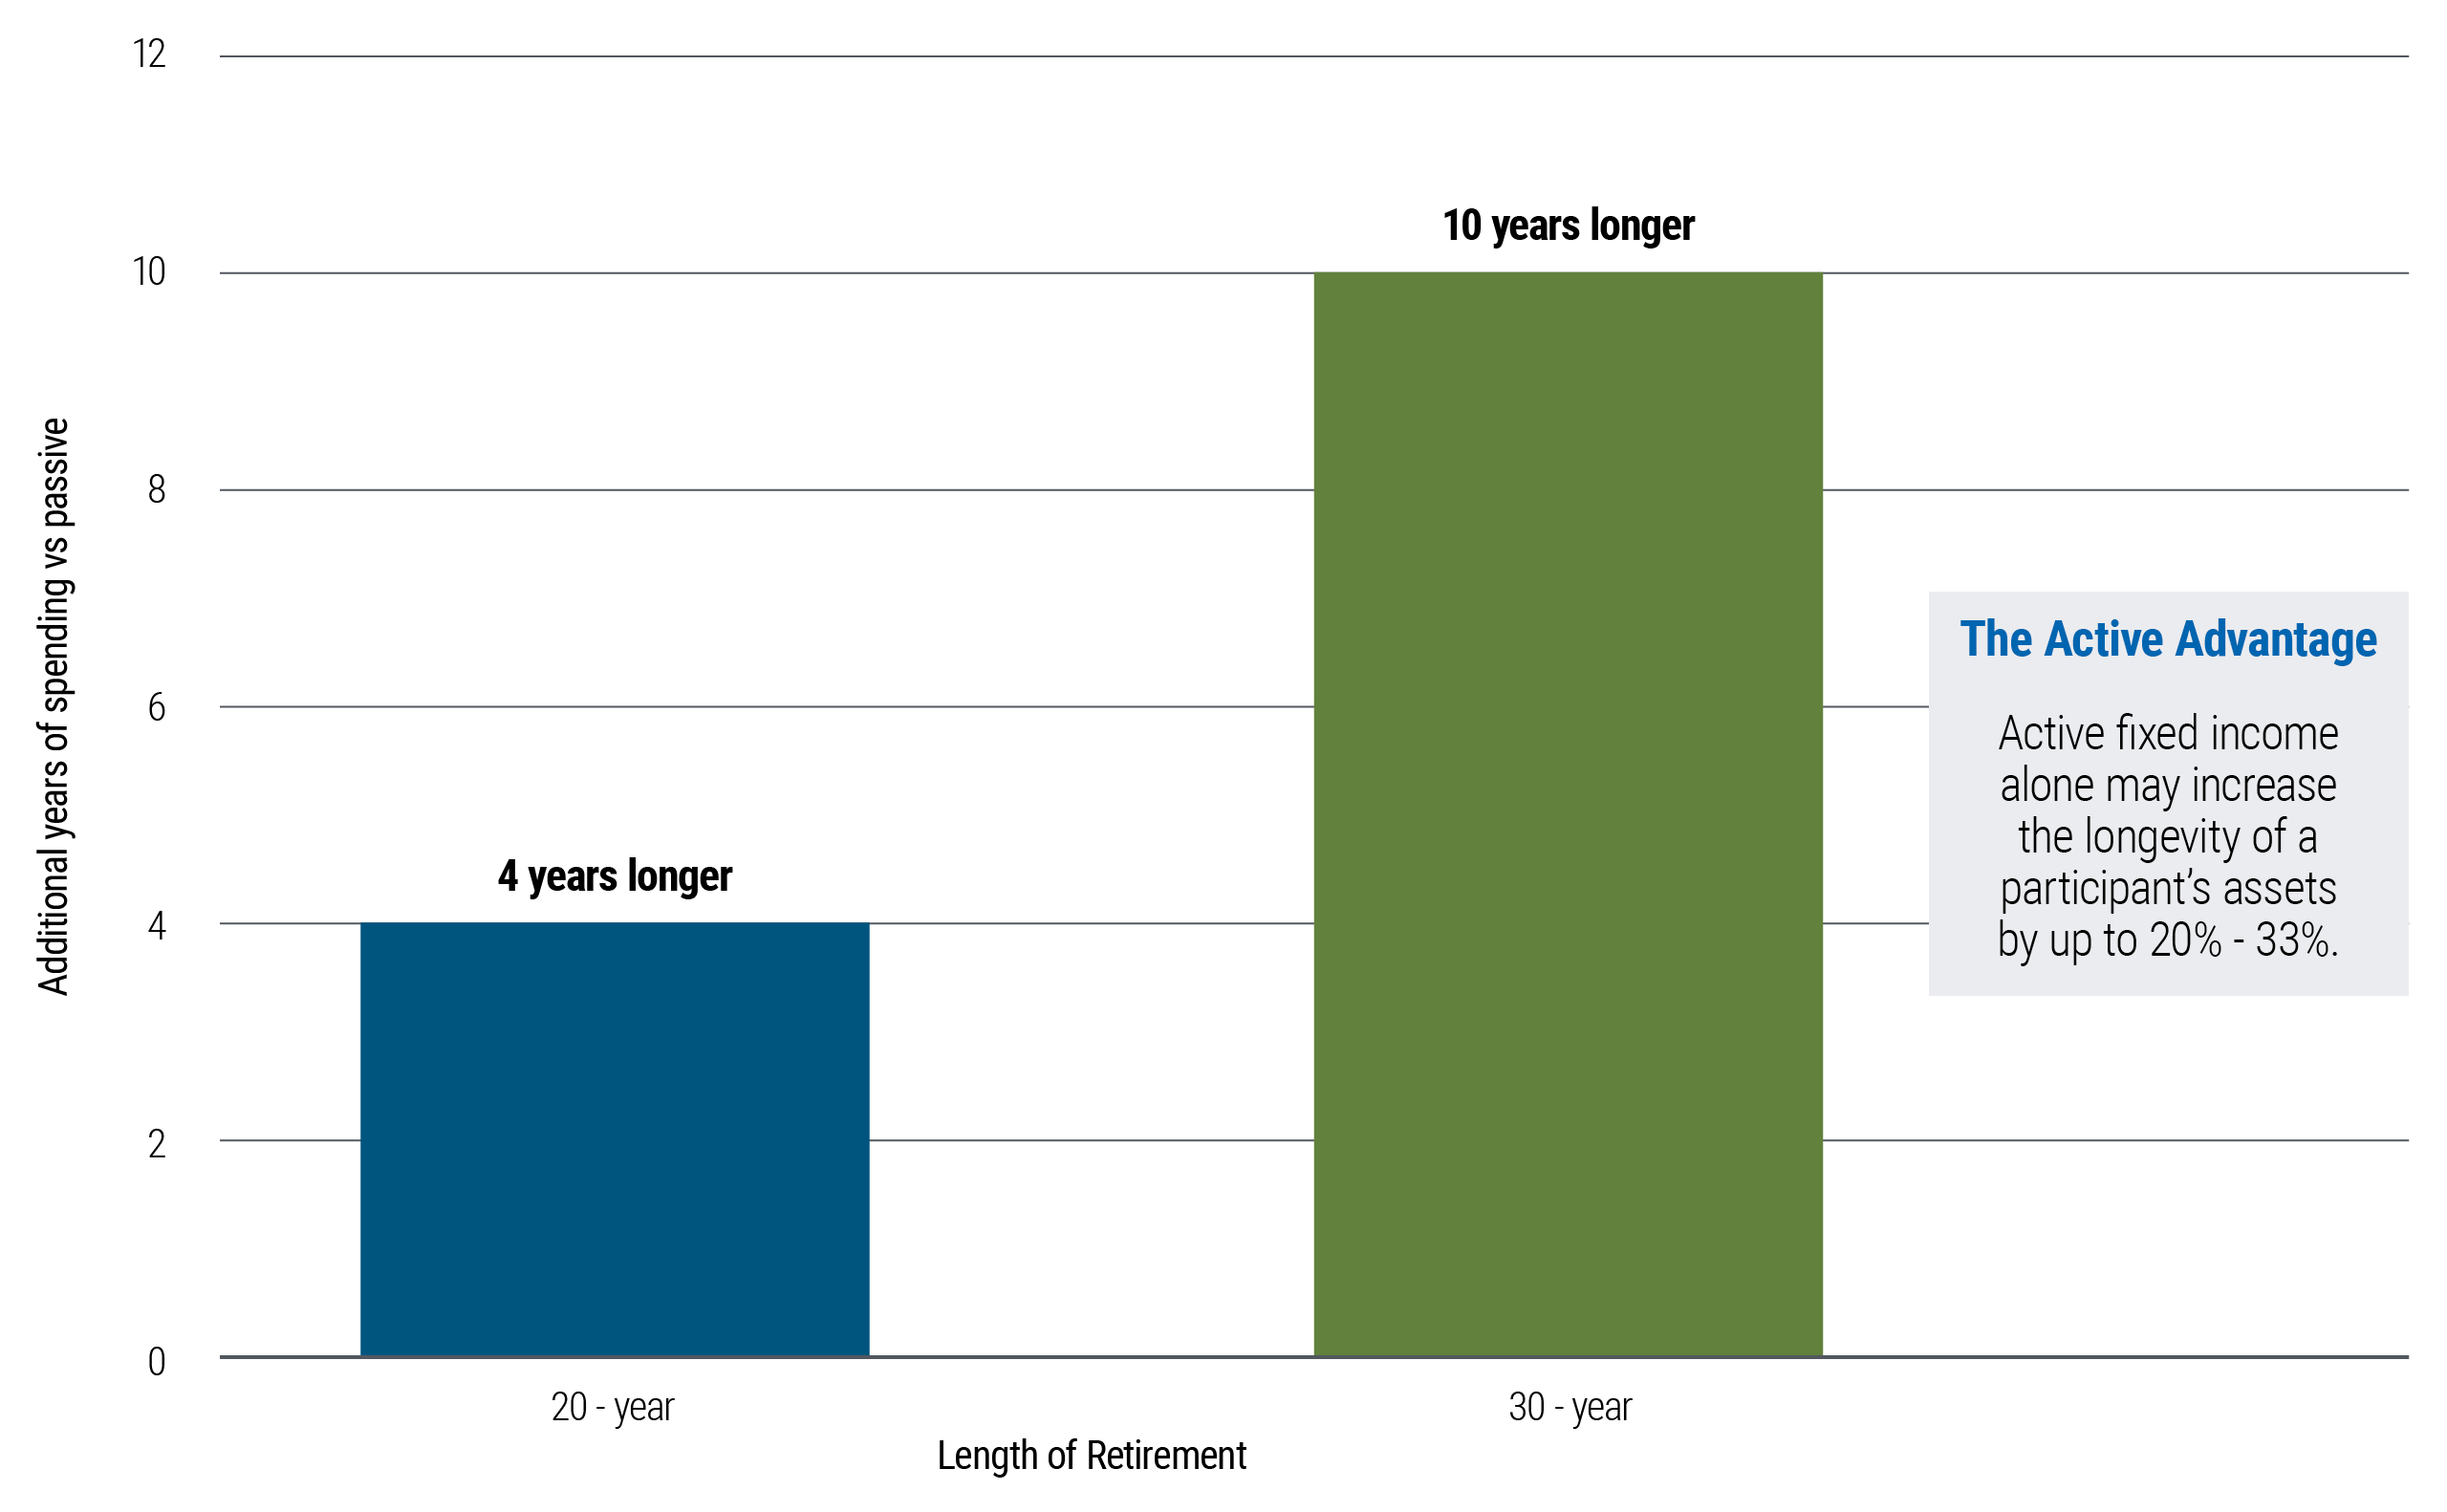
While the asset longevity gains could be substantial, the fruits of actively-managed fixed income can be used towards many other objectives. For example, many participants might find the idea of retiring earlier while still maintaining the same standard of living in retirement to be enticing. Our analysis shows that our hypothetical plan participant with the same savings rate behavior as a passive investor, but using actively managed fixed income, could potentially retire several years earlier on average (as shown in Figure 3 below) and still maintain the same average real spending rate throughout retirement.
In other words, active management of fixed income assets could potentially enable plan participants to shorten a contemplated 40-year career by up to 9% to 20% and enjoy a substanitially similar standard of living in retirement compared to a passive implementation.
Figure 3: Early retirement potential without compromising estimated standard of living

Wish you could save more?
Many pundits often suggest that increasing participant savings rates is the most effective way to increase retirement wealth. In practice, however, it can be difficult for many to pay down student debt, purchase a home, raise children, or pay for college and still direct a larger amount of their pay towards retirement savings. But switching from passive investing to actively managed fixed income may offer benefits comparable to raising participant savings rates even when the latter is simply not feasible.
Similarly, plan sponsors may wish that they could provide an even higher match rate for their employees, but business realities might prevent them from doing so. Those employers could turn to active management of their DC plans to help employees achieve outcomes resembling those that could be achieved with a meaningfully higher match.
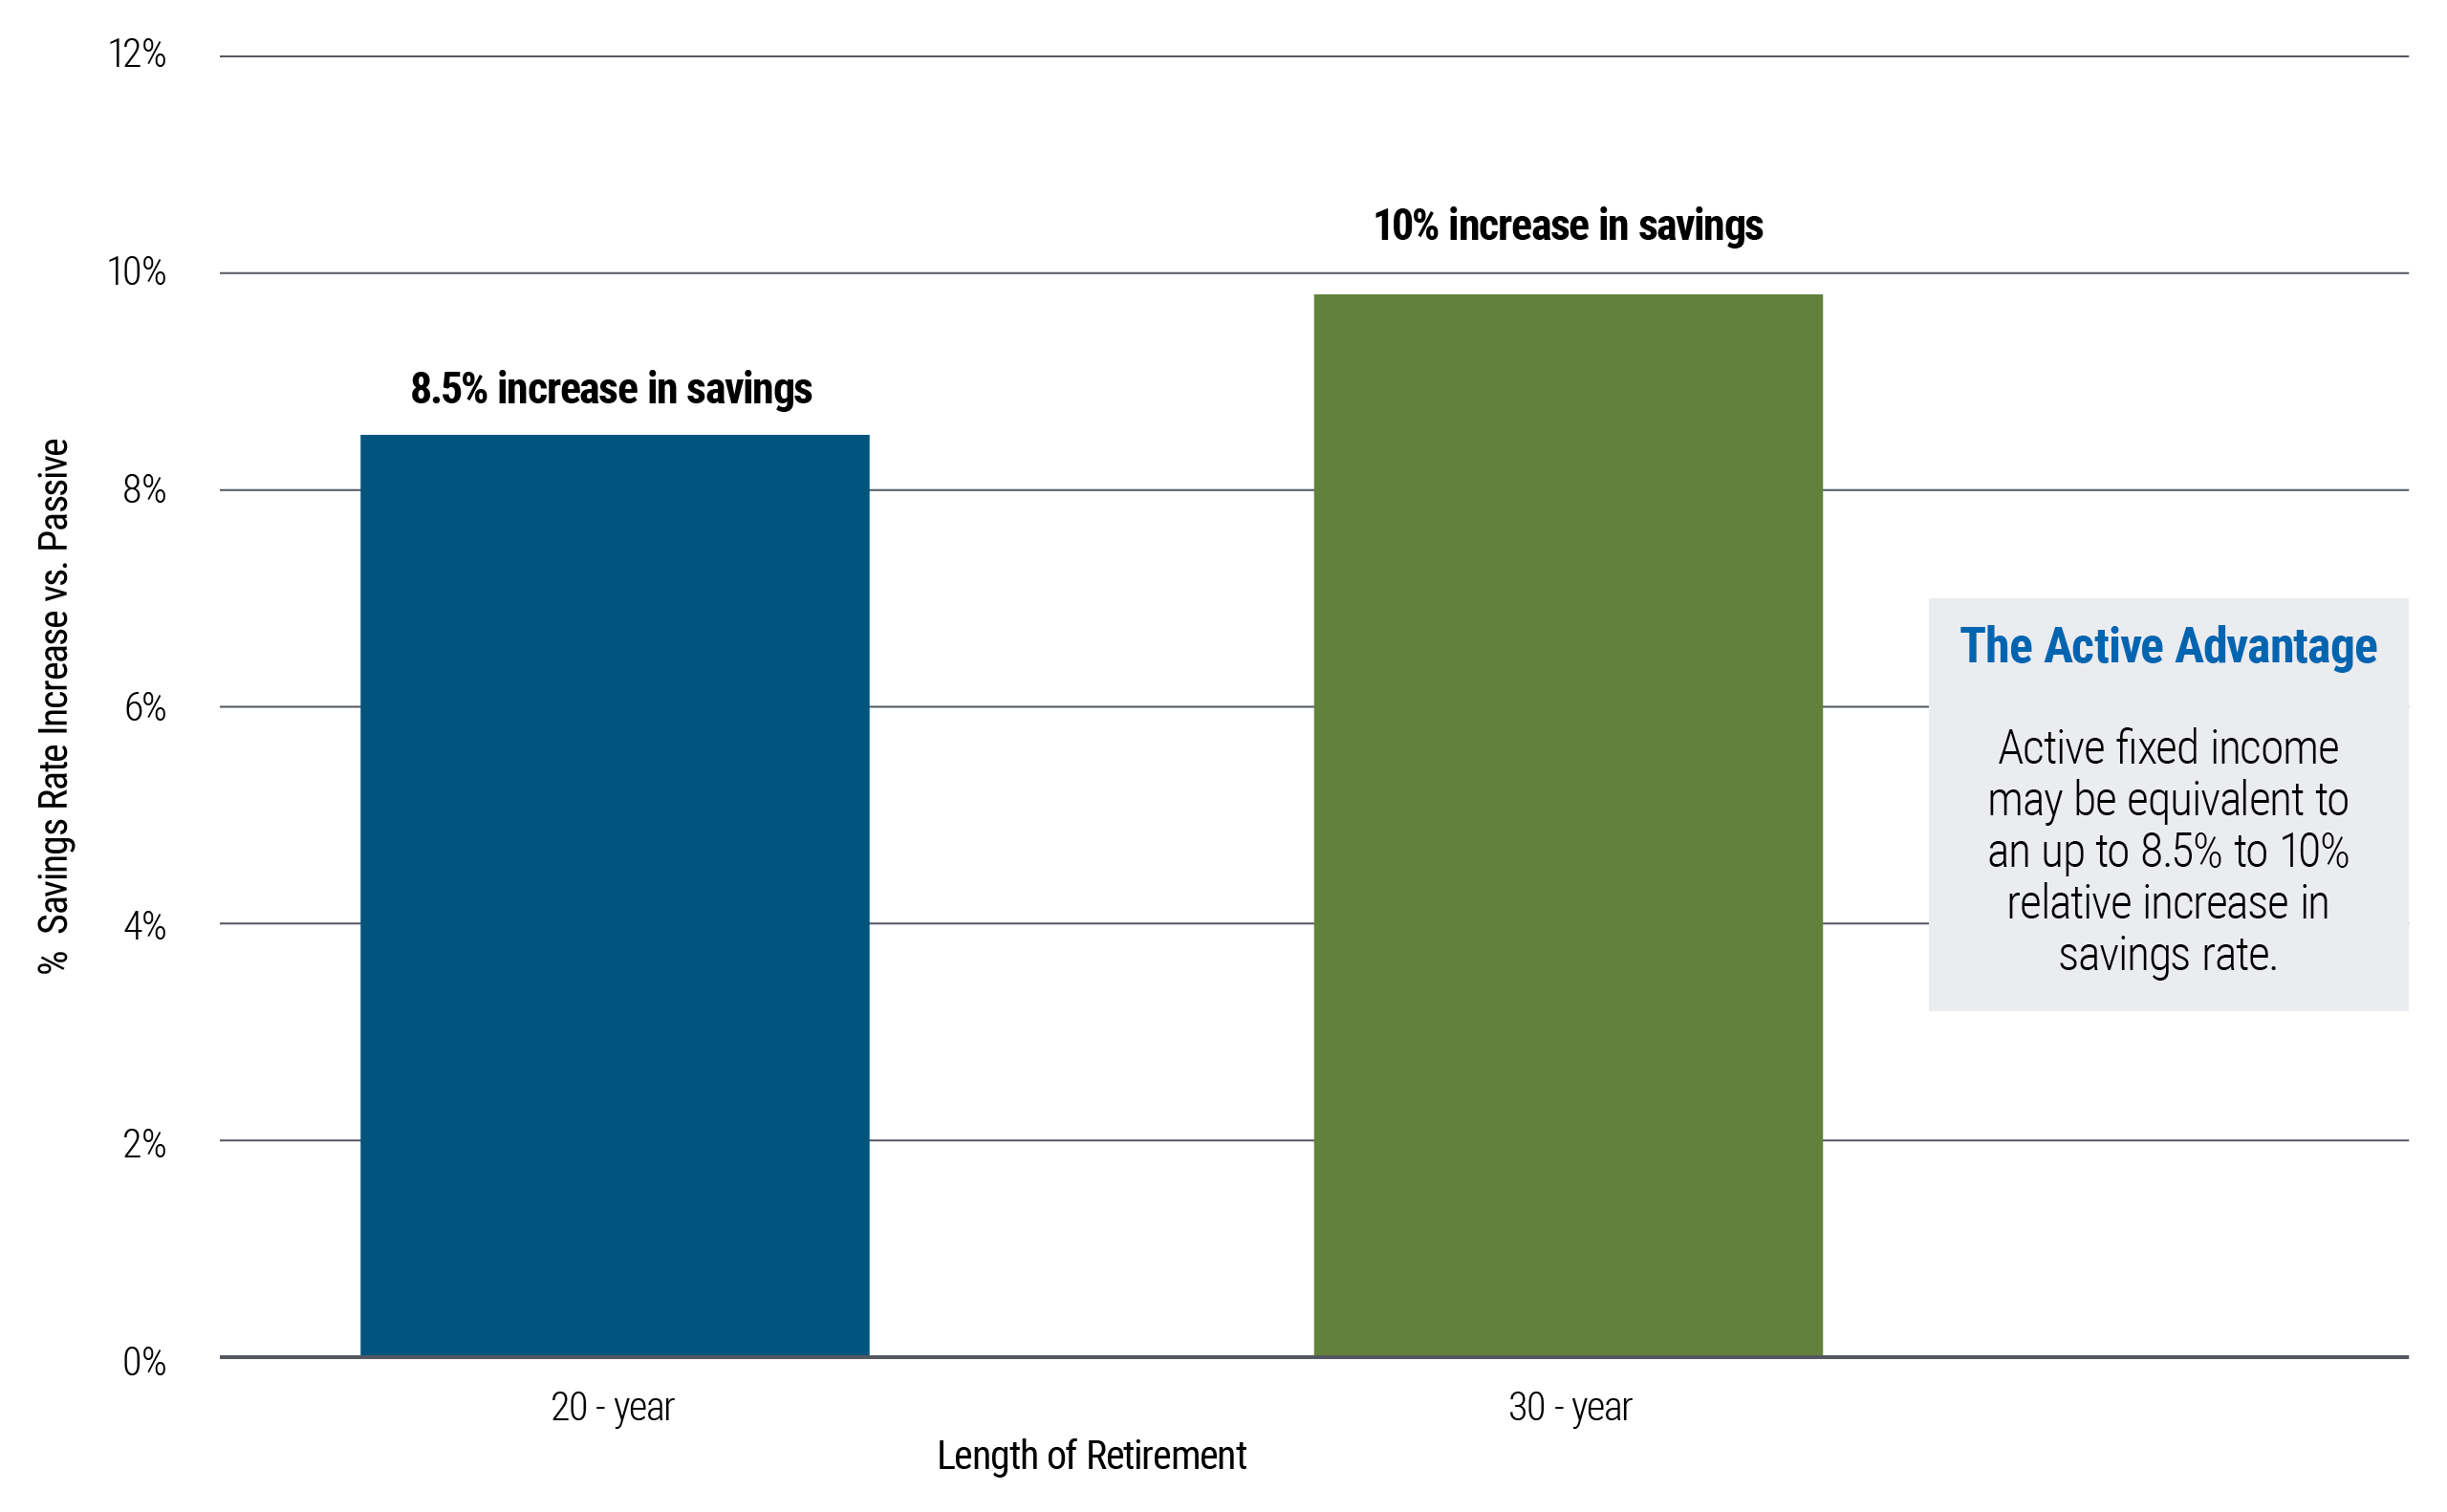
Using our hypothetical plan participant and historical performance data, we estimate that over a 20-30 year retirement period, actively managed fixed income can potentially improve retirement outcomes by the same amount as an 8.5% to 10% relative increase in an employee’s annual savings.VI
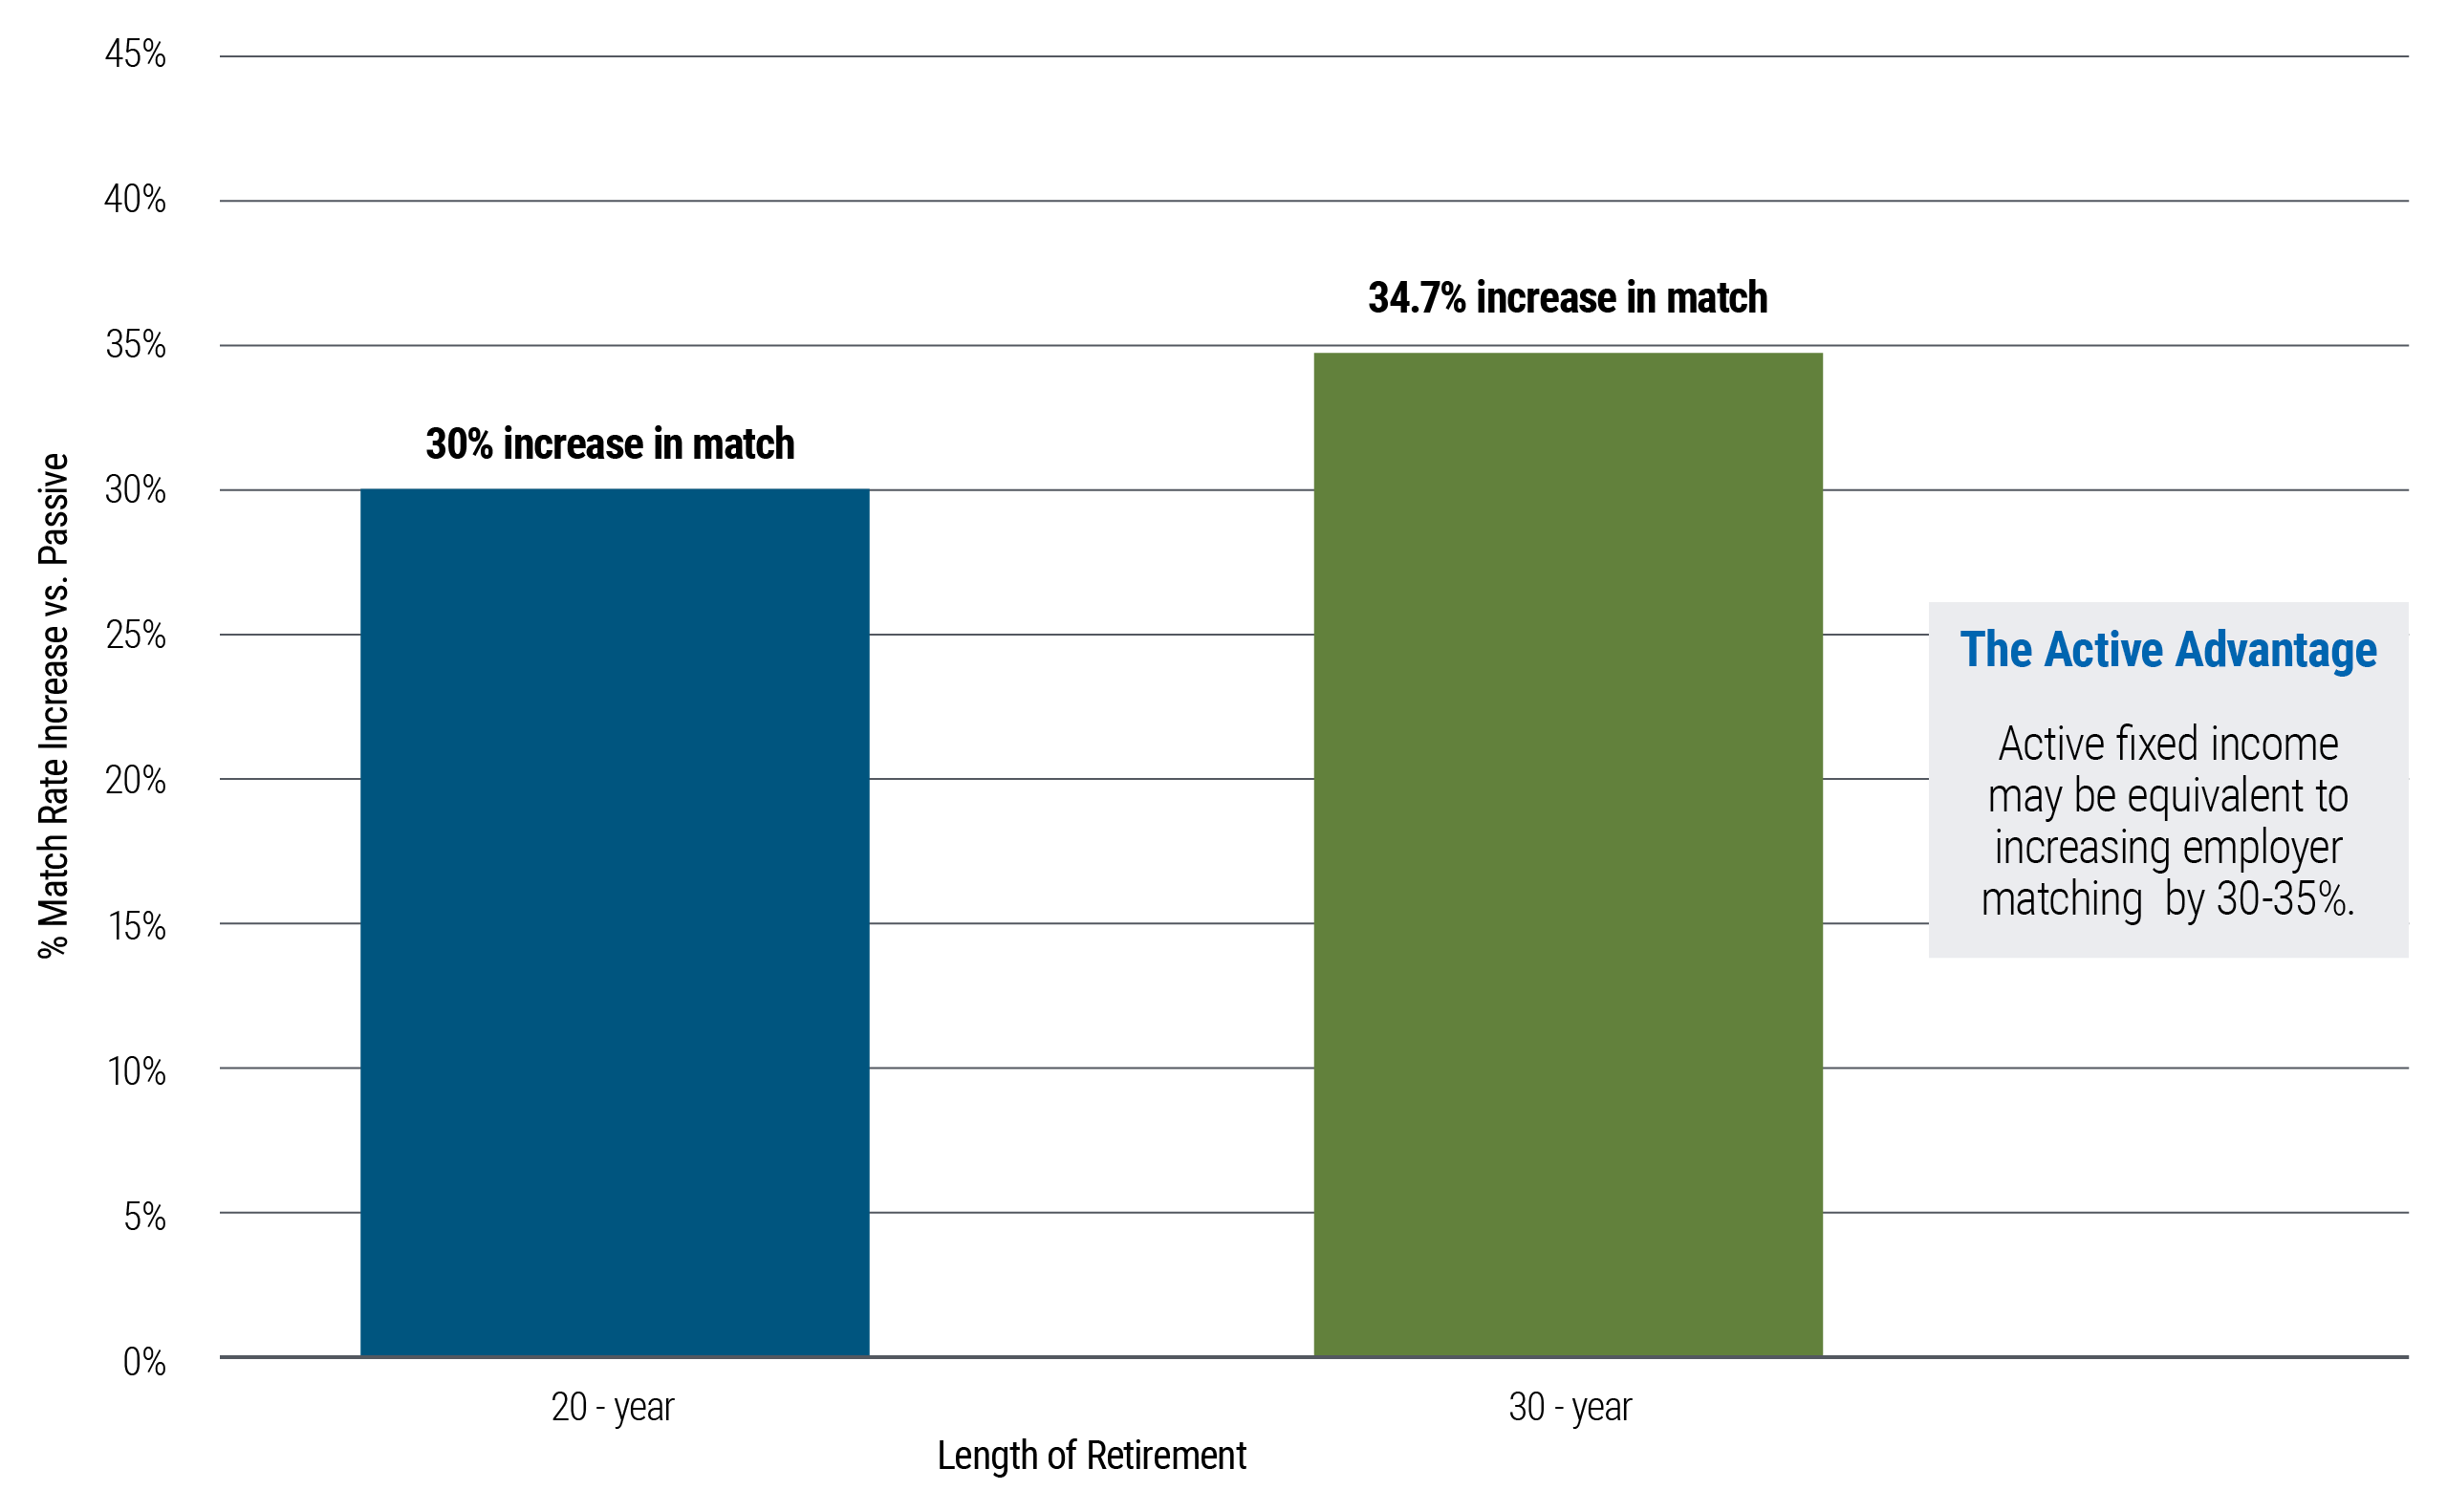
Figure 4: What if participants wish they could save more for retirement?

The estimated equivalent employer contribution is larger still: the calculation above implies that active fixed income could achieve increases in retirement spending that may require a 30% to 35% increase in the employer match if instead paired with a passive investment approach.

Wanting or needing to spend more in retirement?
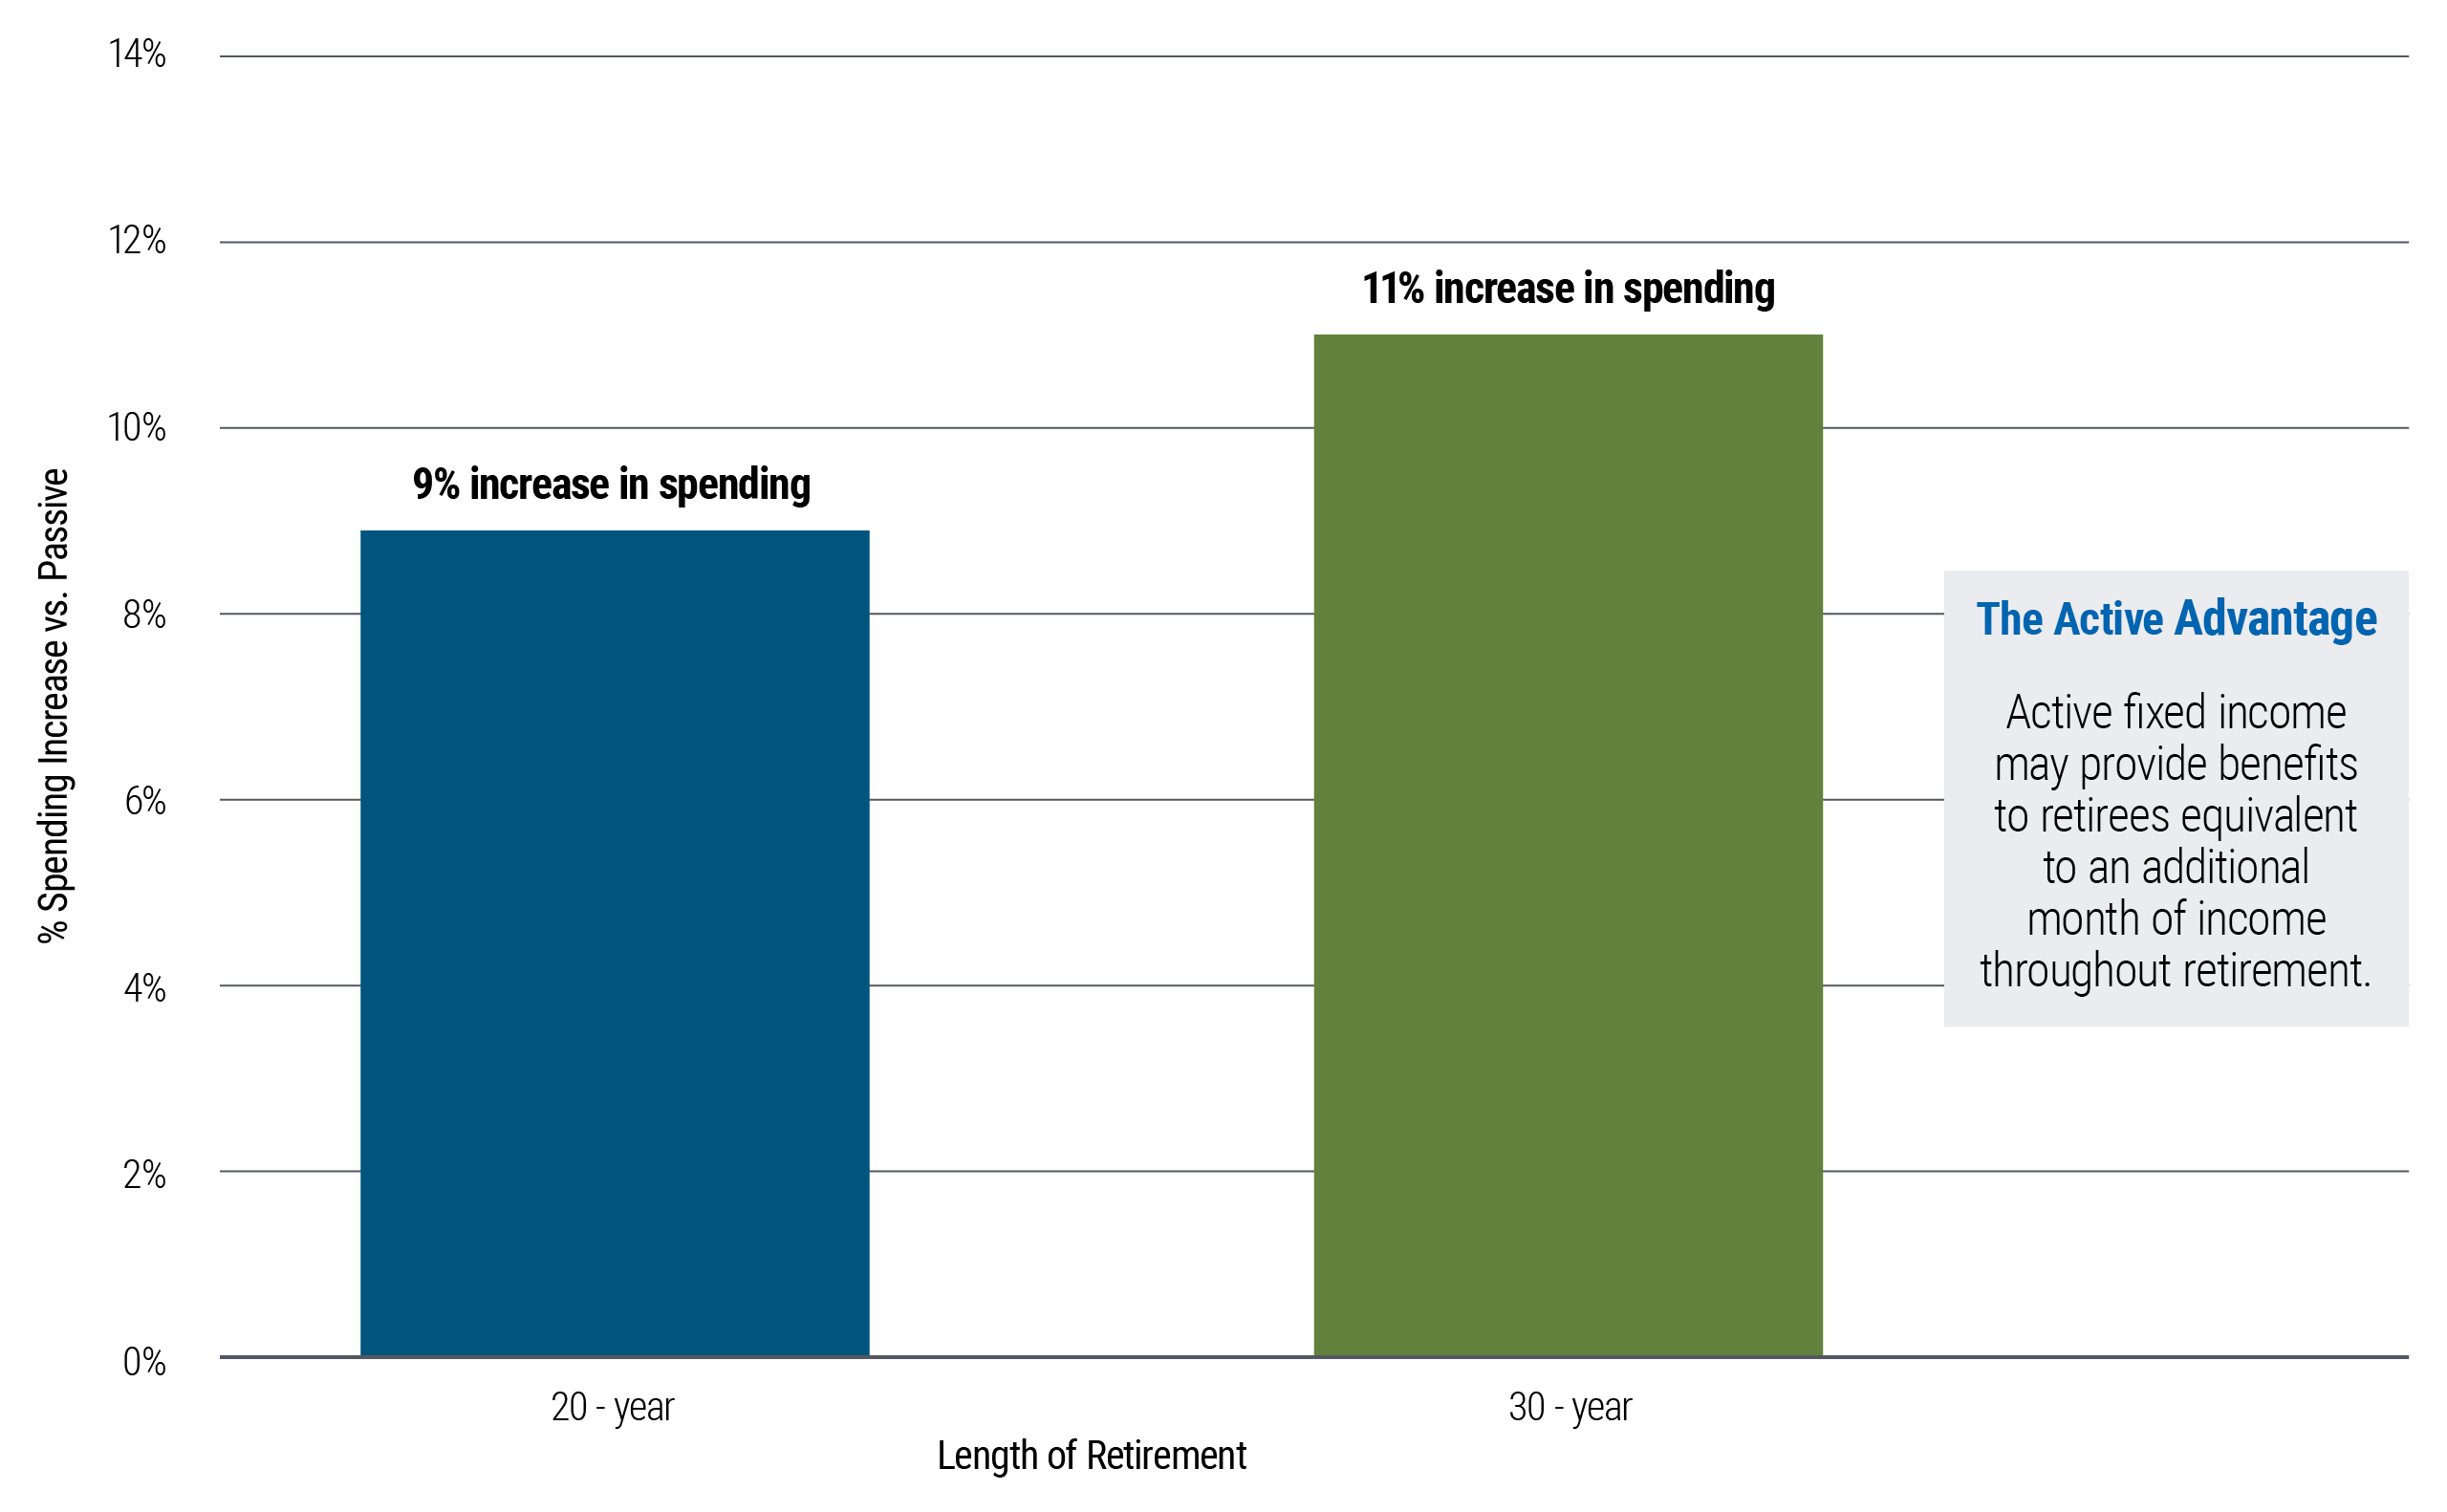
Finally, the estimated rewards of active management could be used in a straightforward way: to increase a participant’s standard of living in retirement. We find that retirees could enjoy a sustainable real spending rate that is 9% to 11% higher on average with an active investment strategy.
What does it really mean to be able to spend this much more in retirement? To make this metric intelligible, let’s translate it into something that feels familiar. Retirees are used to receiving monthly payments, be it from Social Security, pensions or other similar programs. The estimated improvement in sustainable spending from active fixed income is approximately equivalent to receiving one additional monthly pension payment (with one month corresponding to just over 8% of a year (1/12th) versus the up to 9% to 11% cited above). In other words, active management, if utilized over the full 40-year accumulation period, has the potential to provide our hypothetical participant with the equivalent of (slightly more than) a “13th monthly check” each year.
Figure 5: Potential increase in sustainable spending in retirement

Conclusion
With so much attention being devoted to the search for new asset classes — private markets, alternatives, and increasingly complex solutions — it’s easy to overlook a simple, immediately accessible source of value already available to many U.S. retirement plans.
Active management - specifically within fixed income – may offer a clear, practical way for plan participants to seek improvement of their retirement outcomes without requiring any behavioral changes, any additional complexity, or a reinvention of their investment lineup. The benefits are measurable, intuitive, and directly tied to the goals savers care about most:
- Making their savings last: participants can make their assets last 25-33% longer in retirement without reducing their standard of living.
- Retiring early: they can allow for participants to retire four to eight years earlier.
- Saving more while working: active fixed income provides benefits equivalent to an 8-10% increase in overall savings while working, or a 30-35% increase in employer matching contributions
- Increasing their standard of living in retirement: they can afford to increase their spending in retirement by up to 9-11%; roughly one additional month of income each year.
Improving retirement outcomes may not require something exotic or newly added, simply a smarter use of an existing tool – actively managed fixed income that millions of savers already rely on.
A message from Advisor Perspectives and VettaFi: Discover something new! Click here to register for our upcoming webcasts.
Footnotes:
I See https://www.pimco.com/us/en/investment-strategies/target-date-solutions for information on PIMCO’s target date offerings. ↩
II Baz, Jamil; Guo, Helen. “Bonds are Different: Active Versus Passive Management in 12 Points” (https://www.pimco.com/us/en/insights/bonds-are-different-activeversus-passive-management-in-12-points ↩
III Historical return data is sourced from the post- World War II experience in McQuarrie, Edward F., “Where Siegel Went Awry: Outdated Sources & Incomplete Data” (July 2021). Additional details on economic assumption, demographic profiles, robustness tests, as well as assumed asset allocation and contribution/employer match rates can be found in our long form white paper here (link to Sean’s longer piece) ↩
IV Percentage of active managers that generated excess returns versus the median passive manager, (classified as “Index Fund” by Morningstar), based on 5-year after fee returns for each Fund families’ lowest priced share class). Categories (Institutional shares only). Equity represented by Morningstar US Large Cap Blend category, Fixed Income represented by Morningstar Intermediate Core Bond and Intermediate Core-Plus Bond categories ↩
V We calculate sustainable constant real spending rates as a fraction of the initial at retirement balance purposefully comparable to the methodology found in Bengen, William “Determining Withdrawal Rates Using Historical Data” Journal of Financial Planning (1994) ↩
VI This corresponds to a 0.9-1 percentage point higher savings rate each year. ↩
Disclosures
Past performance is not a guarantee or reliable indicator of future results.
The analysis contained in this paper is based on hypothetical modeling. Hypothetical illustrations have many inherent limitations, some of which are described below. No representation is being made that any account will or is likely to achieve results similar to those shown. In fact there are frequently sharp differences between hypothetical results and actual results subsequently achieved by any particular trading program.
One of the limitations of hypothetical results is that they are generally prepared with the benefit of hindsight. In additional, hypothetical scenarios do not involve financial risk, and no hypothetical illustration can completely account for the impact of financial risk in actual trading. For example, the ability to withstand losses or to adhere to a particular trading program in spite of trading losses are material points which can also adversely affect actual trading results. There are numerous other factors related to the markets in general or to the implementation if any specific trading program which cannot be fully accounted for in the preparation of a hypothetical illustration and all of which can adversely affect actual results.
Because of limitations of these modeling techniques, we make no representation that use of these models will actually reflect future results, or that any investment actually will achieve results similar to those shown. Hypothetical or simulated performance modeling techniques have inherent limitations. These techniques do not predict future actual performance and are limited by assumptions that future market events will behave similarly to historical time periods or theoretical models. Future events very often occur to causal relationships not anticipated by such models, and it should be expected that sharp differences will often occur between the results of these models and actual investment results.
Return assumptions are for illustrative purposes only and are not a prediction or a projection of return. Return assumption is an estimate of what investments may earn on average over the long term. Actual returns may be higher or lower than those shown and may vary substantially over shorter time periods. Return assumptions are subject to change without notice.
The 75 bps per annum fixed income alpha assumption is an estimate based on the 77 bps of average active fixed income alpha in Choi, Cremers, and Riley (2023).
This presentation reflects ongoing PIMCO research where historical data on stocks, bonds, inflation, participant wages, and savings were analyzed to see how a typical DC participant saves and spends over their lifetime. Research compares two potential scenarios of portfolios with and without 75 bps of active fixed income alpha and highlights implications on asset longevity, early retirement, increases in savings, and real spending rates.
We combine the historical annual asset returns, participant demographics, and asset allocation data discussed in the methodology section to estimate the potential impact of active fixed income on four different hypothetical outcomes: the potential for extension of asset longevity, the potential for an earlier retirement, hypothetical equivalent additional annual savings or employer contributions, and the potential increases in sustainable retirement income. Our calculations consider a hypothetical plan participant or retiree beginning either their forty-year working life or a 20-year retirement in each year of the historical sample. Accumulation is driven by the participant’s annual savings along with the annual realized historical asset returns in a given year over the historical time period with their decumulation experience utilizing a constant real spending rate expressed as a percentage of their at-retirement balance as in Bengen (1994) and Klein, Popov, and Taylor (2023). McQuarrie passive returns data is from “Where Siegel Went Awry: Outdated Sources & Incomplete Data” (2021) research paper which highlights a 227-period of stock and bond returns and inflation data.
Forecasts, estimates and certain information contained herein are based upon proprietary research and should not be considered as investment advice or a recommendation of any particular security, strategy or investment product. There is no guarantee that results will be achieved.
Figures are provided for illustrative purposes and are not indicative of the past or future performance of any PIMCO product. It is not possible to invest directly into an unmanaged index.
Asset allocation is the process of distributing investments among various classes of investments (e.g., stocks and bonds). It does not guarantee future results, ensure a profit or protect against loss.
Performance results for certain charts and graphs may be limited by date ranges specified on those charts and graphs; different time periods may produce different results.
The correlation of various indexes or securities against one another or against inflation is based upon data over a certain time period. These correlations may vary substantially in the future or over different time periods that can result in greater volatility.
Glide path is the asset allocation within a Target Date Strategy that adjusts over time as the participant’s age increases and their time horizon to retirement shortens. The basis of the glide path is to reduce the portfolio risk as the participant’s time horizon decreases. Typically, younger participants with a longer time horizon to retirement have sufficient time to recover from market losses, their investment risk level is higher, and they are able to make larger contributions (depending on various factors such as salary, savings, account balance, etc.) Generally, older participants and eligible retirees have a shorter time horizon to retirement and their investment risk level declines as preserving income wealth becomes more important.
Models are utilized as a proxy for asset classes where a market index is not available and are not intended or generally made available for investment purposes. Private Corporate Credit Model: Model risk factor exposures are estimated based on a public equivalent benchmark and alpha estimates derived from historical data on private funds in the Preqin Private Credit Universe. The public market equivalent is duration hedged high yield. We then add adjustments for illiquidity premia and idiosyncratic risk based on the historical distribution of alpha (relative to the PME benchmark) in the Preqin category. Median and 25th percentile models reflect alpha estimates from the median and 25th percentile of the historical alpha distribution, respectively. Private Equity Model: Model risk factor exposures are estimated based on a public equivalent benchmark and alpha estimates are derived from historical data on private funds in the Preqin Private Equity Universe (ex-VC). The public market equivalent is a custom index of publicly traded US firms matched to the size, EBITDA multiple, and revenue multiple observed from PE deals in the Preqin database. We also add additional filters for value (top half of Book-to-Market, top half of Earnings Yield), leverage and equity return volatility (filtered to approximately match HY CDX issuers), and eliminate outliers. We then add adjustments for illiquidity premia and idiosyncratic risk based on the historical distribution of alpha (relative to the PME benchmark) in the Preqin category. Median and top quartile models reflect alpha estimates from the median and 75th percentile of the historical alpha distribution, respectively. Unless otherwise specified, models reflect the median of the historical alpha distribution.
Statements concerning financial market trends are based on current market conditions, which will fluctuate. There is no guarantee that these investment strategies will work under all market conditions or are appropriate for all investors and each investor should evaluate their ability to invest for the long term, especially during periods of downturn in the market. Outlook and strategies are subject to change without notice.
The portfolio structures are a representation of a sample portfolios and no guarantee is being made that the structure of any portfolio will remain the same or that similar returns will be achieved.
Investing in the bond market is subject to risks, including market, interest rate, issuer, credit, inflation risk, and liquidity risk. The value of most bonds and bond strategies are impacted by changes in interest rates. Bonds and bond strategies with longer durations tend to be more sensitive and volatile than those with shorter durations; bond prices generally fall as interest rates rise, and low interest rate environments increase this risk. Reductions in bond counterparty capacity may contribute to decreased market liquidity and increased price volatility. Bond investments may be worth more or less than the original cost when redeemed. Mortgage and asset-backed securities may be sensitive to changes in interest rates, subject to early repayment risk, and their value may fluctuate in response to the market’s perception of issuer creditworthiness; while generally supported by some form of government or private guarantee there is no assurance that private guarantors will meet their obligations. Investing in foreign denominated and/or domiciled securities may involve heightened risk due to currency fluctuations, and economic and political risks, which may be enhanced in emerging markets. Sovereign securities are generally backed by the issuing government, obligations of U.S. Government agencies and authorities are supported by varying degrees but are generally not backed by the full faith of the U.S. Government; portfolios that invest in such securities are not guaranteed and will fluctuate in value. Inflation-linked bonds (ILBs) issued by a government are fixed-income securities whose principal value is periodically adjusted according to the rate of inflation; ILBs decline in value when real interest rates rise. Commodities contain heightened risk including market, political, regulatory, and natural conditions, and may not be suitable for all investors. Income from municipal bonds may be subject to state and local taxes and at times the alternative minimum tax: a strategy concentrating in a single or limited number of states is subject to greater risk of adverse economic conditions and regulatory changes. High-yield, lower-rated, securities involve greater risk than higher-rated securities; portfolios that invest in them may be subject to greater levels of credit and liquidity risk than portfolios that do not. Investing in securities of smaller companies tends to be more volatile and less liquid than securities of larger companies. Equities may decline in value due to both real and perceived general market, economic, and industry conditions. Derivatives and commodity-linked derivatives may involve certain costs and risks such as liquidity, interest rate, market, credit, management and the risk that a position could not be closed when most advantageous. Commodity-linked derivative instruments may involve additional costs and risks such as changes in commodity index volatility or factors affecting a particular industry or commodity, such as drought, floods, weather, livestock disease, embargoes, tariffs and international economic, political and regulatory developments. Investing in derivatives could lose more than the amount invested. Diversification does not ensure against loss.
Target Date Funds are designed to provide investors with a retirement solution tailored to the time when they expect to retire or plan to start withdrawing money (the “target date”). Target Date Funds will gradually shift their emphasis from more aggressive investments to more conservative ones based on their target dates. Target Date Funds invest in other funds and instruments based on a long-term asset allocation glide path developed by PIMCO, and performance is subject to underlying investment weightings, which will change over time. An investment in a Target Date Fund does not eliminate the need for an investor to determine whether a Fund is appropriate for his or her financial situation. An investment in a Fund is not guaranteed. Investors may experience losses, including losses near, at, or after the target date, and there is no guarantee that a Fund will provide adequate income at and through retirement.
The terms “cheap” and “rich” as used herein generally refer to a security or asset class that is deemed to be substantially under- or overpriced compared to both its historical average as well as to the investment manager’s future expectations. There is no guarantee of future results or that a security’s valuation will ensure a profit or protect against a loss.
PIMCO as a general matter provides services to qualified institutions, financial intermediaries and institutional investors. Individual investors should contact their own financial professional to determine the most appropriate investment options for their financial situation. This material contains the current opinions of the manager and such opinions are subject to change without notice. This material has been distributed for informational purposes only. Information contained herein has been obtained from sources believed to be reliable, but not guaranteed. No part of this material may be reproduced in any form, or referred to in any other publication, without express written permission. PIMCO is a trademark of Allianz Asset Management of America LLC in the United States and throughout the world. ©2026, PIMCO
Pacific Investment Management Company LLC, 650 Newport Center Drive, Newport Beach, CA 92660, 800-387-4626
For institutional investor use only – not to be shown or distributed to the public
© PIMCO
Membership required
Membership is now required to use this feature. To learn more:
View Membership BenefitsSponsored Content
Upcoming Virtual Events View All


