Consumer and corporate resilience in the face of higher energy costs have supported equity markets, with the S&P 500’s April and May returns ranking among the top 10 strongest two-month stretches since 1950.
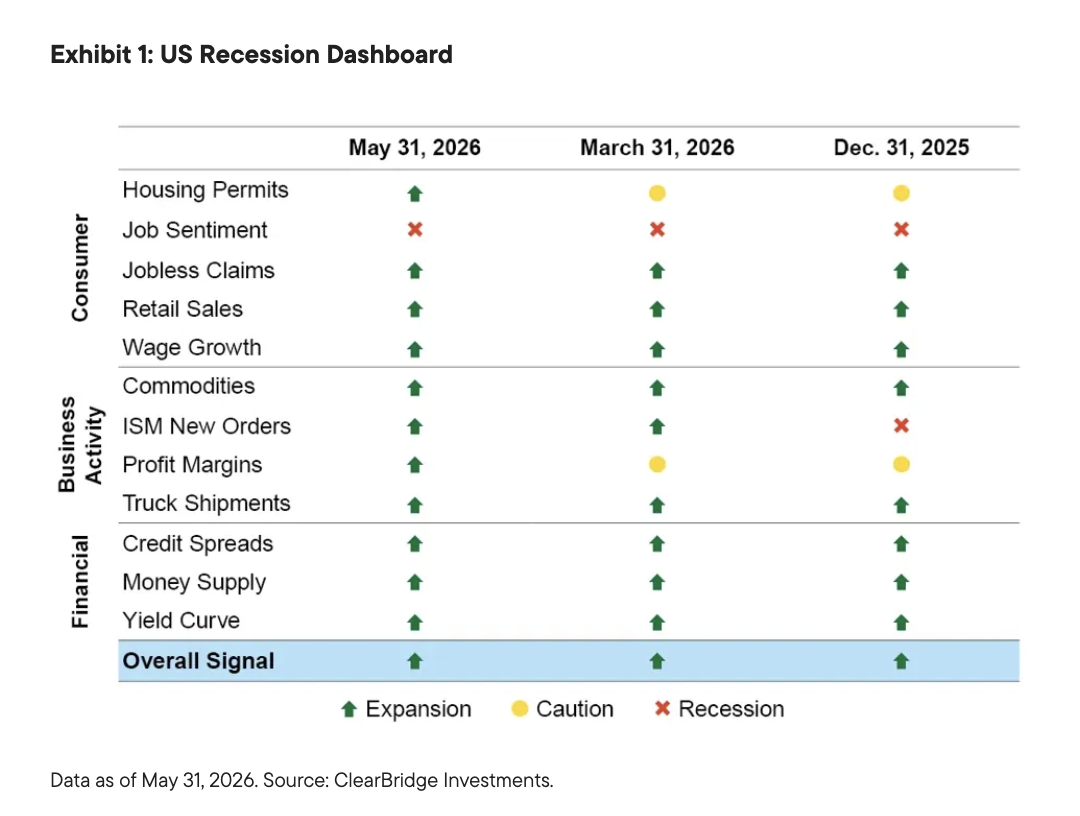
The Profit Margin indicator on the ClearBridge US Recession Dashboard improved last month from yellow to green, and the overall signal remains in green territory.
Robust corporate earnings should continue to provide a solid market foundation, making us inclined to continue to “buy the dips” should pullbacks emerge.
Consumer spending, corporate capex provide solid footing for equities
US equities continued to climb higher in May, with the S&P 500 Index rising 5.1%. Further de-escalation of geopolitical tension in the Middle East has paved the way for the market’s 19.5% advance from the late-March lows. Equally important in our view has been the resilience shown by consumers, corporations and the broader economy through the energy price shock.
Prices at the pump have been less forgiving, with the national average gasoline price spending much of May above $4.50/gallon after being below $3.00/gallon before the war. Pain at the pump has weighed on consumer sentiment, with the University of Michigan’s Consumer Sentiment survey reaching a new all-time low in May.
However, we continue to believe that investors are best served by focusing on consumers’ actions rather than their words. To that end, consumer spending has continued to hold up, with Retail Sales remaining green and posting solid gains in both March and April even after excluding gas station purchases. The Profit Margin indicator on the ClearBridge US Recession Dashboard improved last month from yellow to green. Job Sentiment is the only indicator not currently in green territory, and the dashboard’s broad strength remains encouraging (Exhibit 1).
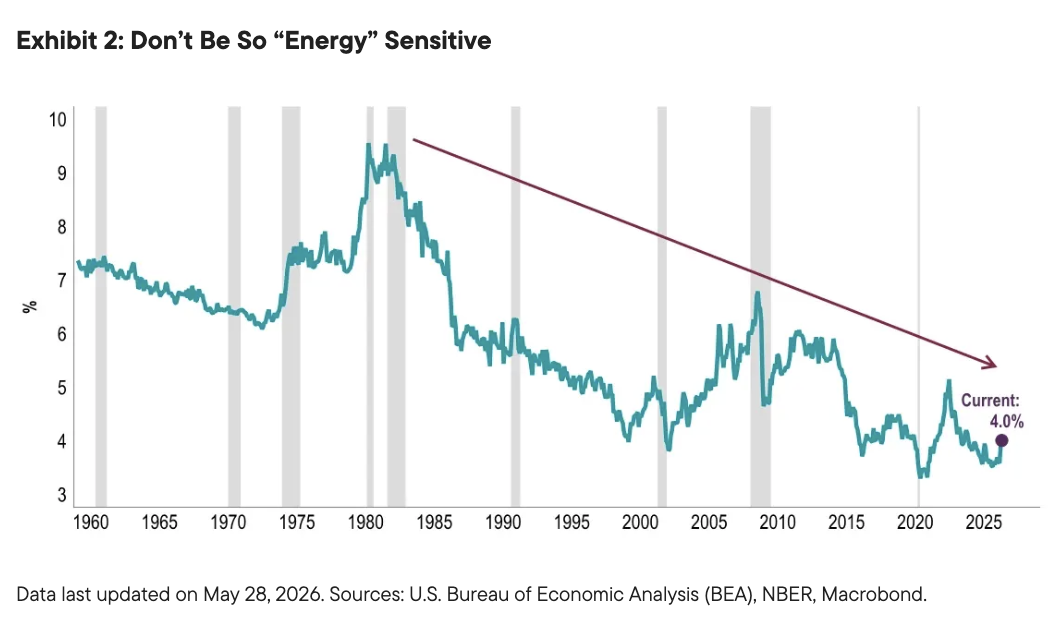
In our view, consumer resilience in the face of higher energy costs has come largely as a function of three well-known but underappreciated effects. First, consumption has been driven by the higher-income consumer over the past few years due to the K-shaped economy dynamic. This means wealth effects are helping support consumption on the back of the aforementioned market rally, to say nothing of the broader advance over the past few years. Second, individual tax cuts from the One Big Beautiful Bill (OBBB) should total well over $100 billion this year between the reduction in taxes paid and refunds issued. Although this dynamic was well understood coming into the year, it appears to have been underappreciated by markets. Third, we believe that many investors do not fully grasp the benefits from declining energy intensity, with energy goods and services spending accounting for just 4% of consumer wallets today.
It is not just the strength of the consumer that has powered America’s economic resilience of late: corporate capital expenditure (capex) is also supporting economic growth. Artificial intelligence (AI) investment—data centers require related power, cooling, networking, semiconductor and software infrastructure—now accounts for ~1% of gross domestic product (GDP).
Capex is not just limited to AI, however, with several other metrics showing green shoots. These include the ISM Manufacturing PMI survey, which has held above 50 in each of the past five months (and a green dashboard signal for the even stronger ISM New Orders Index), along with inflections in industrial production and core capital goods (non-defense, ex-aircraft) orders and shipments. This pickup in capex is a positive sign and is likely being helped at the margin by the corporate tax incentives from the OBBB.
With consumers and companies continuing to forge ahead, we remain optimistic that markets can continue to rally over the medium term. Endemic to that view is the fact that the market’s upside over the past year has come on the back of improving fundamentals with multiples de-rating modestly. Put differently, equities have climbed higher on the back of stronger earnings, an encouraging foundation for a continuation of the bull market.
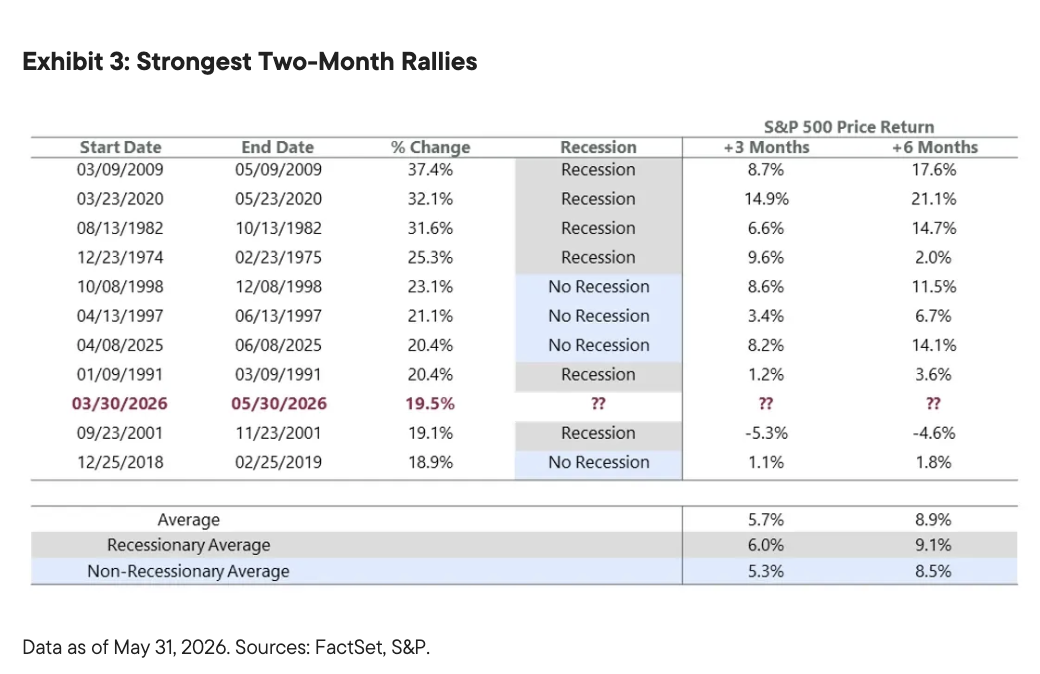
History shows that investors should not be scared off by the market’s recent strength, even though the S&P 500’s surge in April and May ranks among the top 10 strongest two-month stretches since 1950. While several similarly sharp rallies have occurred around recessions, many others were rooted firmly within economic expansions, including 1997, 1998, 2019 and 2025. When focusing on non-recessionary periods specifically, history shows that stocks have continued to advance following similar surges, with average returns of 5.3% and 8.5% over the subsequent three and six months, respectively.
Looking ahead, we believe relative containment of the US–Iran conflict and indications that a more lasting peace deal may be nearing could be catalysts for additional market strength. Although bouts of volatility are likely, robust corporate earnings should continue to provide a solid market foundation, making us inclined to continue to “buy the dips” should pullbacks emerge.
A message from Advisor Perspectives and VettaFi: Discover something new! Click here to register for our upcoming webcasts.
The ClearBridge Recession Risk Dashboard is a group of 12 indicators that examine the health of the US economy and the likelihood of a downturn.
The S&P 500 Index is an unmanaged index of 500 stocks that is generally representative of the performance of larger companies in the United States.
The ISM New Orders Index is a major component of the Institute for Supply Management (ISM) PMI reports, acting as a leading indicator for the broader US economy.
The One Big Beautiful Bill Act of 2025 is a US federal statute passed by the 119th United States Congress containing tax and spending policies that form the core of President Donald Trump's second-term agenda. The bill was signed into law by President Trump on July 4, 2025.
Capital expenditure (capex) refers to investment spending in long-term assets (fixed assets). These expenditures include new buildings, machinery, and other equipment needed for an organization's day-to-day operations. Most companies use capex financing to fund their long-term investments.
WHAT ARE THE RISKS?
All investments involve risks, including possible loss of principal. Past performance is no guarantee of future results. Please note that an investor cannot invest directly in an index. Unmanaged index returns do not reflect any fees, expenses or sales charges.
Equity securities are subject to price fluctuation and possible loss of principal. Large-capitalization companies may fall out of favor with investors based on market and economic conditions. Small- and mid-cap stocks involve greater risks and volatility than large-cap stocks.
Commodities and currencies contain heightened risk that include market, political, regulatory, and natural conditions and may not be suitable for all investors.
US Treasuries are direct debt obligations issued and backed by the “full faith and credit” of the US government. The US government guarantees the principal and interest payments on US Treasuries when the securities are held to maturity. Unlike US Treasuries, debt securities issued by the federal agencies and instrumentalities and related investments may or may not be backed by the full faith and credit of the US government. Even when the US government guarantees principal and interest payments on securities, this guarantee does not apply to losses resulting from declines in the market value of these securities.
IMPORTANT LEGAL INFORMATION
This material is intended to be of general interest only and should not be construed as individual investment advice or a recommendation or solicitation to buy, sell or hold any security or to adopt any investment strategy. It does not constitute legal or tax advice. This material may not be reproduced, distributed or published without prior written permission from Franklin Templeton.
The views expressed are those of the investment manager and the comments, opinions and analyses are rendered as at publication date and may change without notice. The underlying assumptions and these views are subject to change based on market and other conditions and may differ from other portfolio managers or of the firm as a whole. The information provided in this material is not intended as a complete analysis of every material fact regarding any country, region or market. There is no assurance that any prediction, projection or forecast on the economy, stock market, bond market or the economic trends of the markets will be realized. The value of investments and the income from them can go down as well as up and you may not get back the full amount that you invested. Past performance is not necessarily indicative nor a guarantee of future performance. All investments involve risks, including possible loss of principal.
Any research and analysis contained in this material has been procured by Franklin Templeton for its own purposes and may be acted upon in that connection and, as such, is provided to you incidentally. Data from third party sources may have been used in the preparation of this material and Franklin Templeton ("FT") has not independently verified, validated or audited such data. Although information has been obtained from sources that Franklin Templeton believes to be reliable, no guarantee can be given as to its accuracy and such information may be incomplete or condensed and may be subject to change at any time without notice. The mention of any individual securities should neither constitute nor be construed as a recommendation to purchase, hold or sell any securities, and the information provided regarding such individual securities (if any) is not a sufficient basis upon which to make an investment decision. FT accepts no liability whatsoever for any loss arising from use of this information and reliance upon the comments, opinions and analyses in the material is at the sole discretion of the user.
Franklin Templeton has environmental, social and governance (ESG) capabilities; however, not all strategies or products for a strategy consider “ESG” as part of their investment process.
Products, services and information may not be available in all jurisdictions and are offered outside the U.S. by other FT affiliates and/or their distributors as local laws and regulation permits. Please consult your own financial professional or Franklin Templeton institutional contact for further information on availability of products and services in your jurisdiction.
Issued in the U.S. by Franklin Templeton, One Franklin Parkway, San Mateo, California 94403-1906, (800) DIAL BEN/342-5236, franklintempleton.com. Investments are not FDIC insured; may lose value; and are not bank guaranteed.