CMBS: A Tale of Two (office) Markets?
Membership required
Membership is now required to use this feature. To learn more:
View Membership BenefitsRising office delinquencies within commercial mortgage-backed securities (CMBS) reflect genuine pressures from shifting work patterns, higher interest rates, and greater refinancing risk.
Since 2022, office delinquency rates have risen from 1.6% to over 12% in 20261 under the strain of increased financing costs and changes in structural demand brought on by the lasting impact of remote and hybrid work models.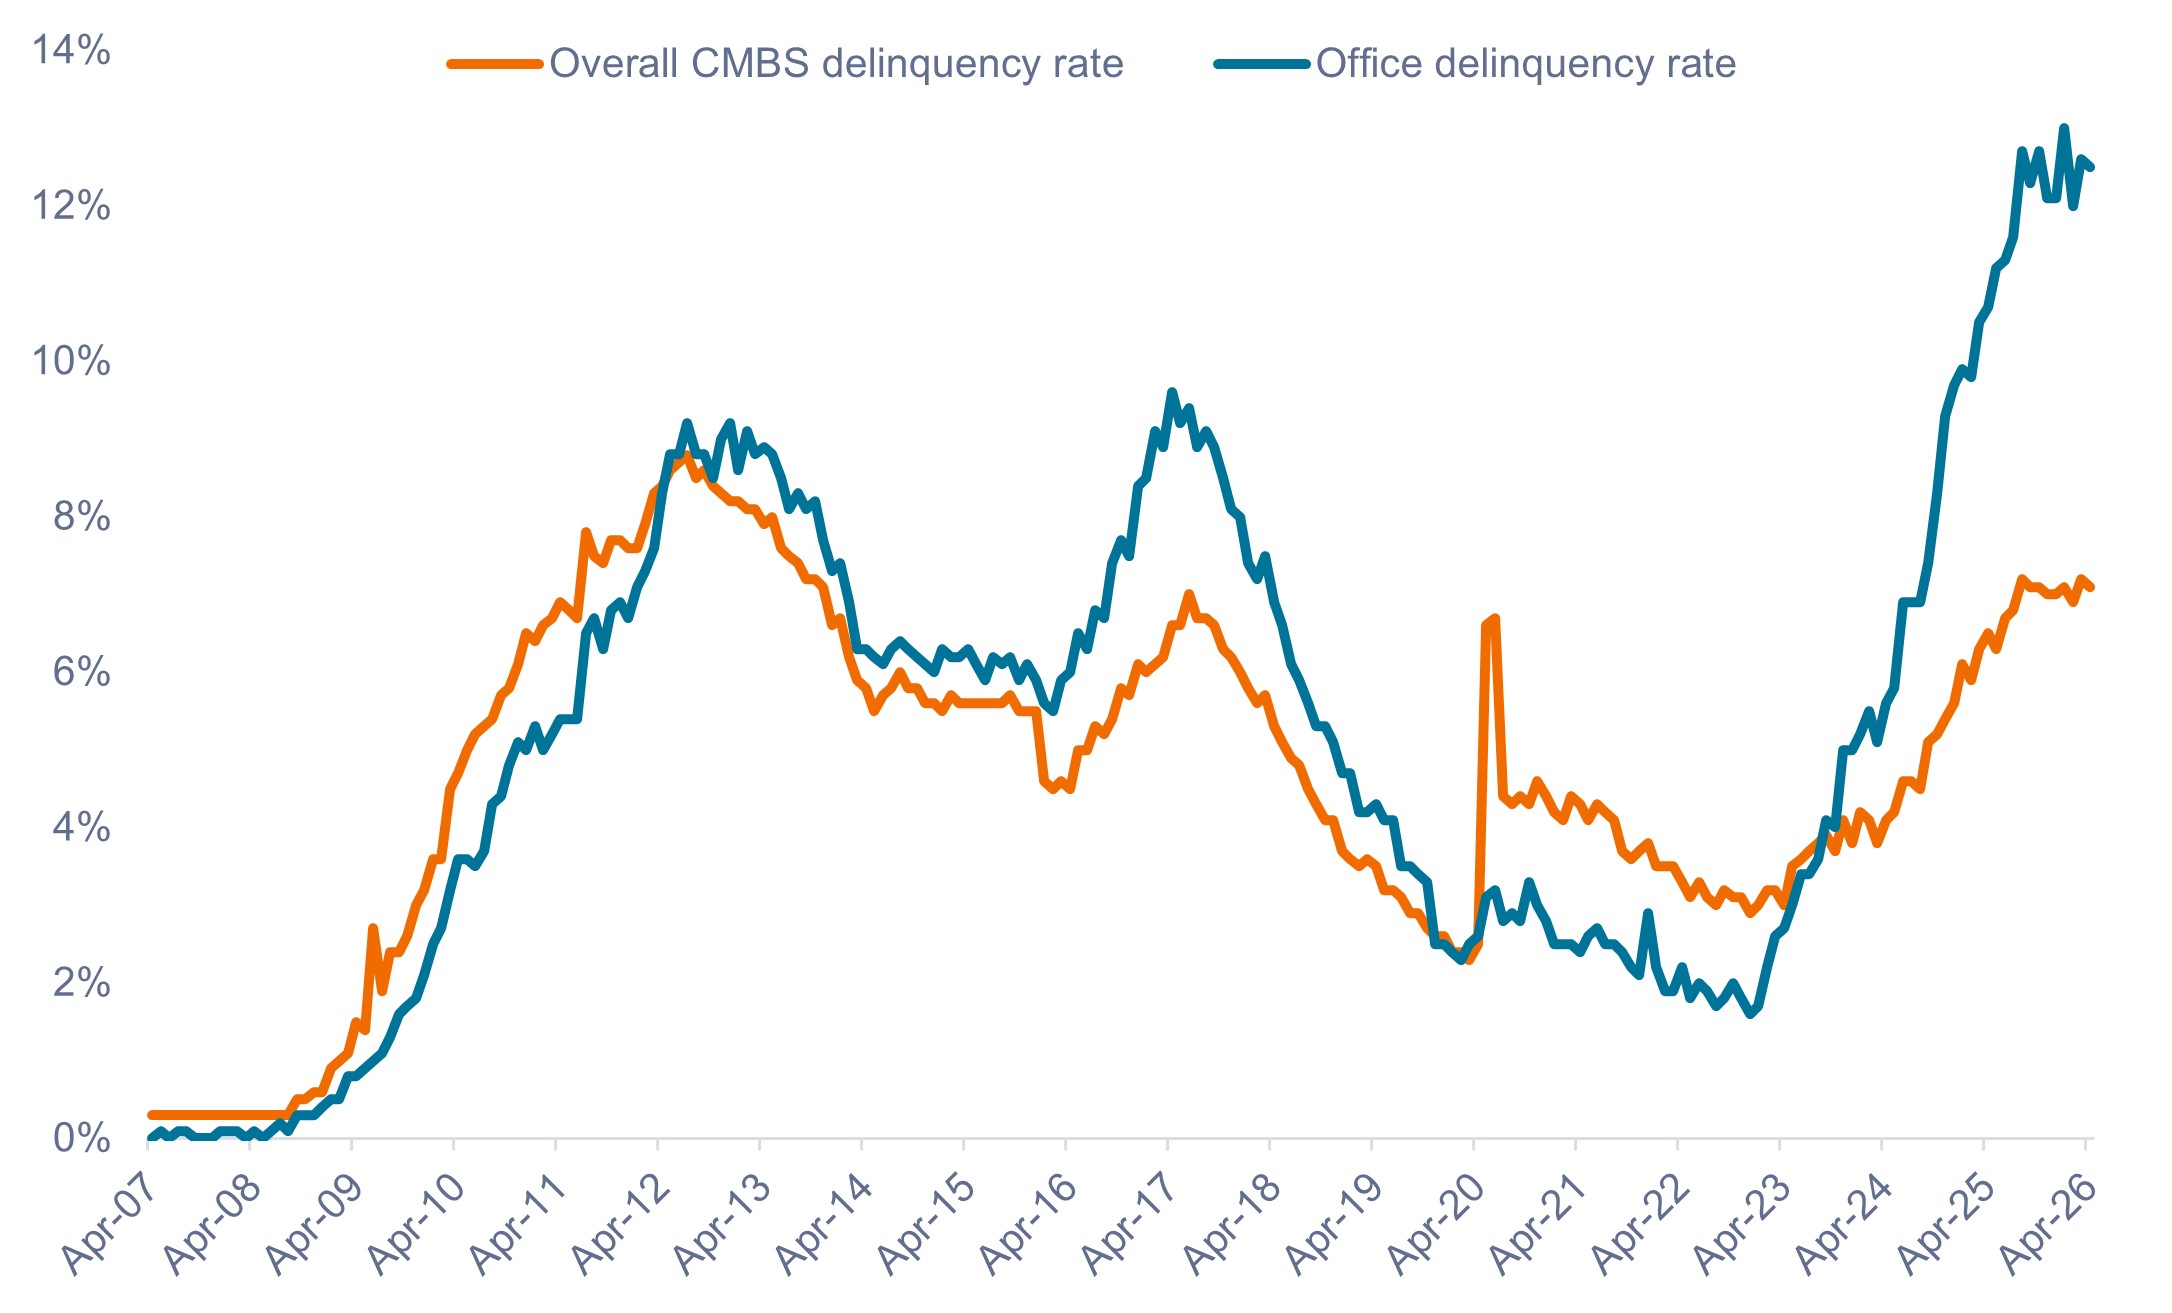
![]()
While delinquencies are likely to remain elevated in 2026, performance varies from one building to another. “Trophy2-quality” assets in major markets have been reporting stronger occupancy levels, particularly in cities benefiting from artificial intelligence-related hiring. Additionally, office-to-residential conversion activity is helping reduce obsolete supply while historically low levels of office space under construction is gradually improving fundamentals, particularly for prime assets.
Read more: Market Focus Shifts From Earnings to Macro Catalysts
New York City: Back in business
In one of the clearest real-world examples of how return-to-office trends are translating into occupancy gains and stronger asset-level performance for premier properties, the New York City (NYC) office sector continues to outperform the national average and ranks second among major U.S. markets for top-tier office attendance, behind only Miami.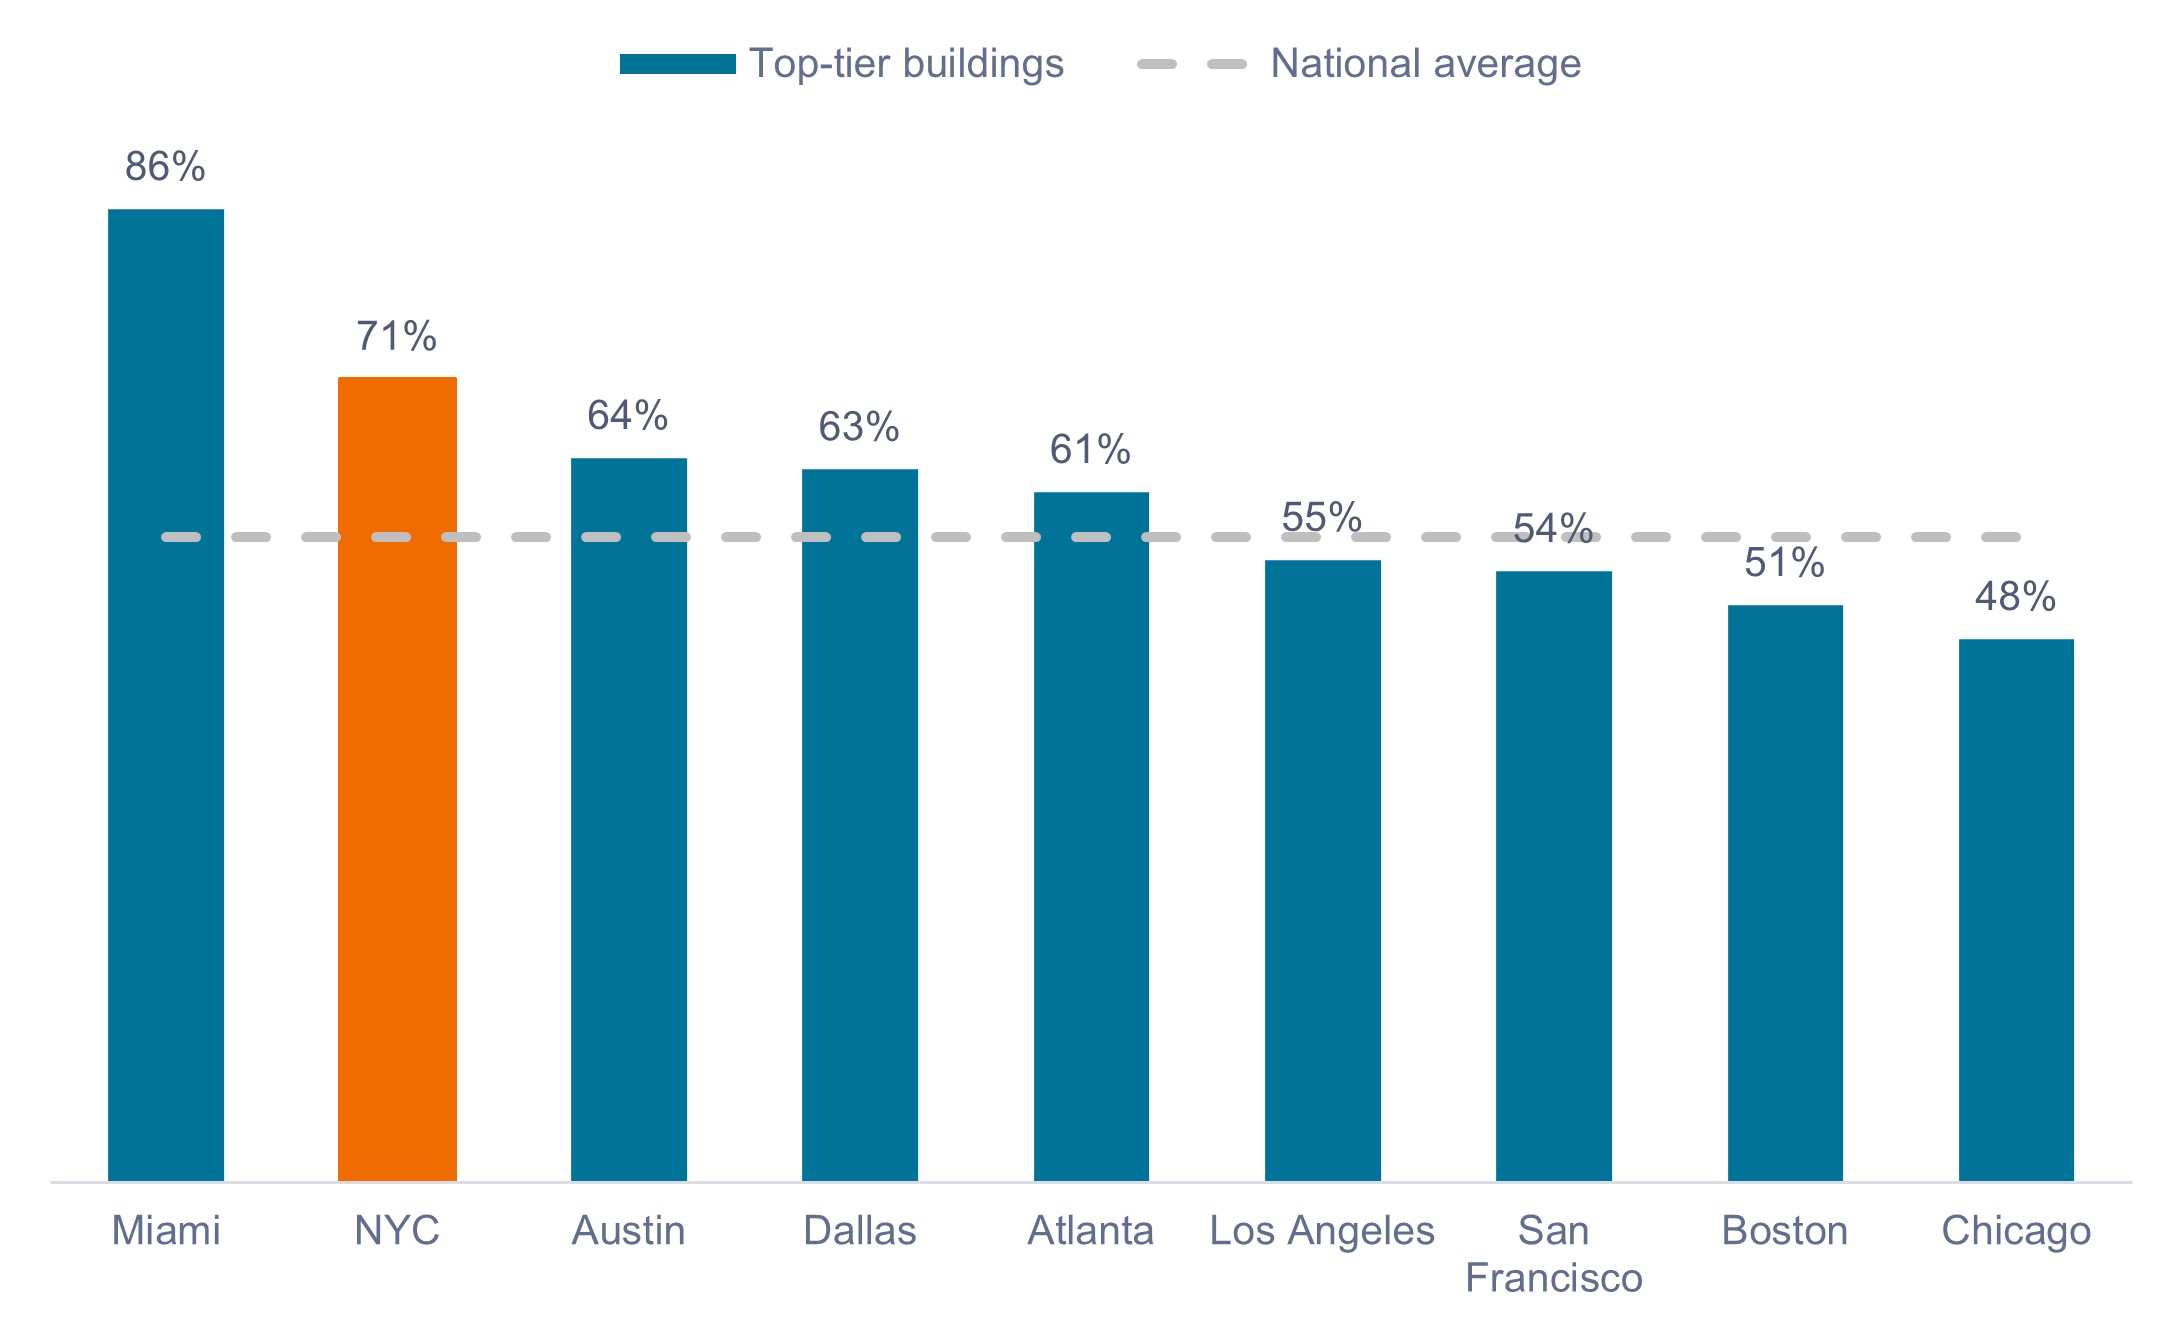
![]()
Top-tier buildings in NYC are now approaching their pre-COVID attendance norms at around 70%+ attendance. As a result, performance has diverged sharply between well-located trophy assets with strong tenants and older, less-competitive buildings. Best-in-class offices in top markets like Manhattan are leasing and attracting capital, while lower-quality assets in weaker markets face accelerating valuation pressure.
This dynamic flows directly into CMBS outcomes, making asset-level underwriting far more important than broad sector labels and illustrating how local strength can exist alongside national weakness.
In an environment where dispersion continues to widen, active CMBS management is less about avoiding office altogether and more about owning the right office exposure.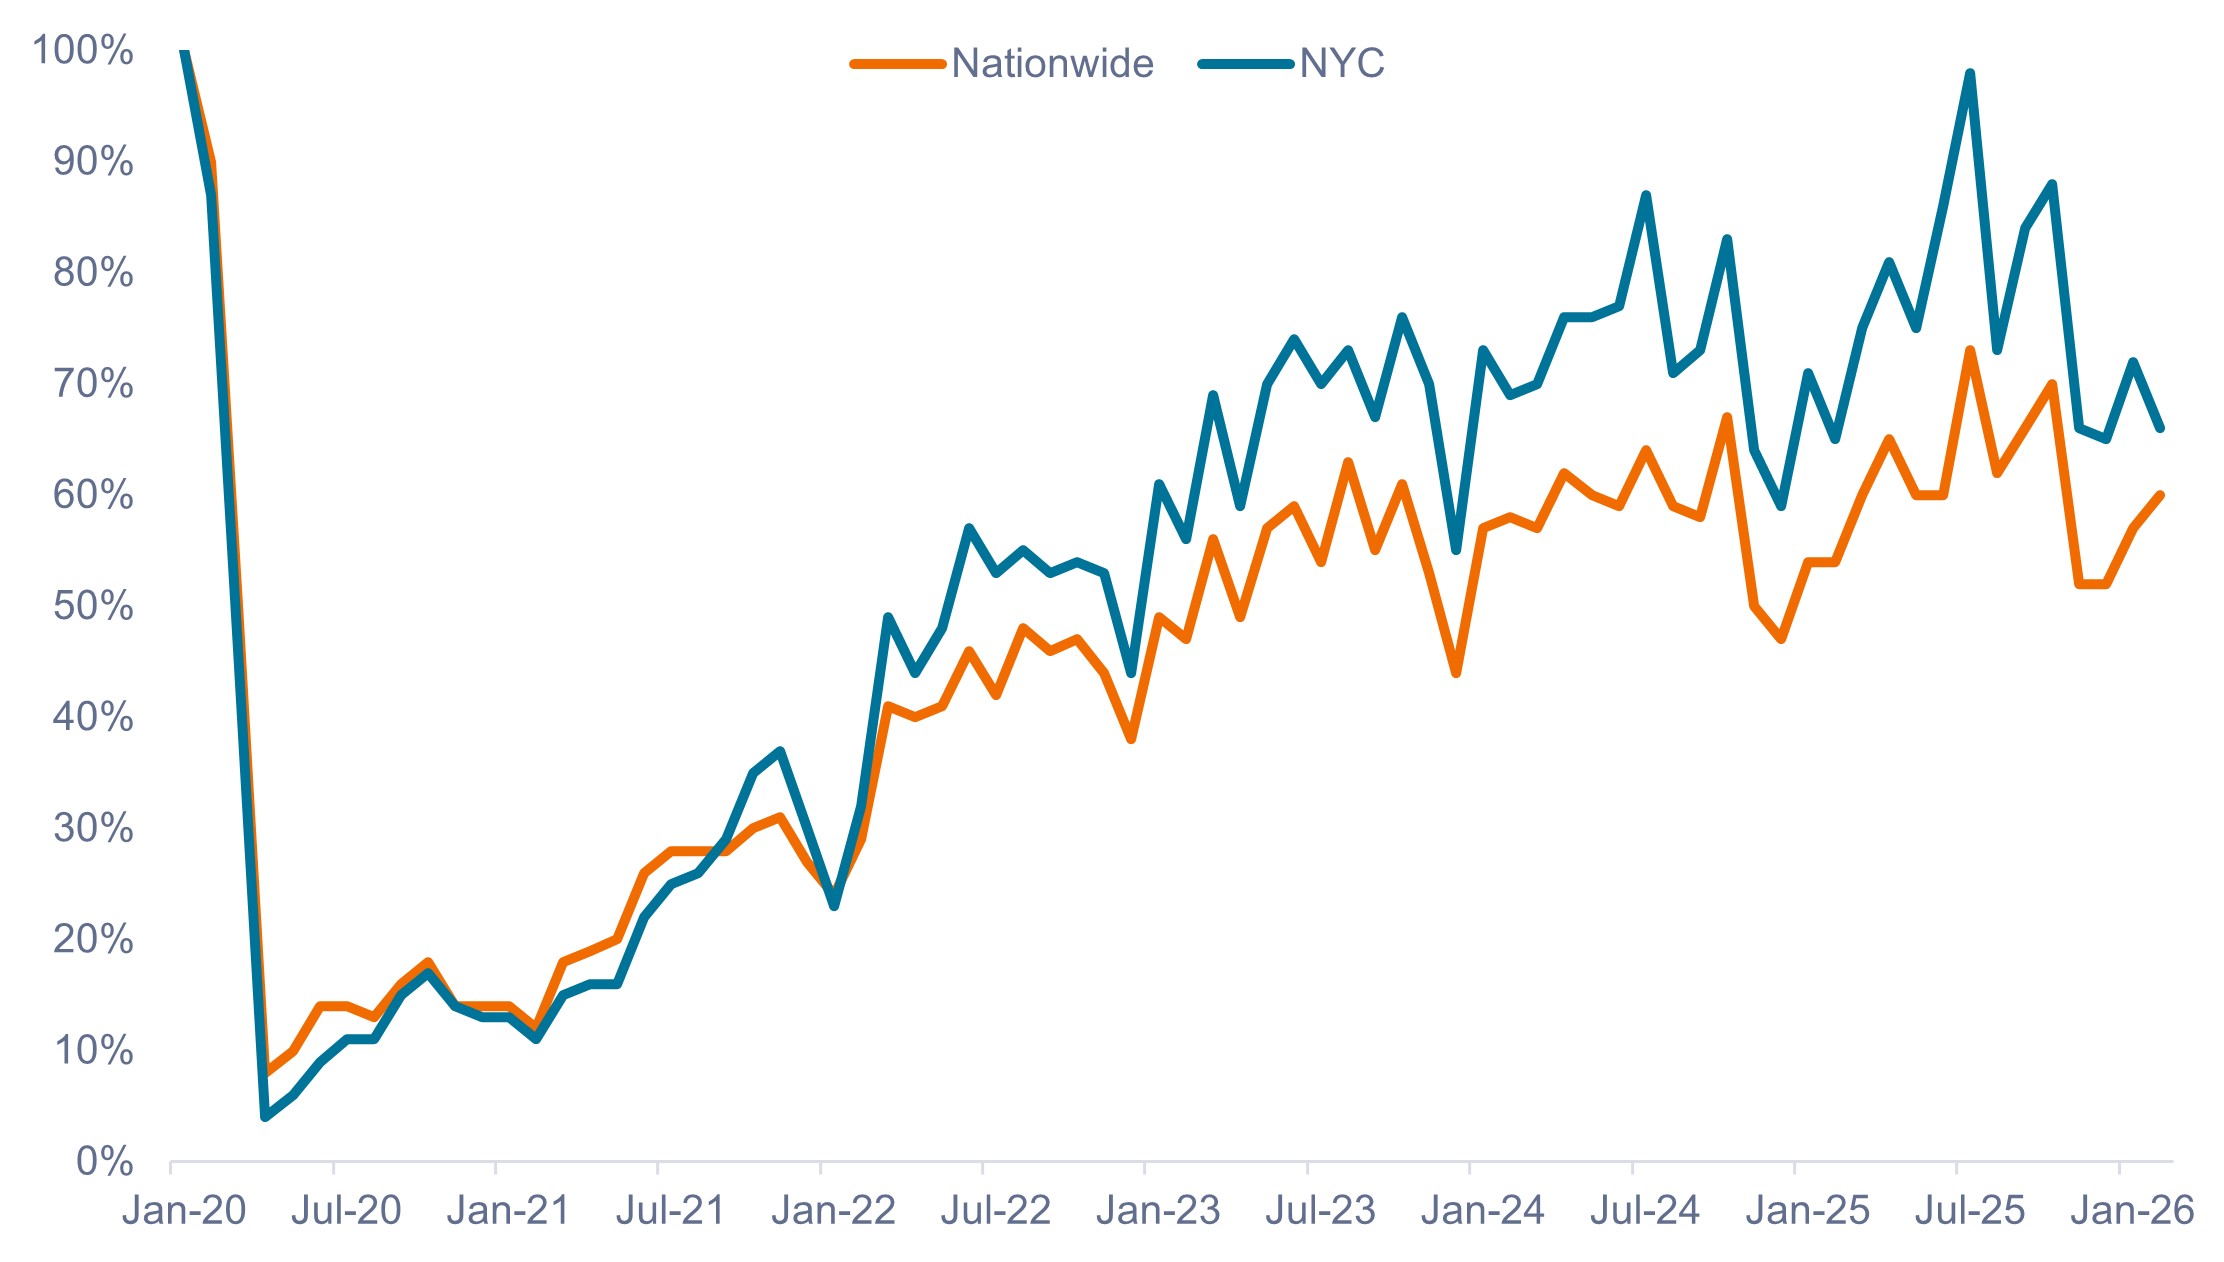
![]()
At the top end of the market, NYC leasing activity totaled 8.9 million square feet in Q1 2026, in line with last year’s record pace and well above long-term averages. In our view, several trends stand out as a result:
- Minimal large-scale office delivery is expected before the end of the decade, reinforcing pricing power for well-located assets.
- Rents are rising where quality is scarce. Average Manhattan asking rents moved higher over the past two years and are now 10% above their pre-pandemic rates, with Q1 2026 average rents reaching approximately $166 per square foot, including record-setting leases.
- Flight to quality remains dominant. While overall vacancies continue to decline, trophy assets now exhibit ~6.3% vacancy (vs. 15.7% for Class B locations), which is near pre-pandemic levels as tenant demand increasingly concentrates in modern, amenitized buildings. In some neighborhoods, such as Midtown Manhattan, prime vacancy rates fell to just 2.9% in Q1 2026, according to CBRE Research.
- Large occupiers are driving absorption. Financial services and technology firms are leasing space at an accelerating pace and favoring newer developments in Midtown, Midtown South, and select Downtown NYC locations.
“Diworsification” does not equal diversification
Conduit CMBS transactions, which contain heterogeneous collateral with multiple borrowers, are often perceived as less risky because investor exposure is statistically diversified. But, in our view, this can make it difficult to carve out less desirable office exposure in a divided market. In our view, the more bifurcated the office sector becomes, the less useful pooled exposure is to investors.
In contrast, single-asset single-borrower (SASB) transactions may provide more bespoke exposure with wider credit spreads as compensation for concentration risk. For example, recent AAA SASB office transactions have been issued with spreads ~20 to 25bps wider than conduit office transactions. This divergence underscores why active management is essential and how negative sentiment toward “office” in general has created attractive entry points for securities backed by high-quality properties.
Office is only one component of the CMBS universe, which is diversified across multiple property types, including multifamily, industrial, lodging, retail, self-storage, data centers, life sciences, and other specialty assets. Many subsectors are supported by secular demand tailwinds. Importantly, these sectors respond to different economic cycles (housing supply, trade flows, travel, consumption etc.), which can help reduce risk at the portfolio level.
While corporate spreads tend to widen rather quickly with macro-related stress, CMBS senior bonds often experience lagged or muted price responses, lowering correlation during risk-off periods. As a result, the Bloomberg Investment Grade CMBS index has exhibited negative correlation to the S&P 500® Index over the past 10 years, making its inclusion an excellent diversifier in multi-asset portfolios.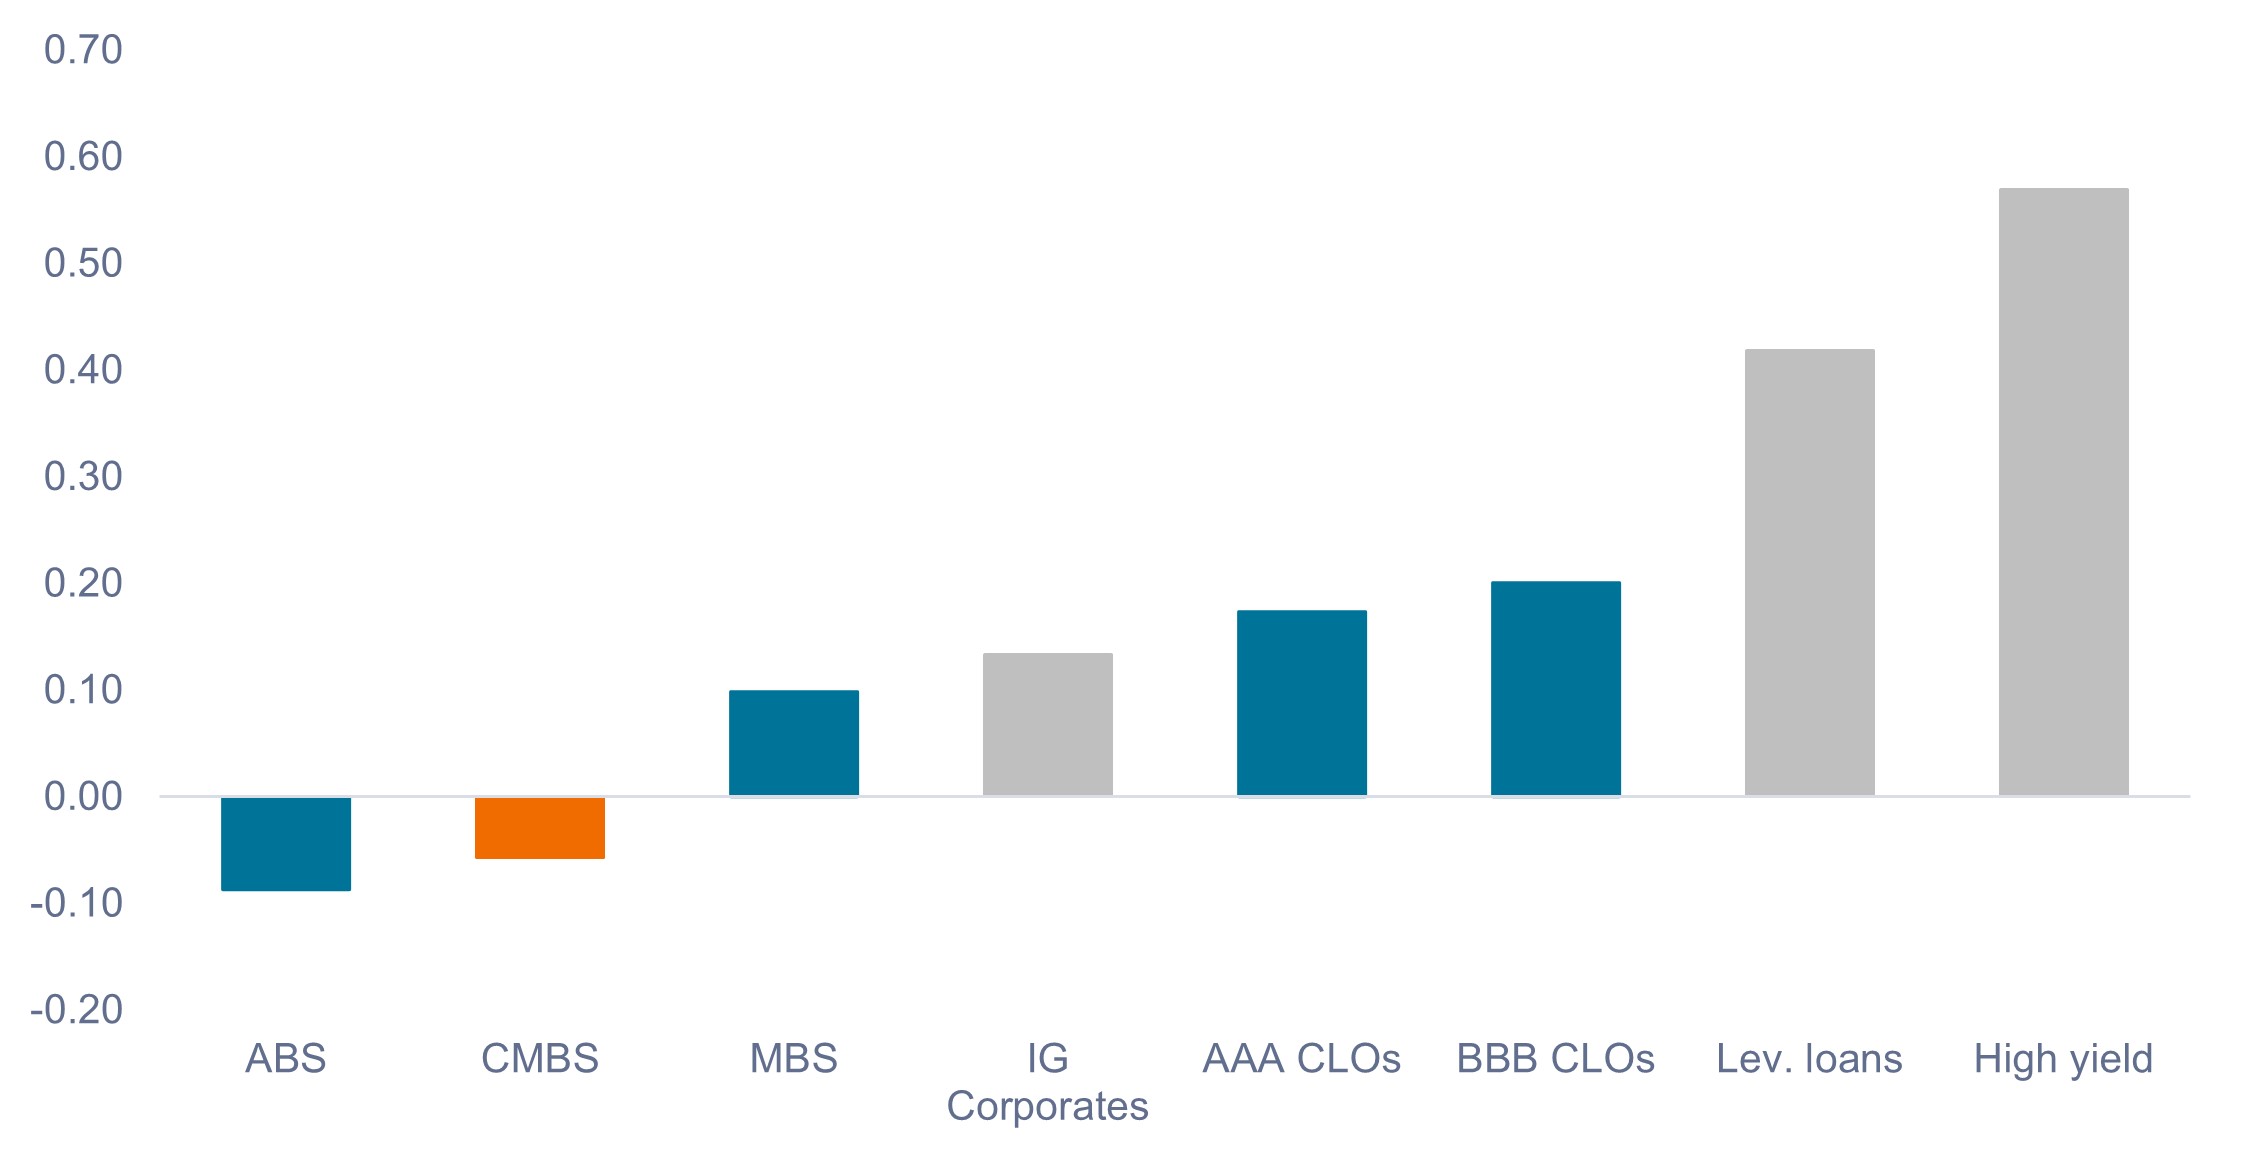
While the correlation benefits of adding CMBS to portfolios is compelling, the sector represents around 1% of the U.S. and Global Aggregate Bond Indices, making an active allocation through a dedicated securitized manager essential for investors seeking to add the asset class to a core fixed income allocation.
Investor implementation
Stresses within the CMBS market are most acute for older, commodity-like buildings with weaker tenant demand and near-term maturities. For investors, it is important to understand that performance within CMBS is driven by loan-level collateral, not sector averages. That distinction is important as headline office delinquency data masks widening dispersion at the property level.
Operating fundamentals, asset quality, and location drive collateral performance and illustrate why outcomes can differ meaningfully for conduit transactions versus the higher-quality collateral within SASB assets.
As NYC’s experience illustrates, CMBS fundamentals are not standing still. In select markets and property types, they are improving, and the recovery is increasingly showing up in returns. Despite negative office headlines, CMBS more broadly has returned 5.66% annualized over the last three years (as of 8 May 2026) versus 5.06% for investment-grade credit, with lower volatility, lower duration (3.46 years vs. 6.69 years), and materially higher average credit quality (Aa1 vs. Baa1).
CMBS remains a valuable portfolio allocation that can enhance diversification, support income generation, and help manage risk within core fixed income portfolios. However, the current environment creates both risk and opportunity for investors and emphasizes why we believe active management is critical when investing in CMBS.
IMPORTANT INFORMATION
Actively managed portfolios may fail to produce the intended results. No investment strategy can ensure a profit or eliminate the risk of loss.
Diversification neither assures a profit nor eliminates the risk of experiencing investment losses.
Fixed income securities are subject to interest rate, inflation, credit and default risk. The bond market is volatile. As interest rates rise, bond prices usually fall, and vice versa. The return of principal is not guaranteed, and prices may decline if an issuer fails to make timely payments or its credit strength weakens.
Real estate securities are sensitive to changes in real estate values and rental income, property taxes, interest rates, tax and regulatory requirements, supply and demand, and the management skill and creditworthiness of the company.
Securitized products, such as mortgage-backed securities and asset-backed securities, are more sensitive to interest rate changes, have extension and prepayment risk, and are subject to more credit, valuation and liquidity risk than other fixed-income securities.
The opinions and views expressed are as of the date published and are subject to change. They are for information purposes only and should not be used or construed as an offer to sell, a solicitation of an offer to buy, or a recommendation to buy, sell or hold any security, investment strategy or market sector. No forecasts can be guaranteed. Opinions and examples are meant as an illustration of broader themes, are not an indication of trading intent and may not reflect the views of others in the organization. It is not intended to indicate or imply that any illustration/example mentioned is now or was ever held in any portfolio. Janus Henderson Group plc through its subsidiaries may manage investment products with a financial interest in securities mentioned herein and any comments should not be construed as a reflection on the past or future profitability. There is no guarantee that the information supplied is accurate, complete, or timely, nor are there any warranties with regards to the results obtained from its use. Past performance is no guarantee of future results. Investing involves risk, including the possible loss of principal and fluctuation of value.
Index performance does not reflect the expenses of managing a portfolio as an index is unmanaged and not available for direct investment.
Janus Henderson® and any other trademarks used herein are trademarks of Janus Henderson Group plc or one of its subsidiaries. © Janus Henderson Group plc.
A message from Advisor Perspectives and VettaFi: Discover something new! Click here to register for our upcoming webcasts.
Membership required
Membership is now required to use this feature. To learn more:
View Membership BenefitsSponsored Content
Upcoming Virtual Events View All


