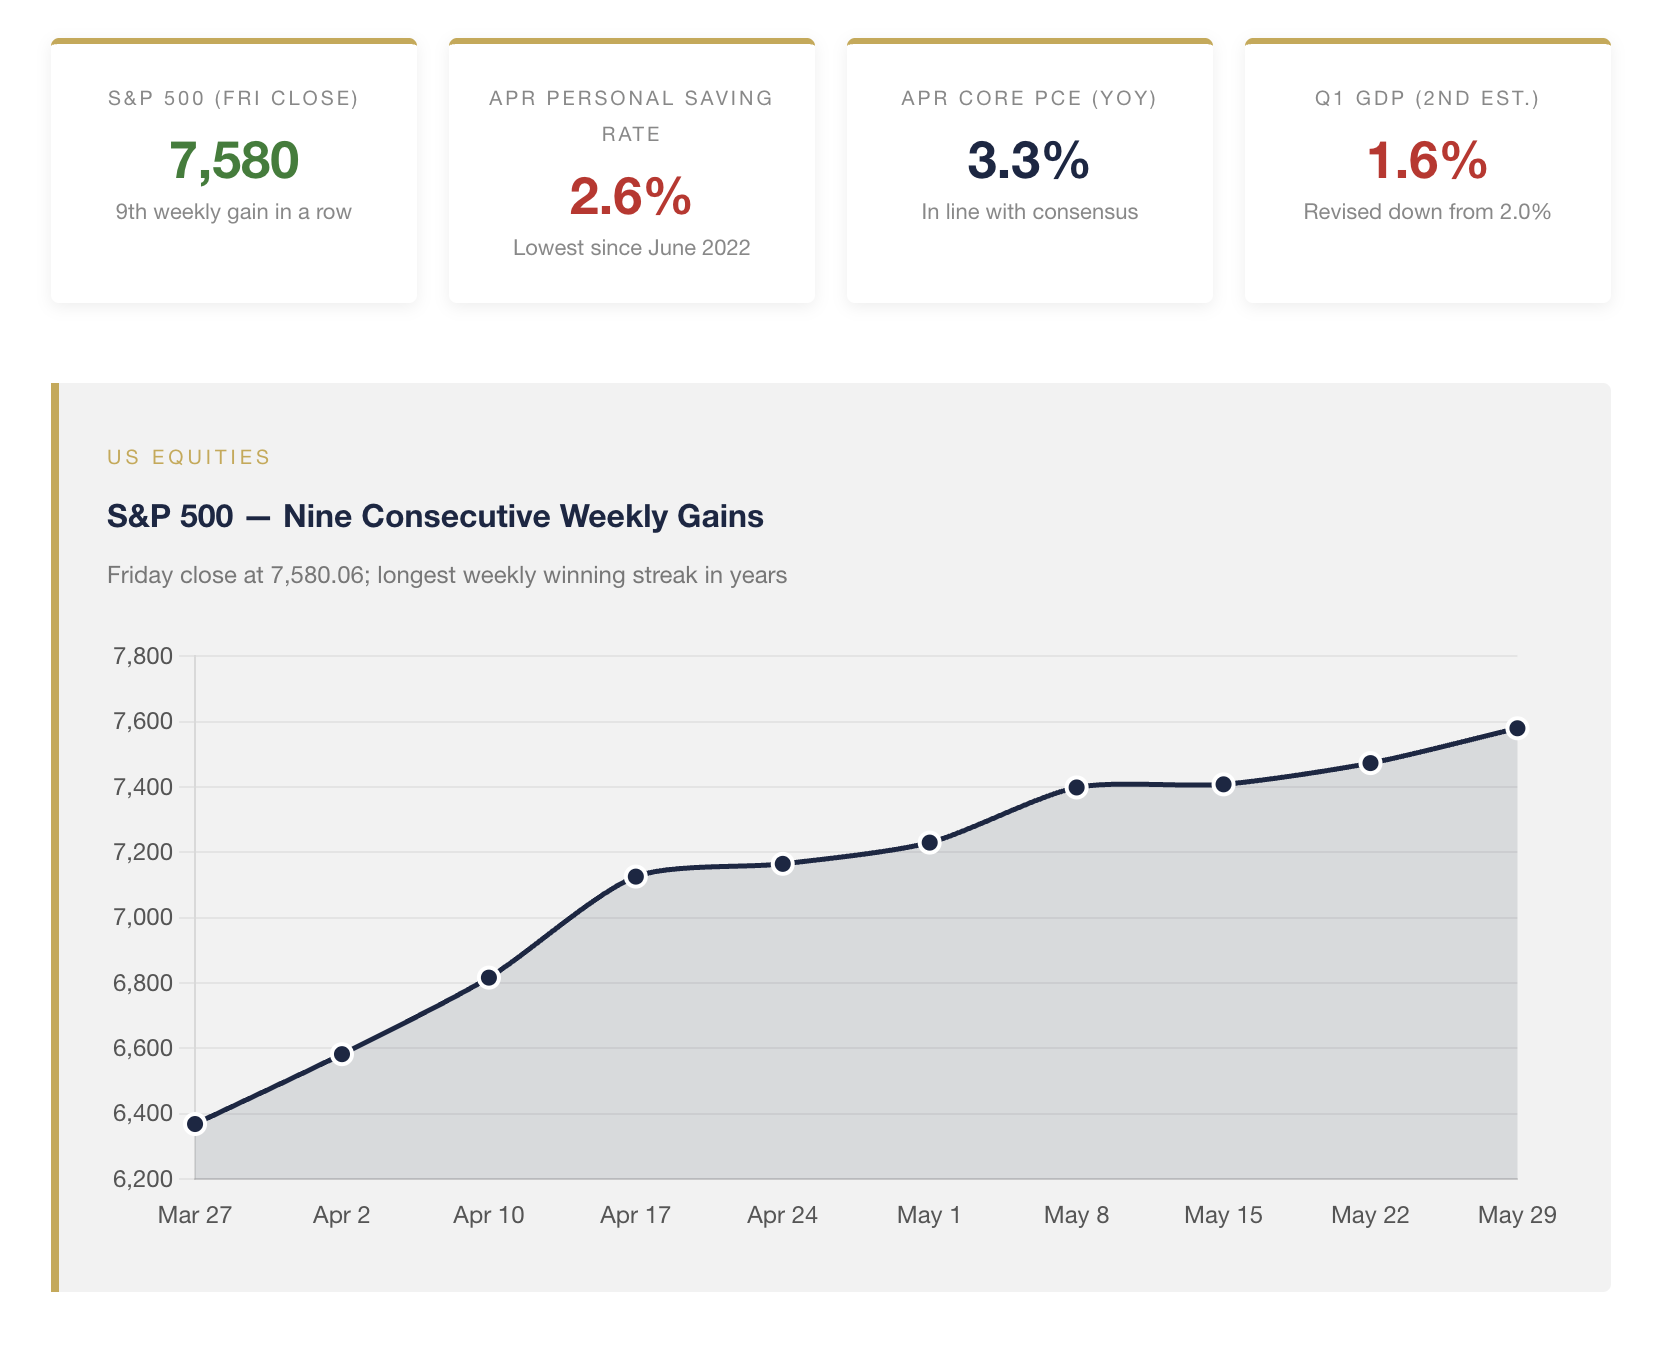
Last week presented two narratives running in opposite directions, and which one allocators choose to weight will shape their positioning for the back half of 2026 more than any single data print since April. The narrative on the tape was a procession of records. The S&P 500 finished Friday at 7,580.06, its ninth consecutive weekly gain, capping the strongest May for US equities in years — up roughly 5% on the month. The Nasdaq Composite closed at 26,972.62, having added more than 8% in May on the strength of generative-AI capital spending and a Dell-led AI-infrastructure rally that pulled the broader semiconductor and cloud cohort with it. The Dow Jones Industrial Average closed above 51,000 for the first time. Beneath that tape, however, the data released Wednesday through Friday told a different story: nominal growth being revised lower, real disposable income going negative, and the personal saving rate falling to 2.6% — the lowest reading since June 2022. The records came at a cost, and the cost showed up in the data.

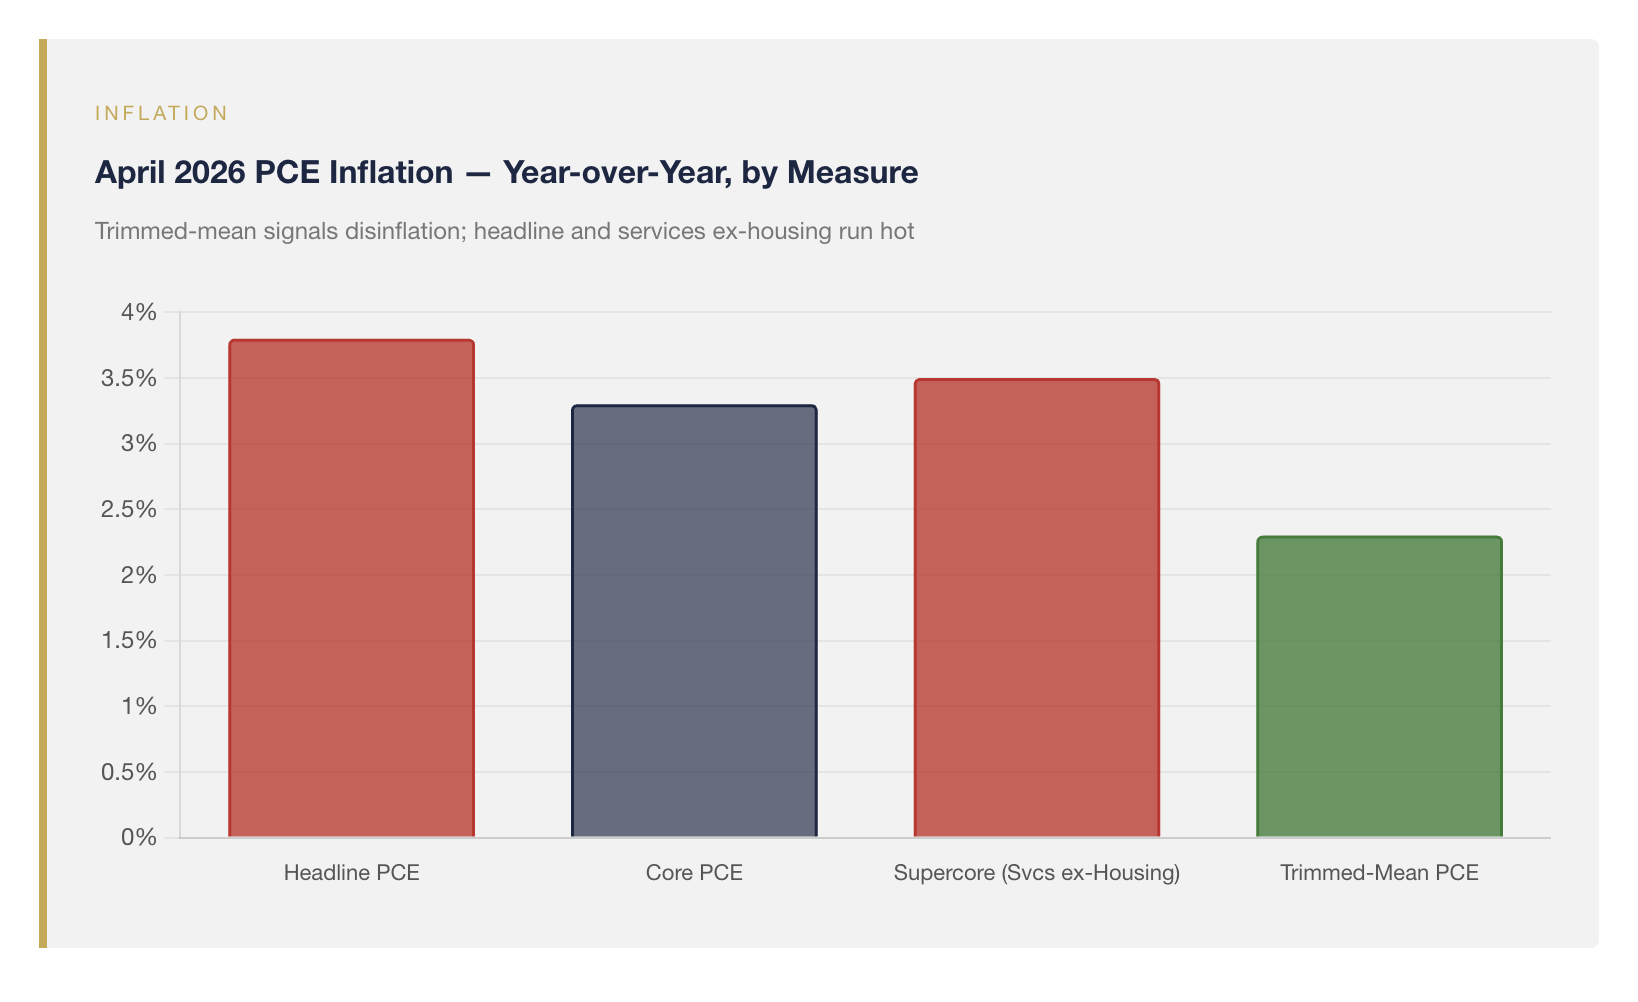
The April Personal Income and Outlays report, released Thursday by the Bureau of Economic Analysis, is the file we believe deserves the closest read. Headline PCE rose 0.4% on the month and 3.8% over twelve months. Core PCE rose 0.2% on the month and 3.3% year-over-year, matching consensus. Those are the numbers the wires quoted. What we believe matters more is the texture beneath them. The Dallas Fed's trimmed-mean PCE rate did soften further to 2.3% year-over-year and the Cleveland Fed's median PCE ticked down — both genuine disinflationary signals that the chair of the Federal Reserve, who has publicly favored those very measures, will not ignore. Yet within the same release, housing services within core PCE printed firm, and the median trajectory of services excluding shelter remained well above target. The underlying pulse, in our view, is mixed rather than cleanly cooling. That mix is precisely the configuration in which a central bank can defensibly do nothing for several more meetings — and last week's tape suggests that is exactly what markets now expect.
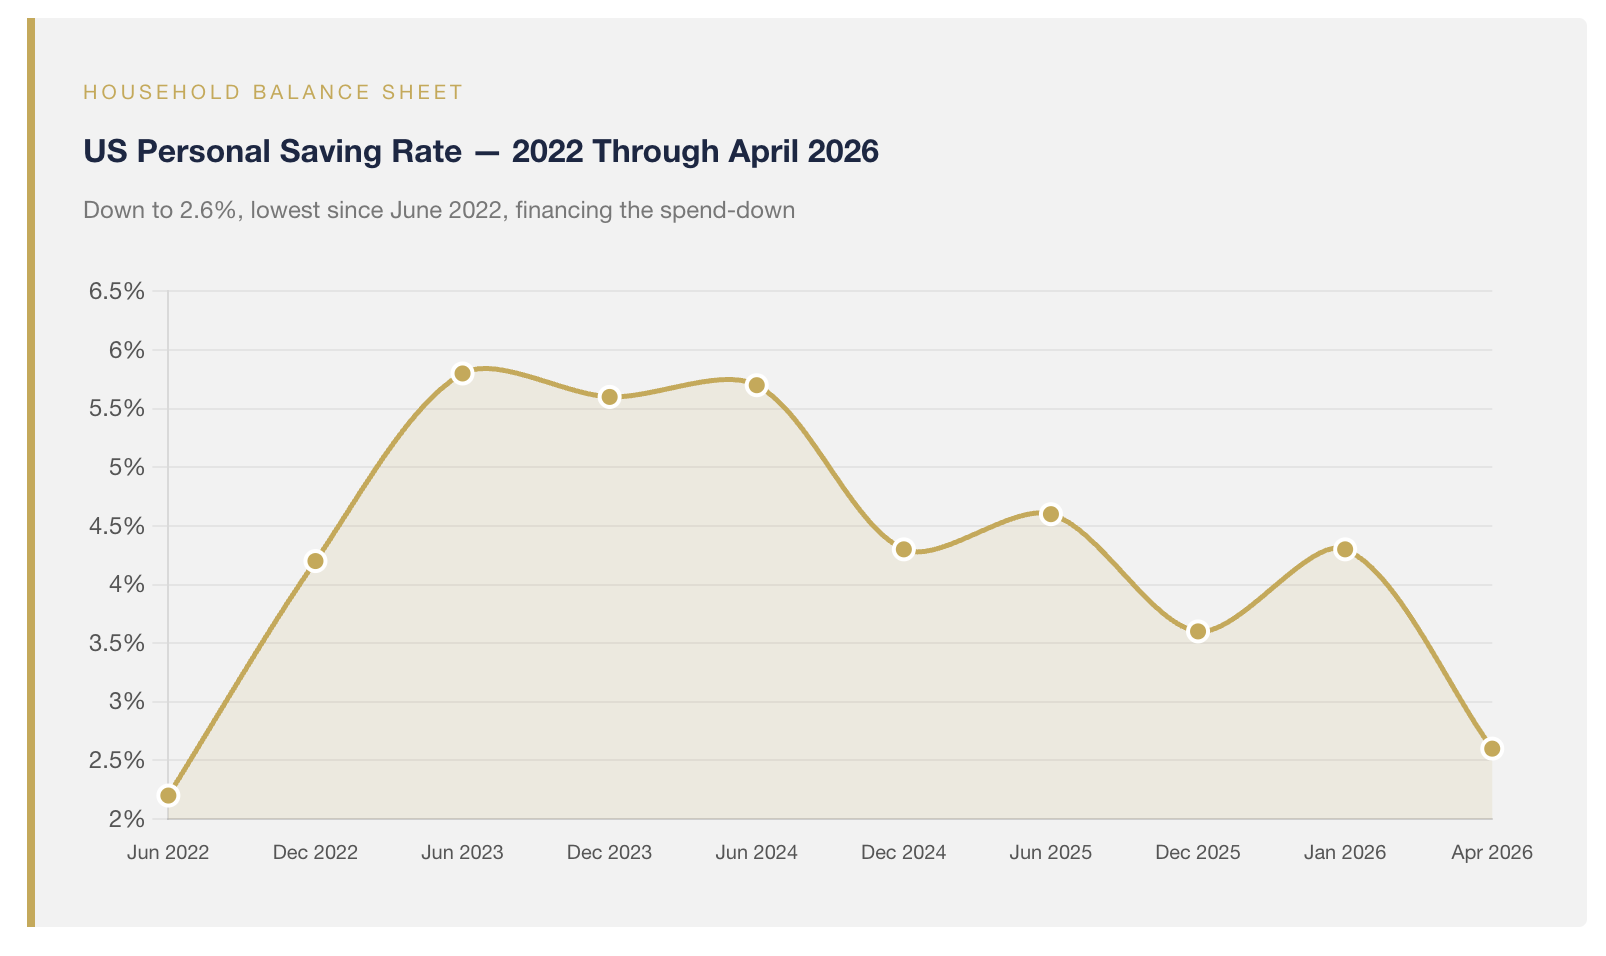
The income and spending side of the same report is where we believe the more durable signal sits. Nominal personal income was essentially flat in April. Real disposable income declined for the second consecutive month. Spending, meanwhile, rose 0.5%. The gap between the two was financed the way it has been financed for most of the past year: by drawing down savings. The 2.6% personal saving rate is the lowest in nearly four years and roughly half the twenty-year average. It is also significantly below the 4.3% rate the same statistic carried as recently as January. A consumer who is spending in excess of income while simultaneously running down accumulated savings is not, in any reasonable read, a consumer with infinite runway. We do not think the runway is exhausted — bank deposits in aggregate remain elevated, the labor market continues to throw off jobless-claims numbers consistent with full employment, and AI-related productivity gains are genuinely lifting the productive frontier of the US economy — but the marginal balance sheet doing the underwriting is thinner than it was at the start of the year.
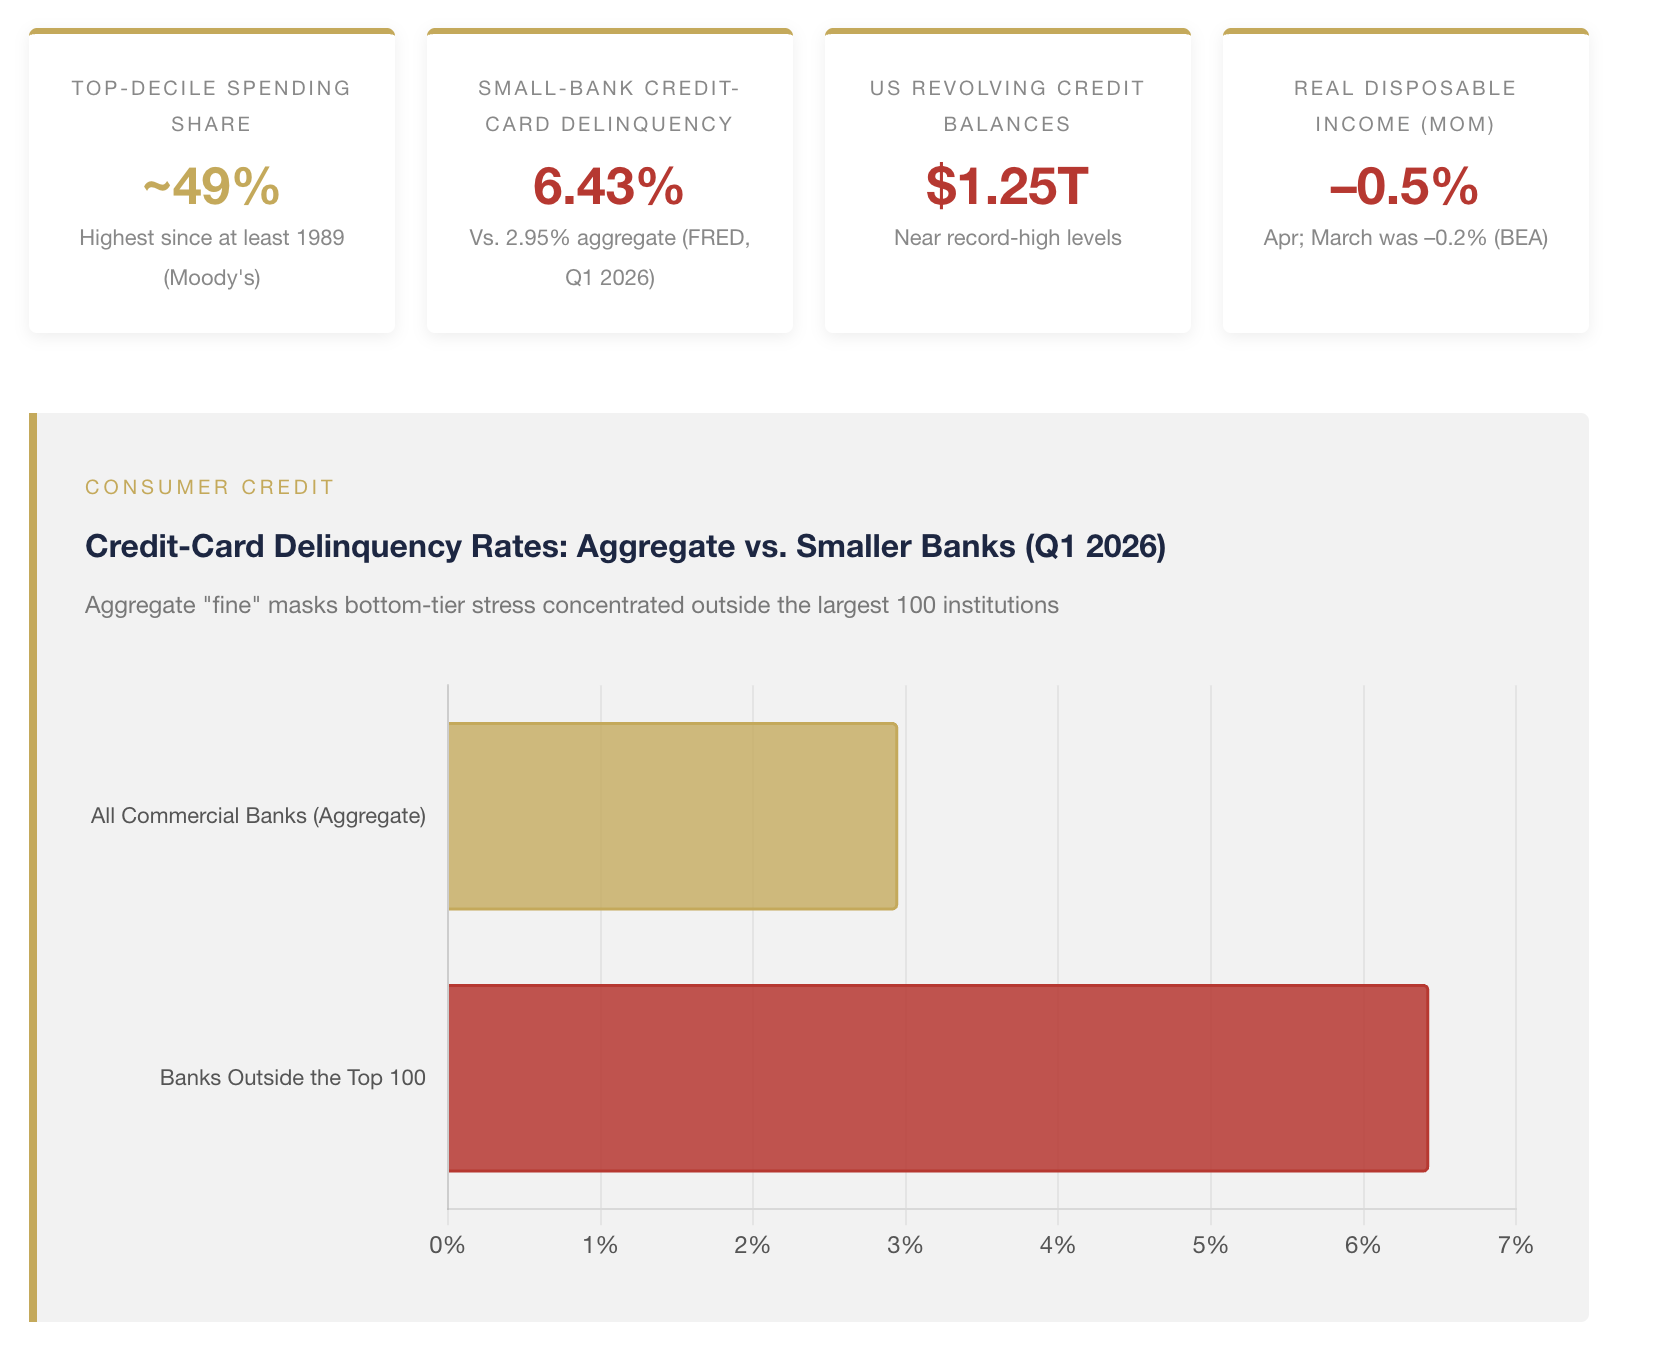
That aggregate, however, conceals a barbell, and we believe the barbell matters more than the headline. Recent work from Moody's Analytics estimates that the top decile of US earners now accounts for nearly half of all consumer spending — the highest concentration since at least 1989 — and that same cohort's spending has grown more than 60% since 2020. Methodologies disagree on the precise share, with the Bureau of Economic Analysis's distributional accounts placing the top-decile contribution lower, but the directional finding is consistent across data sets: the marginal dollar of consumer spending is increasingly being supplied by a high-income cohort whose consumption is closely linked to equity-market gains. Meanwhile, credit-card delinquency rates at the small and mid-sized banks that hold the bulk of subprime exposure reached 6.4% in the first quarter, roughly double the rate at the largest banks, and total revolving credit balances sit near record highs above $1.25 trillion. In other words, the aggregate consumer looks resilient because the top of the income distribution is more than resilient. The lower half is showing exactly the stress one would expect after several years of elevated nominal price increases and a saving rate now down to 2.6%. That is the configuration which has allowed the data to look strong in aggregate and the tape to print new highs even as the bottom half of the cohort tightens — and it is also, in our view, the configuration that carries the most consequential vulnerability for the equity rally, because the AI-cycle gains that have powered top-decile consumption sit disproportionately in the same accounts that would be hit first by an equity drawdown.
"The aggregate consumer looks resilient because the top of the income distribution is more than resilient. The bottom is showing exactly the stress one would expect."
The same Thursday, the Commerce Department's second estimate of first-quarter GDP shaved real growth from 2.0% to 1.6% annualized. The downward revision reflected reductions to investment and consumer spending. We are not inclined to overweight a single estimate — there will be a third revision next month, and Q1's drag from front-loaded tariff effects is now well understood — but the read compounds the takeaway from the PCE release. April durable goods orders, released the same morning, did print at a startling +7.9% month-over-month, comfortably above the +3.5% consensus. Strip out a 165.9% surge in nondefense aircraft, however, and the picture softens considerably: core capital goods orders excluding aircraft fell 1.1% in April. That is consistent with a private economy in which AI-related capital spending is genuinely strong, but in which the rest of the corporate-investment plate is moderating.
We owe readers the same balanced framing we always offer. The US economy is not on the verge of recession. The Conference Board's Consumer Confidence index released Tuesday came in at 93.1 — down a modest 0.7 point from April but above consensus, with the forward-looking Expectations component actually improving. The labor market is intact. The multi-quarter earnings revisions out of the largest US technology platforms remain firmly positive, and the May rally is not made of straw. Where we believe the framing should sharpen is in the question of how long an economy can simultaneously print above-trend nominal spending, a 2.6% saving rate, and a Federal Reserve that — under newly installed chair Kevin Warsh — has signaled it intends to look through near-term disinflation rather than chase it with cuts. Markets entered May pricing a meaningful chance that Chair Warsh's first move would be a cut. By Thursday's release, fed-funds futures had unwound much of that and now imply no policy action either way for the remainder of the summer.
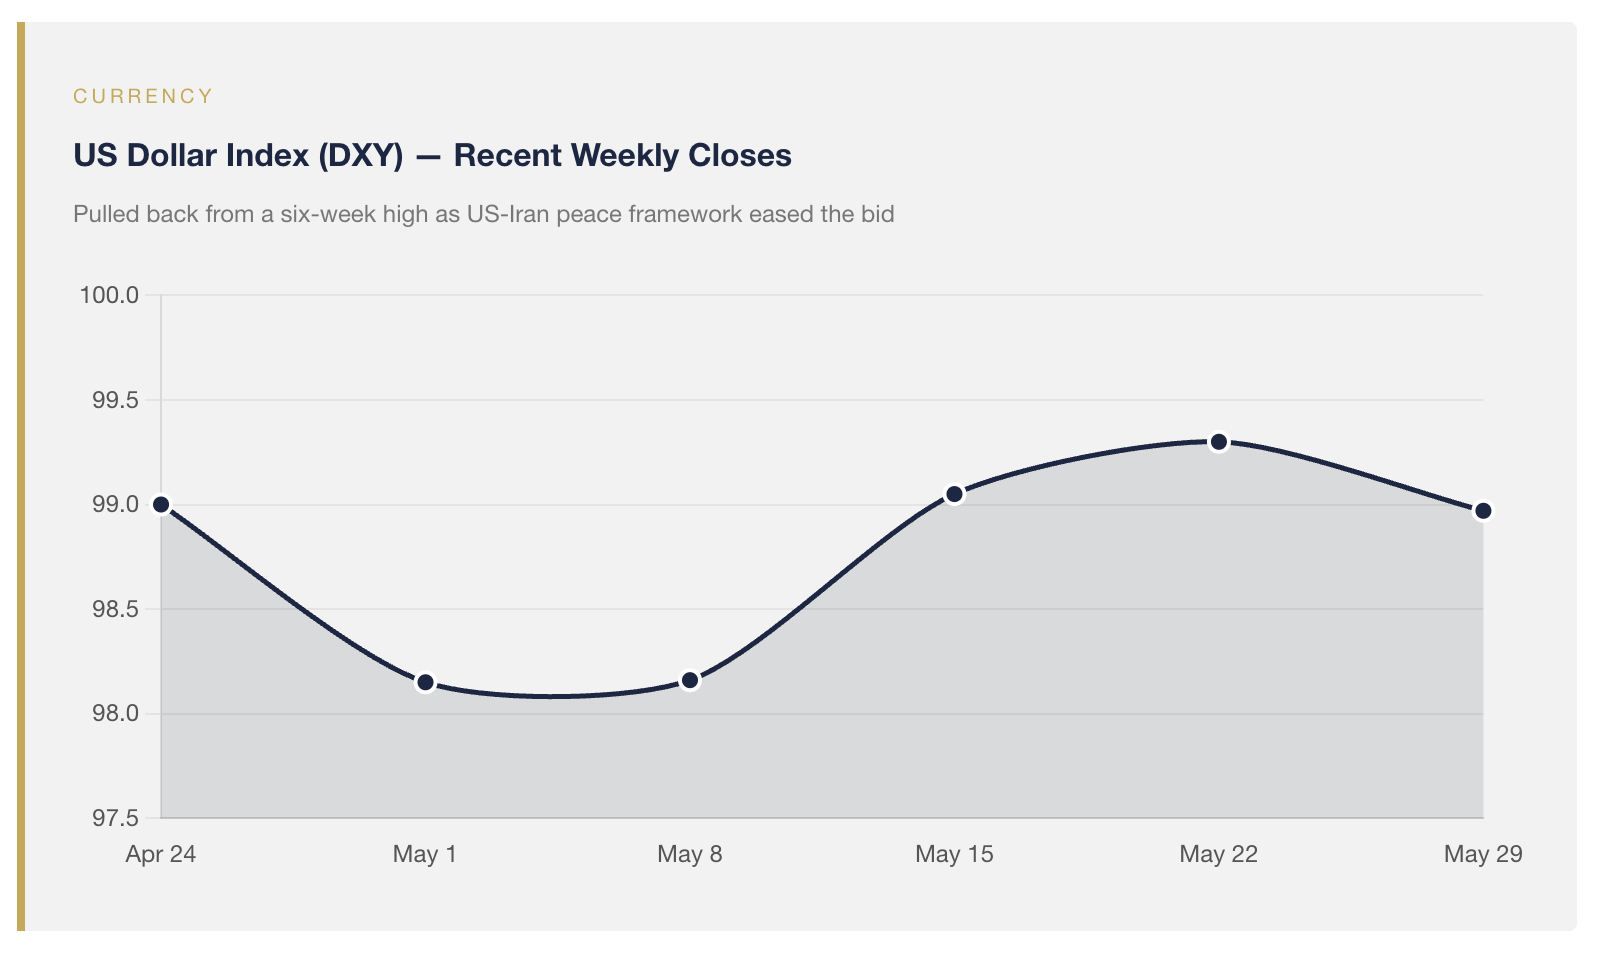
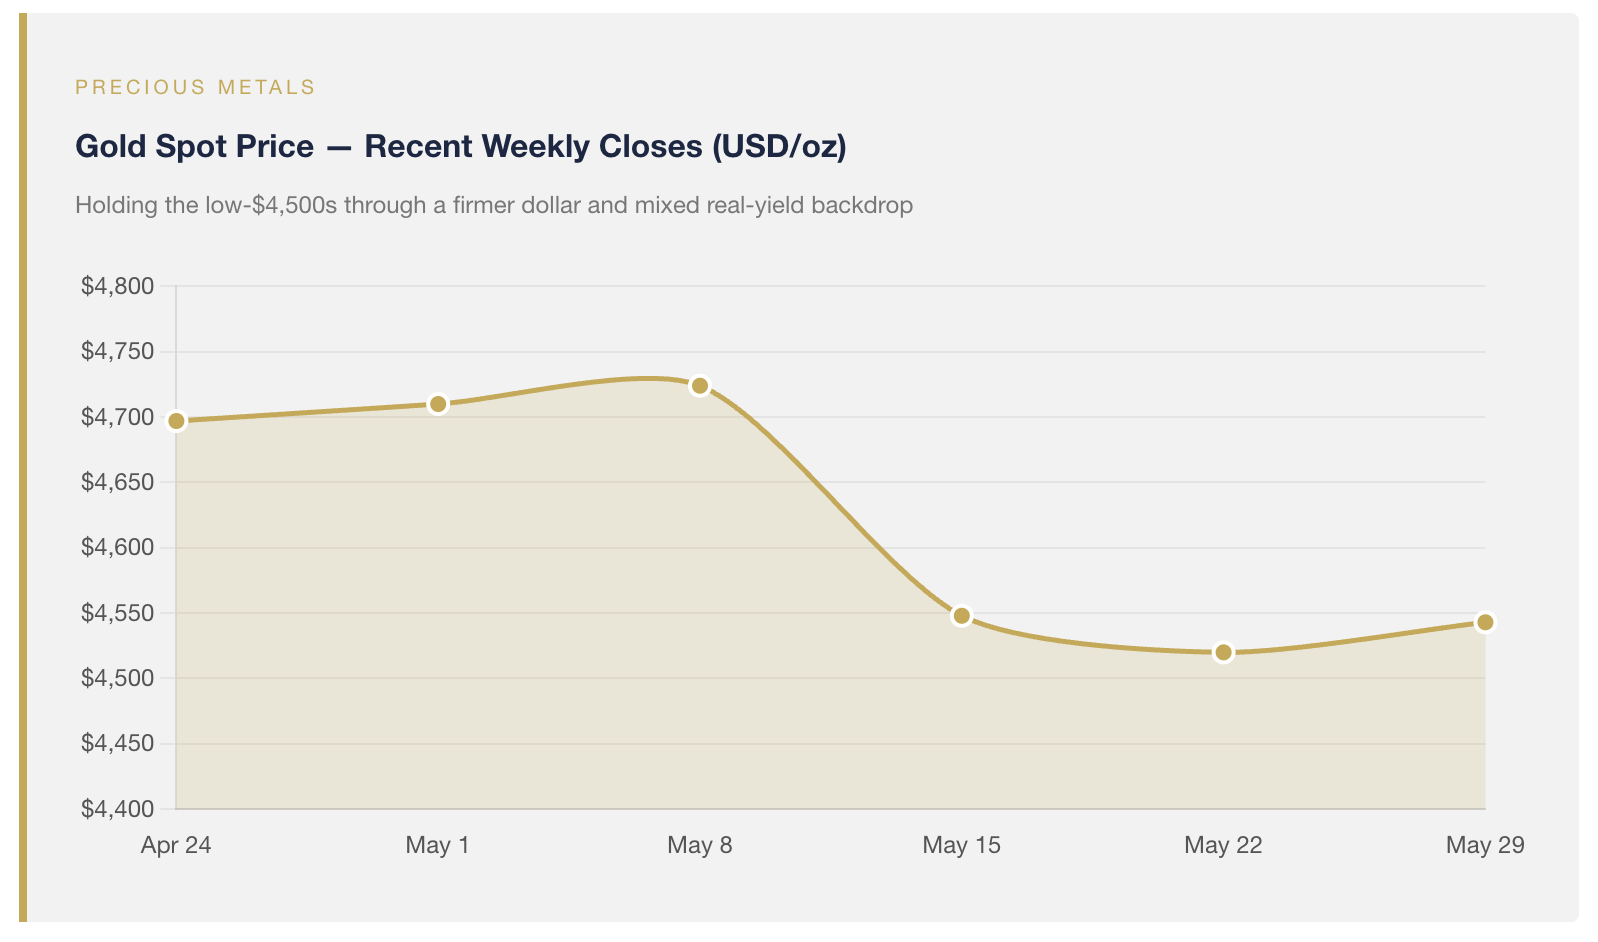
The cross-currents in markets that closed Friday tell the rest of the story. The dollar index closed at 98.97, down from a six-week high near 99.3 the prior Friday, on news of a tentative US-Iran peace framework that helped pull WTI crude oil to a five-week low. The ten-year Treasury yield finished at 4.45%, eleven basis points below the previous Friday's close, as the long end welcomed the lower-oil read-through and the Fed's pause-and-wait posture. Gold settled in the $4,520-to-$4,590 range, recovering some of the prior week's pullback as real yields edged lower. And the euro held above 1.16 against the dollar with the European Central Bank widely expected to deliver its first hike of the cycle on June 11 — a 25 basis-point move that, if confirmed, would mark the first material narrowing of the US-Eurozone rate differential since 2022. Each move, in isolation, is modest. Considered together, they describe a tape in which the marginal flow is migrating away from the dollar at exactly the moment domestic data is reminding allocators why the migration has a foundation.
For the dollar-denominated investor weighing how to position for the back half of 2026, last week tightened a thesis we have been building all year. A saving rate at a three-year low, real disposable income going negative for the second consecutive month, an underlying inflation pulse that is mixed rather than cleanly cooling, a Federal Reserve that is not inclined to cut into it, and a dollar whose rate-differential cushion is now under threat from European tightening — those are the conditions under which real returns matter more than nominal ones. They are also, in our view, the conditions in which a diversified allocation that combines ex-US value equities with hard-asset exposure tends to earn its keep. Our international value strategy is built precisely for the cross-current of a softer dollar and firm foreign earnings the May tape is starting to draw. Our precious-metals and hard-asset work is built precisely for the inflation backdrop the April data confirms is not yet finished. Neither is a bet against America. Both are forward-looking allocations to the parts of the world — and the parts of the asset stack — that we believe the next twelve months will reward.
The S&P 500's ninth straight weekly gain is, on its own, a constructive signal about the resilience of the US economy and the durability of the AI capital cycle. It is also a signal that requires a balance sheet to underwrite. The April data tells us that the marginal balance sheet doing the underwriting — the American household's — is being drawn down faster than at any point since the summer of 2022. That is not a forecast of recession. It is a forecast that the path to the next leg of returns is not as straightforward as nine consecutive weekly gains suggest, and that the cushion which has protected dollar-denominated portfolios for most of the past decade has thinned. If the past week has prompted you to revisit how your portfolio is built to handle that thinner cushion, we would encourage you to reach out to a Euro Pacific Asset Management advisor or visit EuroPac.com to learn more about how our international value and hard-asset strategies are positioned for the regime we believe the data is now describing.
Investment risk
Please read about the Risks of investing in the Funds. You should carefully consider the Fund’s investment objectives, risk, charges and expenses before investing. Investing involves risk, including potential for loss of principal. The risks of investing in emerging market and foreign securities may be higher than the risks associated with investing other securities. Diversification cannot assure a profit or protect against loss in a down market. Dividends are not guaranteed and may fluctuate. Fund holdings are subject to change and risk. Past performance cannot predict future results.
To obtain a prospectus or summary prospectus that contains this and other information about the Funds, please Click Here or call 1-866-878-2881. Please read the prospectus carefully before investing. Euro Pacific Asset Management Funds are distributed by Distribution Services, LLC (Euro Pacific Asset Management is not affiliated with Distribution Services, LLC).
Disclosure: Any tax or legal information provided is merely a summary of our understanding and interpretation of some of the current income tax regulations and it is not exhaustive. Investors must consult their tax advisor or legal counsel for advice and information concerning their particular situation. Neither the Funds nor any of its representatives may give legal or tax advice.
A message from Advisor Perspectives and VettaFi: Discover something new! Click here to register for our upcoming webcasts.
© Euro Pacific Capital
Read more commentaries by Euro Pacific Capital