Summary:
EM fixed income should deliver compounded returns ranging from 30% and 60% in Dollar terms over the 2019-2023 investment horizon as markets revert to unwinding the so-called ‘QE trades’ after a temporary US election related interruption in 2018. As for 2019 returns, they may be marginally stronger than the five-year average due to the pullback in 2018. The main EM risks will be idiosyncratic, probably election-related. By far the largest risks to global finance over the next five years emanate from developed countries due to their overvalued markets, slowing economies, policy tightening and growing populism.
Introduction
EM fixed income benchmark indices now cover 153 individual markets, making EM bonds the most diverse fixed income asset class in the world. We expect compounded returns between 30% and 60% in Dollar terms across the various themes with 2019 returns tilted slightly higher than the five-year average due the pullback in EM asset prices in 2018.
US mid-term election-related policy interventions interrupted the EM rally in 2018. However, in 2019 we expect performance to rebound to the patterns seen in 2016-2017 as the unwinding of so-called ‘QE trades’ resumes. This should favour EM over developed markets, and, within EM, we expect local currency bonds to outperform Dollar-denominated bonds as EM FX embark on an eventual 20% recovery versus the Dollar.
Within the universe of Dollar-denominated bonds, we see the return potential as highest in high yield, where spreads are well wide of historical averages. Even so, investment grade credit should perform all right, because the US Treasury market has mostly priced in the likely terminal Fed funds rate.
The main EM risks in 2019 are idiosyncratic. Like in 2018, the market likely focus on a number of key elections. However, the largest sources of volatility will be developed economies, where markets are overvalued, stimulus is being withdrawn and politics is becoming ever more populist.
EM fixed income
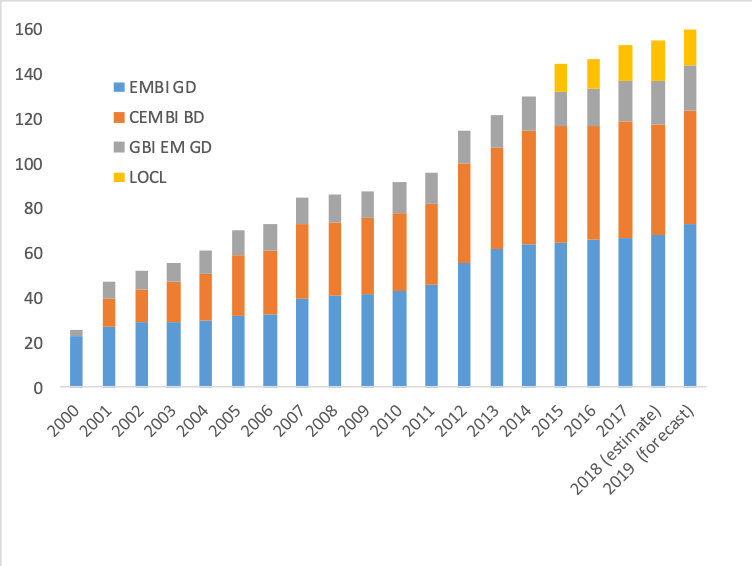
This report covers the USD 24.3trn EM bond market, which is already the most diverse fixed income asset class in the world. While 91% of EM bonds have still not been included in benchmark indices, the four main EM fixed income benchmark indices already cover 153 individual markets (Figure 1). This comprises 68 sovereign external debt markets (EMBI GD), 50 external corporate debt markets (CEMBI BD) and 19 local currency government bond markets (GBI EM GD). In addition, there is now an index, which covers 16 local currency corporate bond markets (LOCL). One day, when all EM countries have joined all four indices, the EM fixed income will comprise 680 individual bond markets compared to a theoretical maximum number of bond markets in developed countries of 144. At the current pace of index inclusion, EM indices will cover 320 individual markets by 2050.
Figure 1: The most diverse fixed income universe in the world
Source: Ashmore, Bloomberg, JP Morgan, ICE.
The 2018 interruption
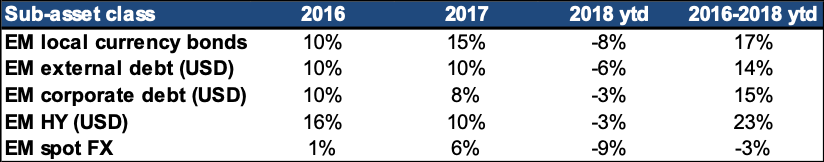
EM fixed income markets suffered a setback in 2018, but have still performed strongly over the past three years (Figure 2). The setback in 2018 was due to a large unfunded corporate tax cut in the US and the imposition of import tariffs, which caused a sharp but temporary rebound in the Dollar, which in turn adversely impacted sentiment towards and performance of EM fixed income. The tax cut and tariffs were designed to help Republicans in November’s Mid-term election, but are unlikely to provide lasting support for the Dollar. In fact, experience shows that the election-related fiscal give-aways typically increase macroeconomic instability, while tariffs reduce rather than enhance productivity. We see no basis for a sustained Dollar rally here.
Figure 2: Performance in EM fixed income 2016 through 2018
Source: Ashmore, Bloomberg, JP Morgan
Instead, we view the 2018 pullback in EM as a mere interruption in much more profound market forces, which should push the Dollar lower in 2019 and beyond. These forces are rooted in excessively long positions in Dollars and other developed market assets established over the past eight years in response to Quantitative Easing (QE) policies. The unwinding of the distorted positions, call them ‘QE trades’, is likely to shape flows in global markets for years to come.
Back to unwinding QE positions
What are the QE trades? Investors accumulated sizeable longs in Dollars, US equities and European fixed income in response to QE policies between 2010 and 2015. Importantly, investors also underweighted EM heavily, because no QE program involved buying EM bonds, which meant that EM only offered yield, while developed markets offered enormous capital gains (see Appendix for an explanation of how the QE-trades came about). EM could simply not compete in terms of returns. The QE trades began to unwind after the first Fed hike in December 2015, starting with the Dollar longs and EM short positions. The Dollar fell in both 2016 and 2017, while EM rallied strongly.
After the 2018 interruption, we expect the unwinding of QE trades to re-manifest itself. We expect a particularly strong performance in EM local currency markets, although all segments of EM fixed income have become cheap on a historical basis and relative to fixed income in developed markets. The whole EM fixed income complex should therefore perform well in 2019.
A medium-term investment outlook
To get a sense of the return potential in EM fixed income in the context of the gradual normalisation of global asset allocation, we favour a medium term perspective. A medium-term investment framework marries forward-looking views of global macroeconomic and political developments with bottom-up assessments of conditions in EM as well as valuations across all markets, all within a five-year base case scenario around which various risk scenarios can be formulated.
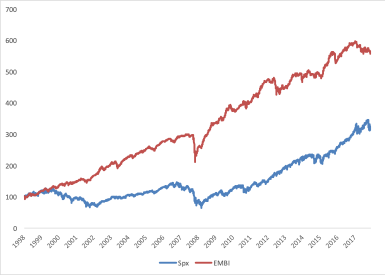
The main advantage of adopting a five-year investment framework rather than the usual inane one-year calendar forecasts is that the longer-term perspective helps investors to make better decisions. A medium-term perspective gives less weight to near-term developments, which typically turn out to no lasting impact on performance, while focusing more attention on EM’s extremely strong longer-term returns. Figure 3 illustrates the point of taking a longer-term perspective. EM sovereign bonds have dramatically outperformed US equities over the past twenty years. Most investors missed this outperformance precisely because they paid far too much on the endless list of near-term risks, which always seem to place obstacles in the way of putting money to work in EM. Another way of saying the same thing is that the biggest risk in EM is not to invest.
Figure 3: Total return: EM external debt versus S&P500
Source: Ashmore, Bloomberg, JP Morgan
Return scenarios
In the following sections, we outline our return scenarios for local currency bonds, EM FX, sovereign Dollar-denominated bonds as well as high-grade and high yield corporate bonds in Dollars over the next five years.
For the Dollar-denominated bonds, we calculate the period return as the compounded average yield over the full five-year period. The average yield is estimated as the mean of the yield today and the expected yield five years forward. The latter is calculated based on market estimates of the US treasury yield five years forward (at the relevant duration) plus the ten-year average EM spread. In other words, there is an assumption of gradual mean reversion implicit in spreads within our return estimates. All yields are also adjusted for default-related losses based on long-term average annual default rate.
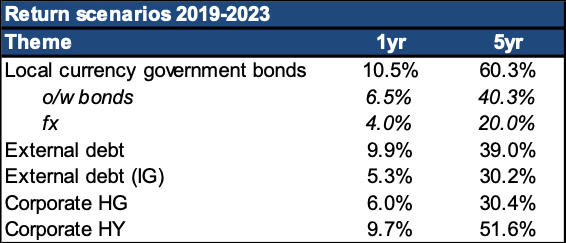
The methodology for calculating local currency returns is slightly different. Local bonds do not trade as a spread over Treasuries. Hence, we calculate the period average yield as the mean of today’s yield and the 10-year average yield. Our expectation of EM FX is based on exchange rates, growth rates and productivity metrics – please see the relevant section below. We also present one-year return estimates, which may differ from the five-year estimates to the extent of various short-term sentiment drivers, cyclical effects and various other misalignments. We explain these factors in the relevant sections below. Figure 4 summarises our basic one and five-year return scenarios for the main EM fixed income themes.
Figure 4: 2019-2023 returns: 1-year and 5-year scenarios
Source: Ashmore
1. EM local currency bonds
Despite very low real rates in developed markets, EM bond yields have been high in both nominal and real terms for some time due to the dictionary impact of QE polices on global asset allocation. These distortions caused underperformance for some time, but they now make for a strong return proposition. The current bond yield of 6.6% is only a smidgen below the long-term average (Figure 5). Hence, investors should expect an average yield of 6.6% over the next 5 years for a compounded return of 40.3% over the full period.
Figure 5: EM inflation and bonds yields (excluding Argentina and Turkey)
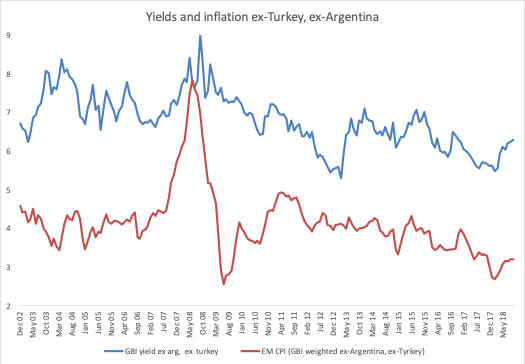
Source: Ashmore, JP Morgan, Bloomberg
We see no serious inflation threat to performance. Inflows to local markets in the next few years should gradually help to push inflation higher, but the starting point for inflation is extremely low. Excluding Argentina and Turkey, current EM inflation is just 3.2%, which is materially lower than long-term average inflation of 4.1%.1 Real yields are high due to low inflation rather the credit stress, which means that central banks can cut rates in case of slower than expected growth.
Pass-through to inflation from weaker FX in 2018 has been modest due to credible monetary policies across most EM countries.2 As for the likely impact of US Treasury yields on local bonds, it tends to be very modest (about 25bps for every 100bps move in the US 5-year yield). We have assumed a small capital loss of 0.1% for 2019 from the US Treasury market. Net, we end up with a base case scenario that bonds deliver 6.6% return in 2019, net of FX.
Finally, watch China closely in 2019. There is a distinct possibility that JP Morgan finally admits Chinese bonds to the GBI EM GD index.3 Over time, China’s inclusion in the benchmark could change how investors trade EM local markets. Chinese bonds tend to outperform not only other EM bonds, but also most other global bonds during bear markets (see Figure 6 for the performance of Chinese bonds in 2018). The fact that Chinese bonds offer a superior intra-EM safe haven destination means that EM investors can profitably allocate to China instead of redeeming back into Dollars in bear markets. Over time, this will happen more and more and should result in greater EMFX-RMB currency volatility and lower EMFX-USD currency volatility. It will also reduce demand for Dollars over time, especially during risk aversion events.
Figure 6: 2018 YTD returns for 5yr bonds (in USD terms)
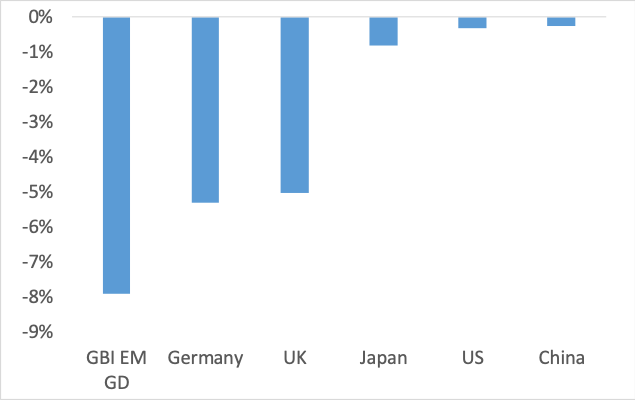
Source: Ashmore, Bloomberg
2. EM FX
The Dollar is about 20% overvalued relative to EM currencies, in our view. The Dollar assumed these dizzying heights in both real and nominal terms over the past eight years as investors went long Dollars in expectation of a strong US economic recovery and associated higher interest rates. However, the US recovery is now very mature and the market has priced the Fed’s likely terminal rate. As the bull-market case for the Dollar wanes, we expect investors to look to reduce Dollar exposure in favour of other currencies, including EM FX.
The 20% misalignment of the Dollar relative to EM FX is evident in three independent economic relationships (Figure 7). First, a wedge of about 20-25% has emerged between real effective exchange rates in the US and EM. Second, forward-looking growth differentials favour EM over US over the next five years to the tune of about 20%. Thirdly, the Dollar is about 20% overvalued relative to US productivity growth.
Figure 7: 20% mispricing of USD versus EM FX
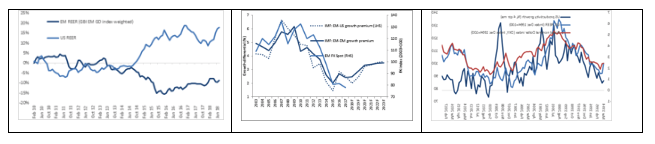
Source: Ashmore, Bloomberg, JP Morgan
Having said that, the Dollar is obviously an extremely volatile currency, so investors should not expect to realise the 20% upside in EM currencies in a straight line. Interruptions, such as 2018, have happened before and will happen again. This is precisely why investors should maintain the discipline of a medium-term perspective; against the multi-year upside potential of 20% it is clear that transitory spikes in the Dollar are opportunities to exit Dollar positions at attractive levels in favour of EM FX.
Other factors may weigh on the Dollar over the longer term, including America’s retreat from its erstwhile global leadership role. America’s reward for sponsoring a rules-based system of global conflict resolution via multilateral institutions, free trade, near-universal access to the US banking and legal systems as well as free movement of capital was that the rest of the world willingly adopted the Dollar as unit of account and medium of exchange for cross-country operations. As the US increasingly replaces rules with discretion, the risk of using Dollar goes up and the willingness of other countries to continue to use the Dollar goes down. This how global reserve currencies decline. Diversification away from the Dollar should initially favour existing SDR currencies, but crumbs from the big table should also fall onto non-SDR currencies, especially the larger EM currencies.
3. Sovereign debt
Like FX, we believe that EM sovereign Dollar-denominated bonds (‘external debt’ are mispriced. When JP Morgan adds five Middle East countries to the EMBI GD index at the end of January 2019, the total number of countries in the index will reach an unprecedented 73 countries. This compares to just 23 countries in 2000 and 33 countries in 2006 (Figure 8). In the context of such a big increase in diversification, it makes no sense to us that spreads are sitting at 398bps, which is more than twice as wide as in 2006 (181bps).
Figure 8: Number of countries in the EMBI GD
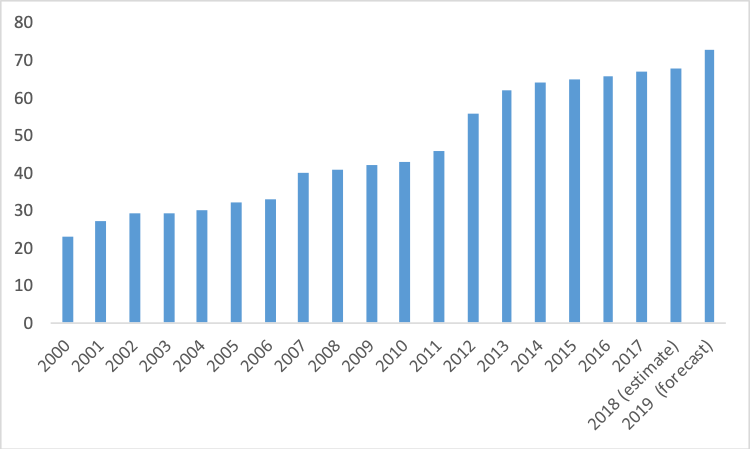
Source: Ashmore, JP Morgan, Bloomberg
Mispricing is generally a good guide to future returns. Barring any major macroeconomic surprises, we see EM sovereign Dollar bonds returning about 39% in compounded return over the next five years. We expect yields to average some 6.8% over this period, given where the market is currently pricing Treasuries in five years’ time plus our expectation that spreads return to their 10-year average of 350bps. Investment grade EM sovereign bonds should return about 5.3% in the next twelve months and about 30% over the full five-year period ahead. We see less room for spread compression in investment grade in 2019, because spreads are already close to their long-term average.
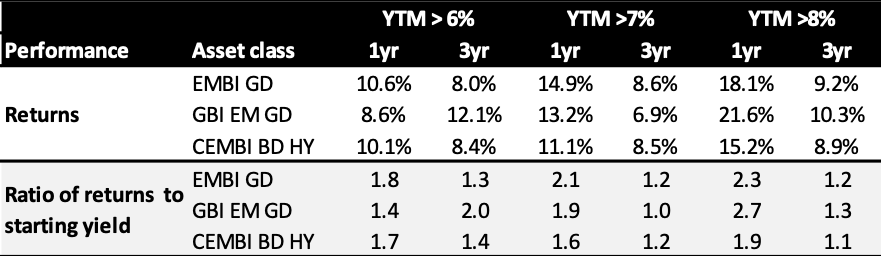
Return should be marginally higher in 2019 than the five-year average, because spreads are currently about 50bps wider than their 10-year average following the pullback in EM in 2018. This implies a return of just shy of 10% in 2019.4 Historically, returns after spikes in yields above 6% have been about 10% (Figure 9).5 Note that yields briefly went above 7% in 2018, so the risk scenario tilts to the upside.
Figure 9: Returns after spikes in EM bond yields
Source: Ashmore, JP Morgan, Bloomberg.
What about risks? First, a few EM countries will of course screw up in 2019. This happens every year due to elections, policy mistakes, external shocks, etc. Such risks are best handled with active management. Next year the market will undoubtedly focus on elections in Nigeria, South Africa, India, Indonesia, Poland, Romania, Ukraine and Argentina as well as parliamentary elections in the Philippines and local elections in Turkey. Thais may also go to the polls in 2019. How markets perceive these events will depend heavily on the direction of the Dollar. Typically, the market exaggerates the importance of country-specific events if the Dollar is rising, whereas if the Dollar is falling, which is our expectation, the market tends to treat country-specific stories in EM rationally, i.e. as the idiosyncratic events they are.
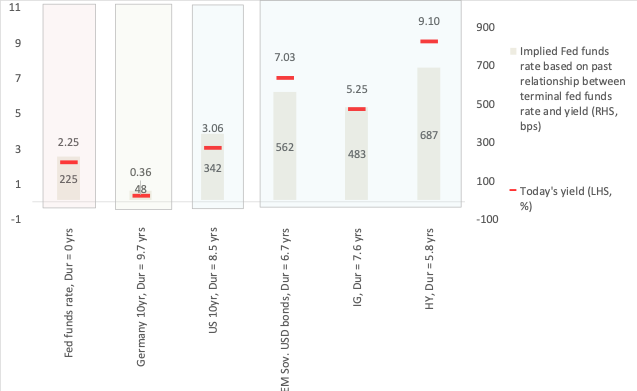
We do not see major risks emanating from movements in the US treasury curve. As Figure 10 shows, US treasury yields already price in what the Fed says it will do, i.e. take the Fed funds rate to about 350bps. EM sovereign bonds actually price in a peak Fed funds rate of 562bps. The enormous discrepancy is indicative of the still wide distortions caused by QE. These distortions, once painful, now mean higher income, a cushion against underlying Treasury volatility and capital gains as the distortions are unwound.
Figure 10: Yield and the implied terminal fed funds rate
Source: Ashmore, Bloomberg, JP Morgan
4. Corporate bonds
On a five-year investment horizon, the annual return on EM Dollar-denominated corporate high-grade and high yield bonds should be roughly 30.6% and 52%, respectively. As with sovereign bonds, we assume a return to long-term average spreads over five years. This may prove too conservative. After all, financial markets are deepening and broadening across EM as living standards steadily rise, so credit worthiness should improve too. We assume zero defaults for high-grade bonds. For high yield bonds, we assume a gradual increase in default rates over the next five years towards the long-term average default rate of 3.5% from the current default rate of 0.9%. The broad corporate bond index (CEMBI BD) is roughly 70% investment grade and 30% high yield.
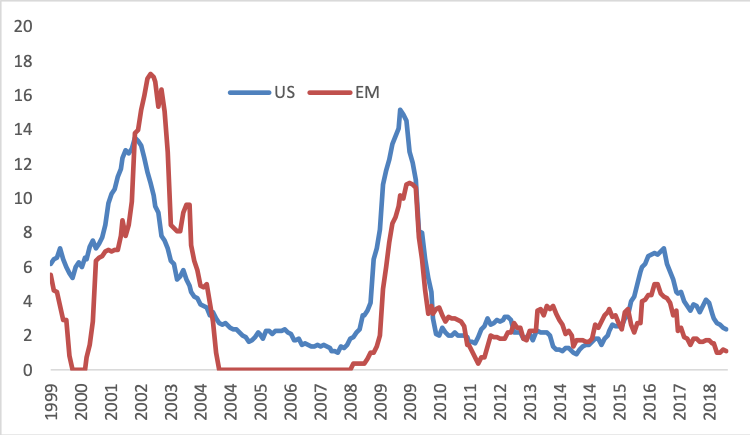
As with local bonds and external sovereign debt, 2019 returns could be slightly stronger than the medium-term return due to market movements in 2018. Specifically, EM corporate spreads widened, while default rates declined outright in 2018 (Figure 11). EM high yield default rates remain less than half of default rates for US high yield issuers.
Figure 11: EM high yield corporate default rates
Source: Ashmore, BAML, Bloomberg
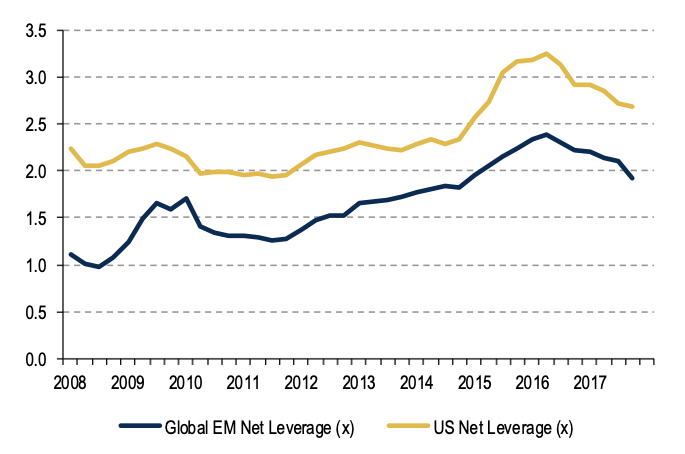
It is also worth mentioning that EM corporate net indebtedness continues to decline. Net leverage to EBITDA is now just 1.9 times in EM compared to 2.7x for US corporates (Figure 12). Together with declining default rates, the decline in leverage makes the spread widening in 2018 looks unfounded, or, at least, excessive. In 2019, we expect a small pick-up in EM corporate default rates of about 0.5% due to slower growth, rising US interest rates and tighter financial conditions in 2018. Factoring in this rise in defaults, we still see room for modest spread compression of about 20bps for high-grade bonds and 40bps for high yield bonds. Altogether, this speaks for returns of about 6.0% for high-grade bonds and 9.7% for high yield bonds in 2019. Credit stresses in the more leveraged US and European credit markets could become a source of volatility for EM corporates.
Figure 12: Net indebtedness to EBITDA (EM vs US high yield corporates)
Source: Ashmore, BAML
Global risks galore
Turning to the global backdrop, our base case expectation is that US growth slows from a 3% handle in 2018 to a 2% handle in 2019 and a 1% handle in 2020. The further we move into the future the greater the probability of recession. Recession is inevitable over the five-year horizon, in our view, given the already mature stage of the business cycle. At the margin, policy mistakes, such as protectionism and pro-cyclical fiscal spending, increase both the probability and the cost of recession. US inflation risks are rising too. This is partly due to full employment in the labour market, but also reflects the very badly timed fiscal expansion, protectionist trade policies and the lack of attention to supply-side issues. Tariffs directly increase costs at a time, when costs are already eating into company earnings, and tariffs increase costs indirectly by discouraging the outsourcing of production to more efficient destinations, such as China.
Against this backdrop, the primary difference between the big EM rally from 2002 to 2009 and the EM rally over the next five years is the US growth backdrop. US growth was on the up in the mid-2000s, but US growth will be slowing in the next five years. The poorer US growth outlook makes for a more ambiguous backdrop in terms of sentiment towards EM investments than in the mid-2000s. Investors will undoubtedly be torn between making better returns in EM and obeying their ‘better prejudice’, which will them not to invest in EM when they are scared about what is happing to their much larger exposures in developed markets.
The biggest risks by far in global finance over the next half a decade will emanate from developed markets. After years of QE, these markets remain grossly overvalued, implying that investors are too heavily exposed. Fiscal and monetary support is waning, but pitifully few developed economies used the ‘good years’ to address their underlying debt and productivity challenges. Hence, a meaningful downwards adjustment in asset prices in developed countries should not be ruled out over the investment horizon.
To make matters worse, the current crop of populist governments do not inspire confidence in their ability to handle the fallout from a crash. Central banks, the rescuers in the last crisis, have precious few policy options left to reverse a downturn, while fiscal policy is more constrained by rising debt and less accessible due to the lame duck status of many Western governments, including the Trump Administration. A major slowdown in developed markets would weigh on commodity prices, which would be a tailwind for two thirds of EM, but pose challenges for some countries mainly in Africa and Latin America.
Divided and weak, Europe is struggling with its own problems. Brexit poses an immediate and serious risk with potentially global ramifications. Fascism is rising in Eastern Europe, leadership is fading in Germany and France is in political paralysis. Europe still does not have strong Federal fiscal institutions, so countries, such as Italy, can exploit the situation for its own ends. A debt crisis could yet spark major fears of European disintegration.
China will continue to pursue the transition towards a market-driven, consumption-led economy. This leads to slower growth at a time, when China is also in the crosshairs of American protectionists. As usual, few investors (Ashmore being an exception) are likely to China the benefit of the doubt, so sentiment will continue to be impacted by developments in China. Our view is that China unflinching commitment to reform will eventually put the country in a strong position to replace the US as the pre-eminent global and economic hegemon. Global leadership is sorely needed as America shrinks from the world, but China does not yet command enough trust in the West to offer a realistic substitute. This means that global leadership is likely to describe a long and deep ‘U’. In the next few years, the decline in global leadership translates into more nationalist beggar-thy-neighbour policies, more tragedy of the commons type problems. The global backdrop for trade, the environment, even peace, therefore looks fraught with risks unless and until someone steps forward with vision, courage and strength to lead global politics in a more responsible direction.
Appendix: How QE distorted global asset allocation
QE itself only had a limited direct impact on markets, principally by driving real yields to zero in developed bond markets. However, QE had a huge indirect impact on markets far beyond developed market bonds by influencing investor behaviour, global asset allocation. Investors took the view that under QE the US would stage a strong economic recovery, because US banks were recapitalised early on. By contrast, investors expected no recovery in Europe, where banks were never recapitalised. These two views gave rise to three major consensus trades, namely: long Dollars, long US equities and long core European fixed income. All three trades generated enormous capital gains. The Dollar rallied 35% in broad terms and 50% against EM currencies, total return to US stocks was 430% and German bonds made 80%. Faced with such large capital gains, investors withdrew a third of the money invested in EM, since EM only delivered yield in the absence of QE. Dollar longs and EM underweights began to close in 2016 and 2017, but were interrupted in 2018 due to election-related policy interventions in the US. With the election out of the way, markets will revert unwinding the QE trades in 2019.
1 If Argentina and Turkey are included current inflation is 4.4% compared to long-term inflation of 4.5%, but inflation should declines sharply in both Argentina and Turkey in 2019, in our view. Argentina and Turkey are currently undertaking major macroeconomic adjustments, which were necessitated by self-inflicted macroeconomic mismanagement problems. Such problems are not present in other EM countries.
2 For more explanation of why FX pass-through is a myth in most EM countries, see http://www.ashmoregroup.com/insights/research/revisiting-em-fx-pass-through-hypothesis
3 Bloomberg- Barclays will include Chinese bonds in their global indices in April 2019.
4 Wes assume a default rate of 0.5% per annum, which is equal to the historical average over the past 20 years.
5 We base this analysis on data from 2002 to 2018.