The case for Emerging Markets external debt is solid. The long-term risk-reward has been and remains compelling. The outlook over the medium-term also favours the asset class as the unwinding of distortions in global bond markets attributable to Quantitative Easing strongly favour EM over developed markets.
The near-term outlook is not without risk, but most of the serious external shocks with potential to derail EM have already occurred. Over the next five years, assuming no rally, i.e. no reduction in yields, we believe that EM external debt could easily deliver nearly 35% return in Dollars, with significant potential for additional return via alpha generation as the asset class continues to deepen and broaden.
A brief history of EM external debt
The modern market for Emerging Markets (EM) sovereign Dollar-denominated bonds – known colloquially as EM external debt – traces its origins to the Petrodollar loan boom, which emerged during the oil price shocks of the 1970s. When oil prices tumbled in the 1980s, Western banks found themselves with enormous exposures, which they were unable to trade due to the low liquidity of the instruments. In order to help the banks, US Treasury Secretary Nicholas Brady introduced a program to package the loans into so-called ‘Brady bonds’, which were large liquid securities, which could trade freely in London and New York. The Brady bonds were later replaced by so-called Eurobonds, which today constitute the backbone of the EM external debt asset class. Eurobonds are large, Dollar-denominated, Euroclearable bonds issued under New York or English Law. In the 2000s, many EM countries began to establish pension funds, which enabled them to begin to secure financing in their own currencies. The local currency government bond market has since replaced external debt as the primary funding source for most established EM countries. However, the external debt asset class continues to grow because incumbent issuers continue to issue and new countries, typically lower income EM countries, which do not yet have local pension funds, regularly enter the asset class.
Size
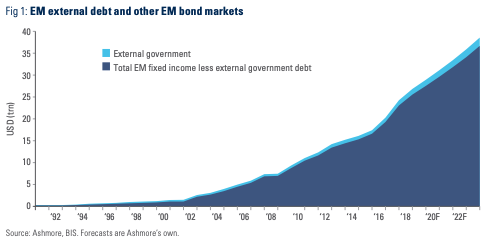
Today, EM external debt is the smallest part of the USD 24trn EM fixed income universe. External debt comprises of sovereign and quasi-sovereign bonds denominated in Dollars and other non-EM currencies. As of end 2017, the EM external debt universe measured USD 1.2trn, according to Bank of International Settlements. This is roughly equivalent to 5% of the total EM fixed income universe (Figure 1), 3.7% of EM GDP and 1.1% of the global bond market.
Trends
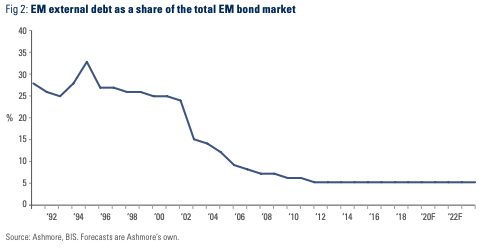
The EM external debt universe has grown by approximately USD 50bn per year since 2000, when the asset class measured just USD 360bn. Despite sizeable annual growth, the share of external debt as a percentage of EM GDP has declined due to even faster expansion of EM nominal GDP in Dollars terms. The share of EM external debt in the total EM bond market has declined even faster from a peak of 33% in 1994 (Figure 2). This decline is mainly due to the growth of local currency bond markets, which are now the main source of financing for many EM governments.
Regional issuance
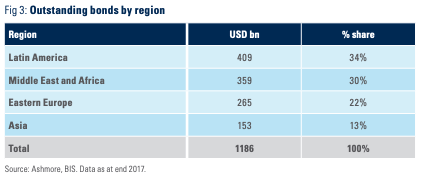
The two largest regions issuing external debt are the Middle East/Africa and Latin America (Figure 3). Some countries in these regions are natural issuers of Dollar-denominated debt, because their currencies are pegged to the Dollar. Many also export commodities, so they prefer to create liability streams in the same currencies as their main revenue sources. Finally, some countries in these regions have under-developed domestic pension systems, which forces them to rely more on external markets for financing. Eastern Europe and Asia issue relatively little external debt. They have well developed domestic bond markets, which provide the bulk of the financing for their governments. For example, Thailand does not even have any outstanding external debt.
The largest issuers
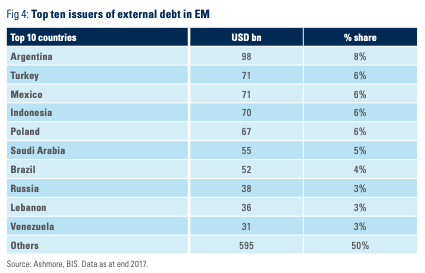
The top ten largest issuers of EM external debt account for 50% of the total outstanding (Figure 4). The two largest issuers are Argentina and Turkey. Both countries have recently experienced major macroeconomic instability. This is partly due to the large stock of external government debt in Argentina. However, the stock of external government debt is relative small in Turkey at less than 20% of GDP and hence not the source of the problem. Saudi Arabia has become a large issuer since the decline in oil prices in 2014. Brazil, Mexico, Russia and Indonesia are large, frequent and opportunistic issuers in the external bond markets. They do not issue for financing reasons, rather they issue to maintain liquid sovereign yield curves which corporates use to price bonds (corporate dollar bonds usually price as a spread over the sovereign curve).
Benchmark index
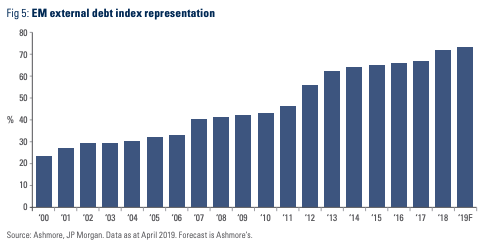
EM external debt is benchmarked to the JP Morgan’s EMBI GD. This index is a so-called diversified index, meaning that it caps the largest issuers at an index weight of 10% of total eligible securities. As a result of this cap plus other exclusions, the EMBI GD only captures about 46% of total outstanding EM external debt.1 As of Q1 2019, there were 73 EM countries eligible for inclusion in the EMBI GD (Figure 5), while the total number of sovereign issuers is 92 countries.
Index deficiencies notwithstanding, the number of countries in the EMBI GD increases almost every year. In 2000, there were only 23 countries in the index, implying an average increase in the number of index members of just under three countries per year, although the pace of index inclusion tends to be somewhat uneven, rising in bull markets, declining in bear markets. Looking ahead, there are roughly 165 EM countries in the world, so the number of EM countries entering the EMBI GD can be expected to rise in the coming years, enhancing index diversification with each addition.
Credit rating
As of April 2019, 80% of the bonds in the EMBI GD were from pure sovereign issuers, while the remaining bonds were issued by quasi-sovereigns, i.e. companies with 100% government ownership. By market cap, 49% of the bonds in the EMBI GD are investment grade, but the average rating is widely expected to reach investment grade once the ongoing inclusion of five GCC countries has been completed within the next few months.2 The average credit ratings vary with market sentiment, global business cycle dynamics, external factors such as commodity prices and US interest rates as well as flows into and out of the asset class, EM credit fundamentals and the tactical inclinations of the ratings agencies. The average credit rating of individual EM countries has improved over time, but new entrants are typically from lower rated countries, including sixteen African sovereign issuers over the last decade. This has contributed to keeping the average rating relatively stable over time.
Performance
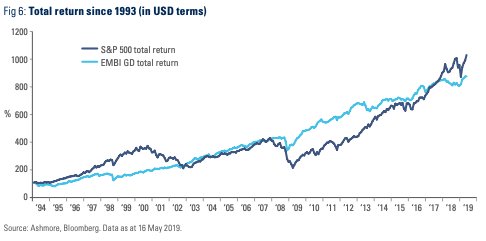
It will likely surprise investors to note that, over the long term, EM external debt delivers roughly the same return as S&P 500 (including dividends), although over long periods EM external debt has actually outperformed US stocks and is likely to do so again in the future (Figure 6). The average annual return for EM external debt since inception of the EMBI GD in 1993 is 9% compared to 10% for the S&P 500, including dividends.
Volatility
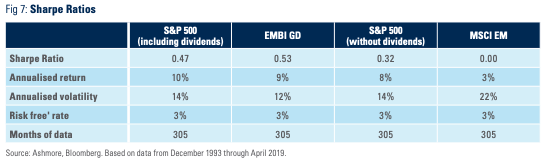
The annualised volatility of EM external debt has been 12% compared to 14% for US stocks. Hence, the Sharpe Ratio for EM external debt is better than for US stocks (0.53 versus 0.47). The main reason why EM external debt has performed so well over time is that yields are too high. The too-high yields reflect systematic under-investment in the asset class by institutional investors, who appear reluctant to mix so-called risk-free developed market bonds with allegedly default-prone EM bonds. For example, most institutional investors have far less invested in EM bonds than in EM stocks, despite the fact that the average annual return of the former is literally three times higher over the last 25 years (Figure 7).
Risk
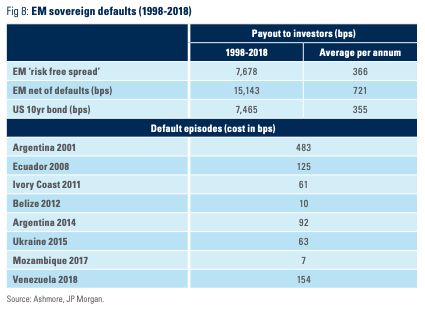
Risk, as an experience of a large permanent loss, exists in all markets. EM sovereigns occasionally default and, in the legal sense, certainly do so more often than developed economies.3 However, sophisticated investors recognise that it is not default per se, which matters. Rather, it is the return and volatility after taking into account of default-related losses. EM sovereigns have defaulted eight times since 1998 (Figure 8). The combined loss from these defaults is 995 bps or approximately 47 bps per annum over the full period. This compares with an average spread over Treasury of circa 413 bps since 1998 (before subtracting default-related losses). In other words, the loss given default in the asset class is roughly one tenth of the compensation for credit risk. Specifically, investors in EM external debt have been paid 15,143 bps net of defaults over this period compared to the cumulative yield on 10 year Treasuries over the same period of 7,465 bps.4 The cumulative spread over Treasuries of 7,678 bps over the past 20 years is equivalent to 366 bps per annum. Such a large risk-free spread naturally translates into truly extraordinary compounded returns over time, provided investors remain invested.
Behaviour during bouts of volatility
Sadly, investors often lose conviction in the asset class during bouts of global risk aversion. Ironically, volatility is mostly caused by investors’ own fickleness. In general, the EM asset classes are characterised by volatility well in excess of large permanent loss, or defaults. As such, in our opinion, it is almost always wrong to sell in response to risk aversion events (just as one should not get sucked into late cycle rallies). Given the solid long-term returns, it pays simply to remain invested, almost regardless of the short-term volatility.
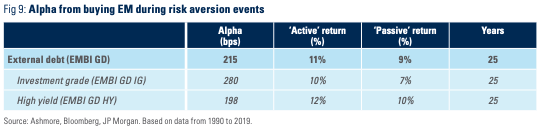
Still, to the extent investors wish to play the timing game, past experience strongly suggests that the best time to buy is during bouts of weakness. Figure 9 compares 12-month returns following spikes in global risk aversion (as measured by 10 point moves in the VIX index) with simple passive investing. Based on 25 years of data covering sixteen individual episodes of global risk aversion, investors in EM external debt would, on average, have been able to increase their 12-month returns by 215 bps by buying into the asset class during VIX spikes. This breaks down into 280 bps for investment grade bonds and 198 bps for sub-investment grade bonds, the latter recovering marginally less over the relative short 12-month period than the former.
US Treasury yield sensitivity
EM external debt trades at a spread over Treasuries. The spread is a function of the perceived ability and willingness of individual countries to pay, which changes with each country’s economic and political circumstances. Shifts in the US Treasury curve account for the rest of the performance. Historically, investors in EM external debt have been risk averse, preferring to price in the expected US rate hiking cycle well before they have taken place. This usually gives rise to a peculiar set of performance characteristics, including underperformance prior to the start of the Fed rate hiking cycle and material outperformance as soon as the hikes actually begin. The most recent Fed hiking cycle is an excellent case in point. Since the Fed hiked for the first time in December 2015, EM external debt has outperformed developed bond markets dramatically with a total return of 21.75% over thirteen quarters compared to 5.2% return for US 5-year Treasury bonds and 7.0% return for US 10-year bonds. Similar trading patterns were evident the two earlier Fed hiking cycles.
Distortions
The current Fed hiking cycle may be different from past hiking cycles in that rate hikes are now just one of the tools employed by the Fed. The other tool, bond purchases, or Quantitative Easing (QE), had major implication for global asset allocation, thereby creating large distortions in valuations between developed and EM government bonds. Subsidised by central banks, developed markets bonds racked up spectacular capital gains during the QE period. Many institutional investors responded by reducing exposure to EM bonds, which, after all, only offered yield.
The QE distortions are now slowly reversing, but they remain substantial. This can be seen in Figure 10, which shows the terminal Fed funds rates implied by the current level of yields in EM and developed bond markets, based on the relationship between yields and the terminal Fed funds rate at previous peaks in the Fed funds rate.
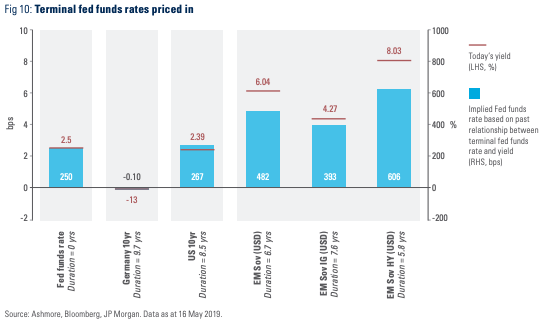
EM bonds already price in a very hawkish Fed
The main conclusion from Figure 10 is that EM bonds are currently pricing in far more Fed hawkishness than what is priced into either German or US bond markets. Current yields in EM imply a terminal fed funds rate between 393 bps and 608 bps, depending on the choice of credit rating in EM bonds. The Fed Funds rate, meanwhile, is a mere 250 bps and the US Treasury market only prices in a terminal Fed funds rate marginally higher at 269 bps. Credit conditions remains healthy in EM, so credit stress does not explain the high EM yields.5 Investors should therefore not be overly concerned about rate hikes, because they are already priced into external debt, rather generously, in fact. If the Fed does indeed end the hiking cycle close to current levels, then EM bond yields could decline significantly from current levels. For investors, this holds the promise of capital gains as well as higher overall yields than what is on offer in developed bond markets.
Outlook
The long-term outlook for EM external debt is positive due to structural tailwinds, such as economic convergence, financial deepening and broadening as well as continuing diversification as more and more EM countries join global financial markets. In the near term, the outlook is supported mainly by three factors:
1. Technicals:
We estimate that US pension funds only have one third of the allocation to EM fixed income compared to their allocation before the onset of QE. The low allocations are the product of gross distortions in global asset allocation, which took place during the QE years. We estimate that it will take years for global asset allocation to return to long-term equilibrium during which time flows should favour EM.
2. Valuations:
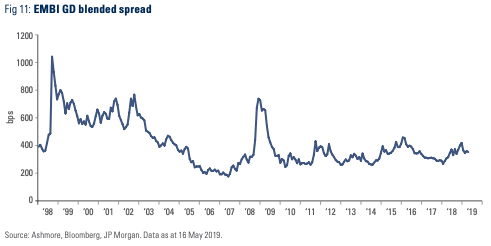
Light positioning only matters to the extent that there is return on offer. Returns depend on valuations. As mentioned above, EM external debt already prices in a significantly higher Fed funds than the Fed is likely to deliver. As for spreads, they are generous by historical standards. With the EMBI GD yield currently above 6%, the asset class trades at a spread over Treasuries of 356 bps (Figure 11). This compares to a pre-Crisis low spread of 165 bps (2006) and a post-Crisis low spread of 239 bps (2010). The current EMBI GD IG spread is over 100 bps higher than the post-crisis lows. Of course, a comparison with past spreads ignores the fact that the asset class has doubled in size and the number of countries in the EMBI GD has doubled in ten years, both of which are positives from an investment perspective. There will undoubtedly be opportunities to add at even more attractive spreads during the inevitable bouts of risk aversion, but even without those, today’s spread looks attractive in its own right.
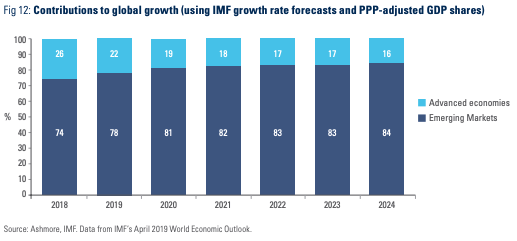
3. Fundamentals: The IMF recently downgraded its forecast for global growth, but almost all the decline emanates from developed countries. Based on the IMF’s growth forecasts and GDP weights in PPP-adjusted terms, some 84% of all growth in the world will come from EM by 2024 (Figure 12). The IMF generally shies away from making bullish growth forecasts for EM countries. Even so, the IMF expects real GDP growth in EM countries as a group to accelerate from 4.5% in 2018 to 4.9% by 2024 in sharp contrast with the growth rate in developed countries, which, according to the IMF, will slow to just 1.6% in 2024 from 2.2% in 2018. The IMF expects US growth to slow to 1.5% by 2024 from 2.9% in 2018. This should keep Treasury yields low. The solid growth rates in EM should be credit supportive, since stronger absolute and relative growth is, all else being even, associated with better tax collection, lower government spending, improving fiscal balances and stable government debt to GDP ratios.
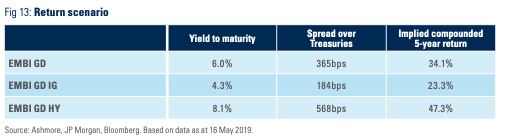
Returns
Despite the constant improvements in credit and market fundamentals across the EM investment universe, EM bonds remain one of the most volatile asset classes in world. Even minor shifts in global market sentiment send ripples through EM bond markets, mainly because of investor behaviour. It is therefore impossible to make rock-solid forecasts about returns, especially in the short-term. However, one way to think about potential return is to assume that the market does not rally at all over the next five years. In that case, yields stay flat on average and investors, who remain fully invested over the full period, should expect to receive the compounded return. Figure 13 illustrates the compounded returns over five years based on current yields for the EMBI GD as well as the investment grade and high yield sub-indices. A decline in yields would generate additional capital gain. Active management typically generates considerable alpha in the asset class, so the return scenario in Figure 13 should be regarded as conservative, in our view.
Risks
EM economies have already weathered the top five risks on most people’s list of shocks which could potentially derail the asset class. Commodity prices halved in 2014. By late 2015, EM bonds had priced in more than a full normalisation of the Fed funds rate to pre-Crisis levels. Investors withdrew about one third of their investments and the Dollar surged by 50% versus EM currencies during the height of the QE era. Finally, EM weathered last year’s Trade War without major casualties and should weather its second iteration in similar style.
Still, risks will keep coming. We currently see three major risks facing investors in EM external debt:
1. Volatility from developed economies:
Global volatility levels should generally rise as the economic challenges mount in developed economies. Developed economies have benefitted hugely from ten years of QE to help their economies recover and produce spectacular returns in their financial markets, notably in US stocks and European bonds. These markets can now be expected to disappoint going forward. Income inequality has reached worrisome levels. A cocktail of weaker economic and financial market performance alongside high levels of discontentment points to greater pressures on politicians, who will almost certainly react with more economic populism. Investors should expect more trade wars, more Brexit, more Yellow Vests, more Italian-style populism, etc. Investors should ruthlessly exploit any resulting knee-jerk bouts of risk aversion to add to exposures in EM. After all, these are primarily developed market problems, not EM problems. EM also has populism, but the key difference is that the risks are usually priced in.
2. EM-specific risks:
It is very likely that at least two or three EM countries will continue to screw up every year. This is entirely normal. Idiosyncratic risks of this kind are best managed with active management. It is worth remembering that there are now more than 150 fixed income markets formally represented in EM bond indices, including the 73 external debt markets. In such a large and diverse investment universe, problems in a small number of individual countries should not pose systematic risks and therefore do not certainly warrant changes in broad exposure to the asset class as a whole.
3. US macroeconomic risks:
The final set of risks pertain to the outlook for the United States. The United States is special, because most EM external debt trades as a spread over the US Treasury market. Hence, economic, political and policy developments in the US matter far more than equivalent developments in, say, Japan, the Eurozone or Australia. Markets currently expect the US economy to slow without imminent recession, which should enable the Fed to wind down its hiking cycle. This should be benign for EM external debt. Against this base case, there are two main risks: recession and unexpectedly strong growth caused, say, by a surge in productivity growth.
a) US recession: A recession would be put strong downwards pressure on US Treasury yields. The Fed would cut 250 bps. The room for additional fiscal stimulus would be limited, partly because the debt stock is already large, partly because Congress recently cut taxes near the top of the business cycle and partly because the House of Representatives is now controlled by the Democrats. A return to QE would therefore be likely. QE would not have the same effect as last time, in our view, because the economy is near full employment and stock prices are already very high. A lower Dollar is the most likely implication. A lower Dollar would undermine the value of EM external debt investments from the perspective of non-Dollar-based investors and the purchasing power for Dollar-based investors. The net effect therefore depends on the relative contributions to return from lower Treasury yields and the lower Dollar. As for EM spreads in a US recession, they would almost certainly widen out temporarily on the news of a US recession, but investors would soon return from the panic stations to position in accordance with the longer-term outlook, which should clearly be better in non-recession EM than in a recession-afflicted US.
b) US productivity miracle: A remote but potentially more serious risk to EM investors is a productivity miracle in the United States. Strong sustained US growth would make US stocks extremely attractive again, resulting in more demand for Dollars and outflows from EM local markets. As financial conditions tighten in EM, growth will slow with negative implications for credit quality. The Fed would also hike, although the US yield curve could bear-flatten as a result if strong supply-side growth helps to deliver a low-inflation/high growth scenario. Investors in EM external debt should expect tail winds from being invested in Dollar-denominated securities, net losses from marginal deterioration in EM credit conditions and ambiguity from changes in the curve shape in the US Treasury market.

No part of this article may be reproduced in any form, or referred to in any other publication, without the written permission of Ashmore Investment Management Limited © 2019.
Important information: This document is issued by Ashmore Investment Management Limited (‘Ashmore’) which is authorised and regulated by the UK Financial Conduct Authority and which is also, registered under the U.S. Investment Advisors Act. The information and any opinions contained in this document have been compiled in good faith, but no representation or warranty, express or implied, is made as to their accuracy, completeness or correctness. Save to the extent (if any) that exclusion of liability is prohibited by any applicable law or regulation, Ashmore and its respective officers, employees, representatives and agents expressly advise that they shall not be liable in any respect whatsoever for any loss or damage, whether direct, indirect, consequential or otherwise however arising (whether in negligence or otherwise) out of or in connection with the contents of or any omissions from this document. This document does not constitute an offer to sell, purchase, subscribe for or otherwise invest in units or shares of any Fund referred to in this document. The value of any investment in any such Fund may fall as well as rise and investors may not get back the amount originally invested. Past performance is not a reliable indicator of future results. All prospective investors must obtain a copy of the final Scheme Particulars or (if applicable) other offering document relating to the relevant Fund prior to making any decision to invest in any such Fund. This document does not constitute and may not be relied upon as constituting any form of investment advice and prospective investors are advised to ensure that they obtain appropriate independent professional advice before making any investment in any such Fund. Funds are distributed in the United States by Ashmore Investment Management (US) Corporation, a registered broker-dealer and member of FINRA and SIPC.