The establishment of local bond markets has been the single most important structural change in Emerging Markets (EM) in the past quarter of a century. Many investors still fear local markets due to FX volatility, but EM local bonds have performed better overall than US Treasuries and US stocks. This report examines the case for EM local currency bonds starting with a brief history of the asset class. We then examine the size and composition of the market before discussing the issuers, index challenges, the special role of China, credit ratings, performance characteristics and, of course, risks.
A brief history of EM local currency debt
Before they had local bond markets, EM countries would get cut off from funding whenever foreign investors turned tail. At best, this led to severe under-investment. At worst, EM governments, unable to borrow, would be forced to print money to finance spending. Money printing is inflationary, so currencies soon weakened, triggering capital flight, loss of reserves and eventually default on external liabilities.
Labelled ‘reflexivity’ by George Soros, this destructive dynamic, whereby shifting sentiment among foreign investors could unleash real economic crises in EM countries, was rooted in the absence of a permanent source of domestic financing, i.e. a local bond market. Moreover, since most EM countries lacked domestic bond markets it followed that every time one country experienced reflexivity the problem quickly and easily spread to other countries, a process known as ‘contagion’.
The modern day local currency bond markets in EM were established specifically to overcome the twin challenges of reflexivity and contagion risk. Mexico led the way. Following the trauma of the Tesobono Crisis of 1994, the government realised the desirability of issuing in local currency and establishing a domestic institutional investor base and began to build what has since become one of the most sophisticated domestic bond markets in the whole of EM. The Asian Crises of 1997 gave further impetus to the establishment of local bond markets by illustrating to many EM countries the dangers of relying on the IMF as a funder of last resort.
Today, most established EM countries have become overwhelmingly self-reliant in terms of financing. Local markets now provide 87% of all financing in EM (90% of government funding and 80% of corporate funding).1 The establishment of local markets has been the single most important structural change in the modern history of EM bond markets. The ability to source funding at home has significantly weakened the erstwhile link between economic performance and foreign investor sentiment. Reflexivity now only rears its ugly head in the few EM economies, which have not yet established well-functioning local institutional investor bases, such as Turkey and Argentina. It is due to the existence of local markets that EM was able to weather major global crises such as 2008/2009 and the European sovereign debt crisis. Indeed, EM has not experienced conventional contagion since 1998, nor is it likely to experience it again.
By 2006, many EM countries had established local yield curves for investment bank JP Morgan to launch the GBI EM GD index, which has since become the most commonly used benchmark index for local bond markets. There are currently nineteen countries in the index.
Size
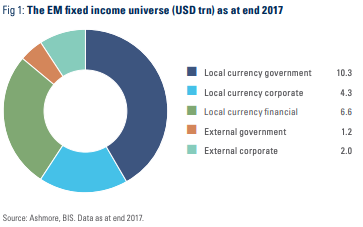
As of the end of 2017, the EM local currency bond market measured USD 21.1trn, or 87% of the overall EM fixed income universe of USD 24.3trn (Figure 1). In economic terms, this translates into 67% of EM GDP. With EM bonds making up roughly 22% of the global bond market, it follows that EM local currency bonds today account for a sizeable 19% of global fixed income.2
EM local currency bonds comprise roughly equal-sized volumes of sovereign and corporate bonds issued in their home currencies. At USD 10.9trn, or 44.6% of the EM fixed income universe, the local corporate bond market is the single largest segment of EM fixed income, while local government bonds make up the second largest segment at USD 10.3trn (42% of EM fixed income). This means that EM local corporate bonds account for roughly one tenth of all bonds in the world, while EM local currency government bonds make up 9% of the global bond market.
Trends
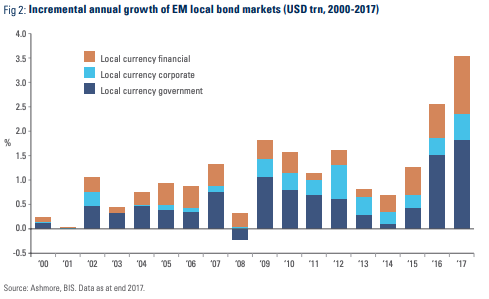
Since 2000, EM local markets have grown at a median rate of 20% in Dollar terms. Corporate and government bond markets have grown at roughly the same speeds (19% and 20%, respectively). This underlines the mainly structural factors behind the growth of the asset class, such as GDP growth, the establishment of pension funds, young demographics, etc. On a year-by-year basis, the growth rate of the asset class in Dollar terms varies considerably, between 2% and 33% per annum, which is mainly due to shifts in EM exchange rates.
Given the high rate of growth of the asset class, the EM local bond market continues to expand in ever-larger absolute increments each year as shown in Figure 2. The fastest growing segment is corporate debt, where financials (mainly banks) account for roughly 60% of net new issuance with the balance due to issuance by non-financial corporates (various industries).
Regional issuance
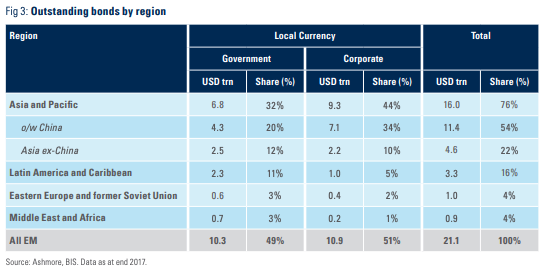
More than three quarters of all EM local currency debt (76%) has been issued by Asian governments and corporates (Figure 3). Chinese issuers alone account for more than half (54%) of all outstanding securities. Latin America is the second largest region in terms of issuance with a 16% market share followed by the Middle East & Africa and Eastern Europe, which, between them, account for the remaining 8% of the outstanding bonds.
Asia also distinguishes itself from other regions by issuing more corporate debt relative to government debt. Some 58% of all outstanding bonds in Asia are corporate issues compared to 41% in Eastern Europe, 31% in Latin America, and 21% in the Middle East & Africa. This is a reflection of Asia’s history of better policy management, constant attention to structural reforms and commitment to developing domestic financial markets.3
The largest issuers
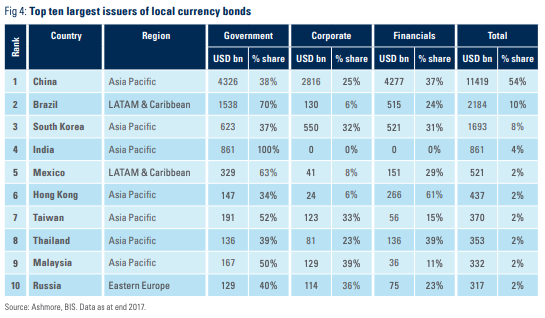
EM local currency bond markets are top heavy in the sense that the top ten largest issuers account for 87% of all outstanding bonds (Figure 4). Seven of the top ten issuers are in Asia, but Brazil and Mexico are also very important markets, while Russia is the largest issuer in Eastern Europe. It is notable that only five of the largest ten issuers are represented within the GBI EM GD, the main benchmark index for local currency bonds. China and India require investors to apply for quotas, which excludes them from the index, while Taiwan, South Korea and Hong Kong are deemed too be too wealthy to be included in the index. We will discuss index issues further in the next section.
Benchmark indices
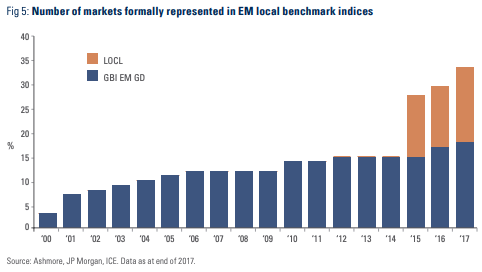
As mentioned above, JP Morgan’s GBI EM GD with a market cap of USD 1.2trn as of 1 July 2019, is the main benchmark index for EM local currency government bonds. The GBI EM GD is a so-called diversified index, meaning that the weight of the largest issuers are capped 10% of total eligible securities. ICE, another index provider, manages LOCL, the so-far only benchmark index for local currency corporates. JP Morgan also provides a benchmark index for 23 EM currency forward markets called the ELMI+.
It is fair to say that index representation in EM local markets is somewhat deficient, albeit steadily improving. Some 34 individual local markets are now formally represented within the GBI EM GD and LOCL compared to just three markets in 2000. The launch of the LOCL in 2015 has contributed to significantly better index coverage (Figure 5). However, there is still a long way to go until EM’s local markets will be properly represented within benchmark indices. For example, the GBI EM GD only covers about 9% of the outstanding universe of local government bonds (as of end 2017). There are just 19 EM countries in the GBI EM GD, while more than 30 EM countries register their domestic bond markets each year with the Bank of International Settlements. One of the unfortunate consequence of including so few countries in the benchmarks is that index huggers are forced into relatively few markets, which can lead to crowded positions in some markets. The long end of yield curves in Mexico and Indonesia have been particularly prone to this problem. Meanwhile, other large bond markets, such as India and China attract far too little money, because they are not included in indices yet.
As for local corporate bonds, the LOCL only has bonds from 16 countries and only includes off-shore euroclearable securities. This is a tiny (2%) part of the local corporate bond universe, so, to all intents and purposes, there is still no proper local currency corporate bond market index in existence. Investment banks are poorly placed to provide local market indices, because they tend to only cover countries where they are active market makers. International Financial Institutions, such as the World Bank or IFC, really ought to provide comprehensive local indices, but the Great and the Good in these venerable institutions appear to be completely oblivious to the problem.4
Looking ahead, it is likely that index representation will improve. The number of markets represented in local indices will rise for the simple reason that there are roughly 165 EM countries and all of them will eventually develop local bond markets. China’s imminent inclusion in the GBI EM GD will be a particularly important milestone, in our view.
The special role of China in local bonds markets
The stars are finally aligning for the inclusion of Chinese government bond in both the EM local bond index and in the two major global bond benchmarks, the Bloomberg Aggregate (Bloomberg Ag) and FTSE’s World Government Bond Index (WGBI).5 A total of USD 500bn is expected to flow into Chinese bonds over the next five years due to bond index inclusion alone, but this is only the beginning of the story. Based on realistic expectations for economic growth, financial market developments and population growth, the Chinese bond market will outgrow the US bond market by a factor of two to three times by 2050. This means that Chinese markets will become far more liquid than US markets, making them preferable as global benchmarks for fixed income. We expect investors eventually to have 30% in China and not the 3% that they have today.6
The inclusion of Chinese bonds in EM bond indices will be a game changer, in our view. A combination of lower volatility, low correlations with other EM bonds and attractive yields means that Chinese bonds can act as an intra-EM safe haven destination, which in our opinion, can even be superior to US Treasury bonds in terms of performance during bouts of risk aversion. This is clearly important, because if investors can do better by allocating to China within their EM portfolios than to redeem outright, EM markets as a whole will become less volatile. We believe this should make EM local markets far more attractive to long-term institutional investors as well.7
Credit ratings
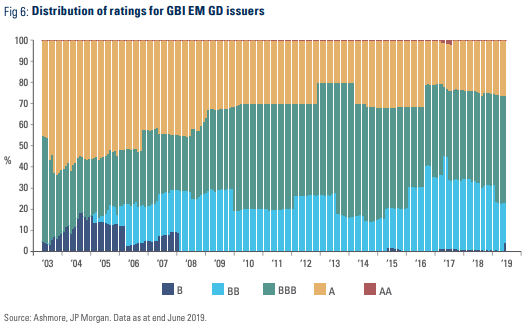
JP Morgan calculates the overall credit quality of the GBI EM GD based on the lowest long-term local currency sovereign credit rating for each issuer from the three main rating agencies, Fitch, Moody’s and S&P. Ratings are at country-level, not at bond level, and the ratings of local rating agencies are ignored, mainly to ensure cross-country comparisons. As of June 2019, the average credit rating of the GBI EM GD was thus investment grade (BBB) with Fitch at BBB, Moody’s at Baa2 and S&P at BBB+.
Figure 6 shows how the credit ratings for the GBI EM GD have changed over time. On average, the GBI EM GD has always been Investment Grade (IG), even during major developed market crises, such as 2008/2009 as well as during significant EM headwinds, such as the 2013 Taper Tantrum and the collapse in commodity prices in 2014. This underlines a basic general observation about EM local markets: fundamentals are far more resilient than prices. Digging further, single ‘B’ issuers have declined relative to the early years of the index, the share of ‘BB’ issuers has increased to about 20% from nothing, while the ‘BBB’ segment has been relatively stable. The ‘A’ segment has shrunk and ‘AA’ credits have only made a small appearance between 2011 and 2018.
Performance
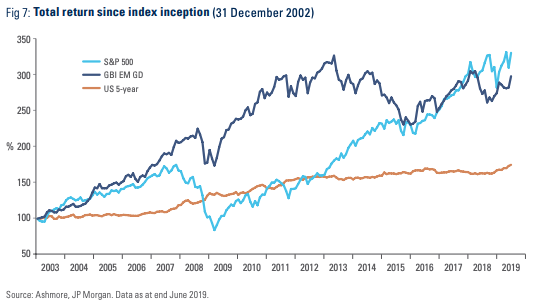
Local currency government bonds have returned roughly the same as the S&P 500 (excluding dividends) since January 2003 (Figure 7).8 At 7% annualised, returns in Dollar terms for EM local bonds have been vastly superior to US 5-year Treasuries (3%) with similar duration. Volatility in EM local bonds has been 12% annualised over the period compared to 14% for the S&P 500 and 4% for 5-year US Treasuries. Hence, the GBI EM GD has displayed a marginally superior Sharpe Ratio of 0.44 compared to S&P 500 and 5-year Treasuries (both 0.43).
Risks
EM local investors face default, inflation and currency risks in addition to temporary risks such as illiquidity and political noise. We examine these risks in the following section.
• Default: Default is not a serious risk in EM local currency government bond markets, in our opinion, where there has only been one default in the modern era, namely Russia in 1998. Just like local bond markets in developed economies, the main risks are inflation and currency debasement.9
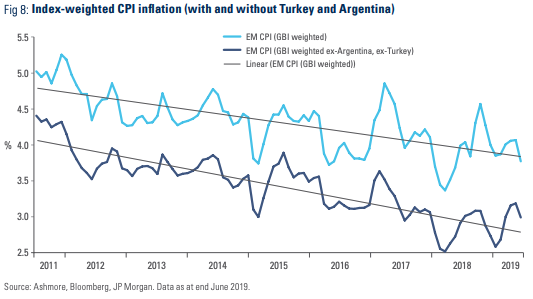
• Inflation: With respect to inflation, the EM story is extremely strong. Figure 8 shows that GBI EM GD-weighted inflation has declined from 5.2% in 2011 to less than 4% as of June 2019. Index-weighted inflation obviously includes EM’s two high-inflation local issuers, Turkey and Argentina. When these two outliers are excluded from the index, inflation is actually now below 3%. The decline in inflation in EM over the past decade ought to raise eyebrows, because it flies in the face of the widely held perception that currency weakness begets inflation. EM currencies have fallen about 50% versus the Dollar since 2011, so, clearly, pass-through from weaker FX to CPI inflation in EM is a myth.10
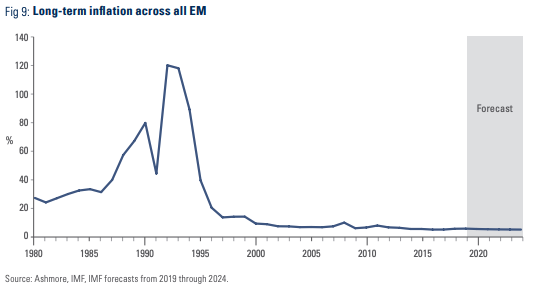
Low inflation is not just a feature of the countries in the GBI EM GD. Figure 9 shows the long-term history of CPI inflation for all EM countries using IMF data from the April 2019 World Economic Outlook. EM inflation was basically a problem in the Cold War and the immediate post-Cold War eras. Radically different political incentives in the post-Cold War period have encouraged governments to fight inflation. The IMF expects low inflation to persist in EM for at least the next five years.
• Currency debasement: Many investors account for performance in Dollars, so currency is a particularly important part of the risk assessment. EM currencies have basically experienced three distinct phases since inception of the index (Figure 10).
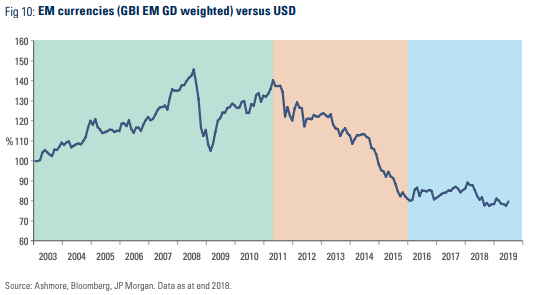
During Phase 1 from 2002 to 2008/2009, EM currencies rallied 30% against the Dollar due to a combination of strong relative EM growth, inclusion of local markets in benchmark indices, high commodity prices and appetite among institutional investors to include local bonds into their portfolios.
In Phase 2 from 2011 to 2015, EM currencies declined 50% as investors withdrew from yield in EM in order to harvest extra-ordinary capital gains in US equity markets, which surged on the back of economic recovery, zero interest rate policies, Quantitative Easing and massive fiscal stimulus.
Finally, since early 2016, Phase 3, EM currencies have been range bound as relative value, technical and fundamentals have gradually begun to favour EM again. There may well be more to come. Developed markets have not yet become sufficiently unappealing for investors to abandon them altogether, but this may just be a question of time. Indeed, we expect the next phase for EM currencies will involve outright rallies as a result of having been oversold in Phase 2.
• Other risks: A myriad of other factors impact performance in EM local markets in the short term. These include changes in monetary policy, technical factors, such as index changes, capital controls, geopolitical risks and various macroeconomic shocks as well as political noise. Liquidity is always an important consideration. EM local bonds tend to be less liquid than bonds in developed markets, because there are fewer market-makers and fewer institutional investors. The greater participation of foreign investors, as a percentage of total outstanding, relative to what you normally see in developed markets can also impart greater volatility. Still, in general, liquidity is far better in EM local markets than in EM Dollar-denominated bonds. Finally, we note that most local bonds are issued under local law and only a small subset clear via Euroclear or Clearstream.
Bond market valuations
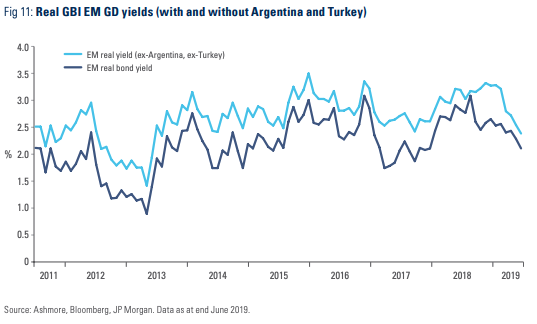
The index-weighted yield in the local currency government bond market has declined from a peak of 7.25% in early 2016 to 5.6% by July 2019. However, inflation has also fallen over this period, so real yields have remained range-bound (Figure 11). In other words, the value proposition remains strong despite the solid return of 28% in Dollar terms over the last three and half years.
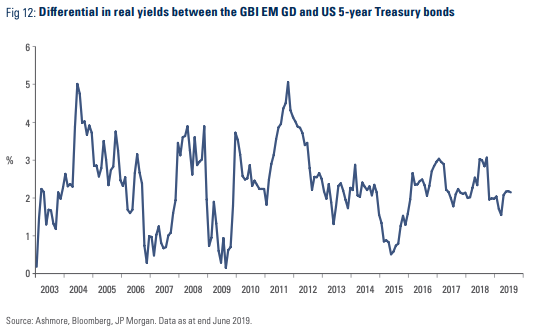
Real yield differentials have also been stable versus US bonds during the entire Fed hiking cycle as shown in Figure 12. As the Fed now looks set to start the cutting cycle, EM bonds look particularly attractive in relative terms.
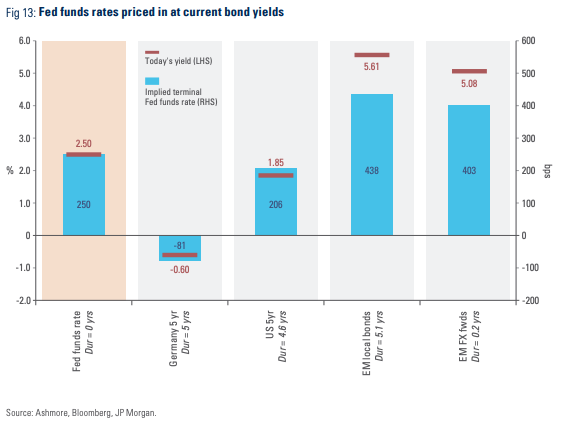
Finally, we note that valuations in EM bond markets look highly distorted to begin with. Figure 13 shows the current yield to maturity for EM local currency bonds and the Fed funds rate historically associated with this yield to maturity. EM local currency bond yields are currently consistent with a Fed funds rate of 438bps, which seems excessive given that the Fed is only at 250bps and may be about to start to cut rates. The origin of this distortion in bond yields is the enormous misallocation of global capital, which took place in response to Quantitative Easing in developed economies. The technical position in EM is therefore strong. In fact, we believe that foreigners so far only put back one third of the money they took out of EM during Quantitative Easing.
Currency valuations
Investors do not feel strongly compelled to leave the Dollar zone in favour of other currencies, but there are compelling reasons to begin to diversify away from the Dollar. We estimate that the Dollar is about 20% overvalued versus EM currencies, based on real effective exchange rates, forward-looking growth differentials and in the value of the Dollar relative to US productivity growth.11 The Dollar was able to assume dizzying heights in real and nominal terms over the past eight years, because investors went long the Dollar in order to participate in the US equity market rally. As the US recovery matures, we expect investors to gradually reduce their Dollar exposure in favour of other currencies and a few crumbs should go to EM currencies from the big table.
Returns
It is 100% certain that any forecast about returns in EM bond markets will be wrong. However, it is possible to get a ballpark estimate of potential returns by making a few basic assumptions. For example, if EM bond yields and EM currencies remain stable at current levels over the next five years then bonds will return 31% in Dollar terms (compounded). If, in addition, EM currencies recover some of their dramatic losses from the Quantitative Easing period, Dollar-returns will obviously be larger. Our view is that EM currencies should recover about 20% over a five-year period in which case the total return for EM local bonds in Dollar terms will be about 50%. We do not see any other Investment Grade (IG) government bonds with five years of duration anywhere else in the world, which can beat this.
The big US-related risks
From a risk perspective, the US matters far more than Europe for EM investors. This is because most EM currencies trade versus the Dollar, not the Euro. Moreover, the Dollar is the main unit of account for many investors, who generally do not worry too much about loss of purchasing power (i.e. they are oblivious to the implicit losses arising from a lower Dollar). Our base case is that the US slowly decelerates, but is able to postpone, for some time, recession by easing monetary policies and enjoying the tail-end of fiscal stimulus from the December 2017 Trump tax cut. This outlook should be consistent with a gradually declining Dollar amidst relative financial stability.
The two main risk scenarios around this base case are recession and a US growth miracle. A recession would create short-term volatility, but the panic would soon give way to more rational investment decisions. Since most of the money that went into the US over the last decade did so predicated on a bullish view of the US economy, it is in the wrong place and will leave. Recession kills earnings, so stock prices must come down and the Fed will cut rates, which erodes the interest argument for holding Dollars. There is little scope for fiscal easing due to Democrat control of the House. Since 250bps of rate cuts is not enough to extract the US from recession, the Fed must therefore re-engage in Quantitative Easing. This was bad for EM last time, but this time may well be different, because the economy is operating near potential and stocks prices are already too high. The most likely effect of Quantitative Easing Version 2.0 will therefore be to push down the Dollar, just like the resumption of Quantitative Easing under ‘Abenomics’ in Japan pushed down the Japanese Yen.
The biggest risk for EM is actually a very strong US economy. A sudden surge in productivity growth, which puts the US economy onto a 4% real GDP growth trajectory, would in our view make investors very comfortable with their existing exposure to Dollars and US stocks and encourage even more money to flow to the US. The Fed would also hike further and earnings would rise to usher in another surge in US stocks. A very strong US economy could therefore easily trigger another ‘taper tantrum’ type sell-off in EM assets, with resulting outflows and associated financial tightening and slower growth.
1 The end of the Cold War was critical to the establishment of pension systems across EM. The emergence of domestic political accountability ushered in better macroeconomic policies, which in turn made local populations more inclined to save in their own currencies instead of funnelling money overseas.
2 Based on data from Bank of International Settlements. 2017 is the last year of full-year data from the BIS. The remaining 13% of the EM fixed income universe comprises Dollar-denominated sovereign bonds (roughly USD 1.1trn) and Dollar-denominated corporate bonds (roughly USD 2.2trn), as of end 2017. For a recent discussion of the EM Dollar-denominated sovereign bond asset class see: ‘The case for EM external debt’, The Emerging View, 23 May 2019.
3 For example, the government of Thailand has no outstanding external debt; the government only borrows in local currency
4 For a discussion of this problem, see ‘Passive is active: the EM index problem’, The Emerging View, 11 July 2017.
5 In fact, Bloomberg began to include Chinese government bonds in April 2019.
6 To see why Chinese bonds are attractive relative to developed market bonds, see: ‘Chinese bonds in Developed Markets bond portfolios’, The Emerging View, 18 May 2018.
7 For more details, see: ‘How Chinese bonds can enhance your portfolio’, The Emerging View, 16 March 2018.
8 As noted previously, the GBI EM GD index was formally launched in January 2006, but the index provider back-populated the index for three years, so index history goes back to early 2003.
9 In fact, local investors should also care about currency debasement, because the purchasing power of any portfolio denominated in a weakening currency will decline, thereby reducing the ability to buy imports.
10 We have made this point repeatedly in many places. For example, see: https://www.ft.com/content/a52e621e-3407-11e7-99bd-13beb0903fa3
11 For more details, see: ‘The 2019-2023 EM fixed income outlook’, The Emerging View, 6 December 2018.

No part of this article may be reproduced in any form, or referred to in any other publication, without the written permission of Ashmore Investment Management Limited © 2019. Important information: This document is issued by Ashmore Investment Management Limited (‘Ashmore’) which is authorised and regulated by the UK Financial Conduct Authority and which is also, registered under the U.S. Investment Advisors Act. The information and any opinions contained in this document have been compiled in good faith, but no representation or warranty, express or implied, is made as to their accuracy, completeness or correctness. Save to the extent (if any) that exclusion of liability is prohibited by any applicable law or regulation, Ashmore and its respective officers, employees, representatives and agents expressly advise that they shall not be liable in any respect whatsoever for any loss or damage, whether direct, indirect, consequential or otherwise however arising (whether in negligence or otherwise) out of or in connection with the contents of or any omissions from this document. This document does not constitute an offer to sell, purchase, subscribe for or otherwise invest in units or shares of any Fund referred to in this document. The value of any investment in any such Fund may fall as well as rise and investors may not get back the amount originally invested. Past performance is not a reliable indicator of future results. All prospective investors must obtain a copy of the final Scheme Particulars or (if applicable) other offering document relating to the relevant Fund prior to making any decision to invest in any such Fund. This document does not constitute and may not be relied upon as constituting any form of investment advice and prospective investors are advised to ensure that they obtain appropriate independent professional advice before making any investment in any such Fund. Funds are distributed in the United States by Ashmore Investment Management (US) Corporation, a registered broker-dealer and member of FINRA and SIPC.