Welcome to the 8th annual review of the Emerging Markets (EM) fixed income asset class. Using new data from Bank of International Settlements and other sources, we establish that the EM bond market had grown to a size of USD 26.5trn, or 23% of global fixed income at the end of 2018.
About 82% of EM bonds are now denominated in local currency, the rest are mainly Dollar-denominated ‘external’ bonds. External debt is therefore a much smaller market, but it is more diversified than local markets in terms of index representation. EM government make up 45% of all EM bonds, while corporate bonds make up 55% of the total. In terms of regional splits, Asia dominates the EM fixed income market with 78% of all outstanding bonds. China alone now accounts for more than half of all outstanding EM bonds.
Going forward, on conservative projections, the EM fixed income universe should grow to at least USD 39trn by 2024 at which point it will constitute 26% of the global bond market. Index representation, though improving, remains poor overall. However, investors can still obtain great diversification if they take exposure across all the four types of fixed income markets in EM for which the main benchmark indices now cover 154 individual markets.
EM within the global bond market
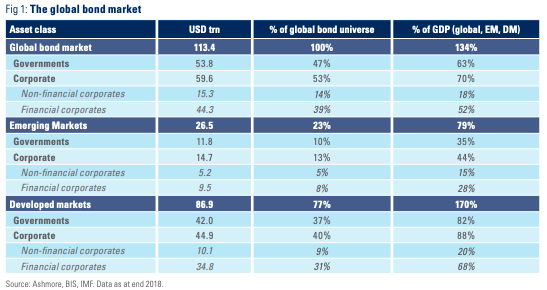
Based on data from Bank of International Settlements, the global bond market reached a size of USD 113.4trn at the end of 2018, which is equivalent to 134% of global GDP (Figure 1). This global bond market expanded by roughly USD 3trn in the past year.1 Government bonds make up USD 53.8trn while USD 59.6trn are corporate bonds, which in turn divide into USD 44.3trn of bonds issued by financial sector corporates and USD 15.3trn issued by non-financial corporates.
Issuers in developed countries account for USD 86.9trn of the global bond market, or 77% of all bonds. In economic terms, this is equivalent to 170% of the developed market GDP. EM government and corporates have issued a total of USD 26.5trn of bonds, which is equivalent to 23% of global fixed income, or 79% of EM GDP. The EM fixed income universe is split between USD 11.8trn of government bonds (45% of all EM bonds) and USD 14.7trn of corporate bonds (55% of all EM bonds). Financial sector companies issue nearly twice as many bonds (USD 9.5trn) as non-financial corporates (USD 5.2trn). In developed markets, this ratio is nearly three times.
Three dominant trends in EM fixed income
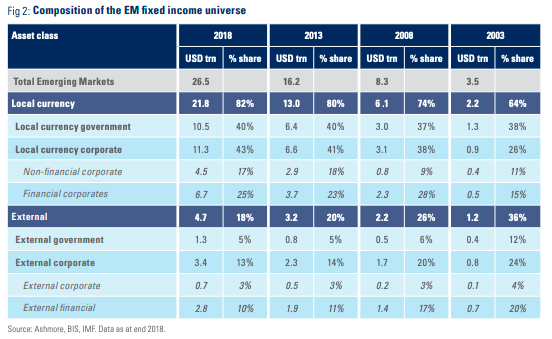
The most important trend in EM fixed income is the steady growth of local currency bond markets. At the end of 2018, the local currency bond markets in EM had grown to USD 21.8trn, making up 82% of the total EM bond market (Figure 2). In 2003, this percentage was only 64%, so the share of EM local markets rises by roughly 1% per year. EM local markets tend to grow very steadily, mainly for structural reasons. Still, local markets can give the impression of very uneven growth year by year, but this is because the size of the asset class is expressed in Dollars. The considerable volatility of the Dollar versus most other currencies in the world means that local markets appear to grow much faster in years when the Dollar falls and vice versa. If, as we expect, the Dollar weakens more precipitously versus the EM currencies in the coming years we would expect to see the local currency market grow more quickly in Dollar terms.
The second important trend in EM fixed income markets is that corporate bond markets are growing more quickly than government bond markets, especially in local currency. Local currency corporate bond markets already make up the single largest segment of EM fixed income with USD 11.3trn in outstanding bonds, or 43% of the entire EM fixed income universe. In 2003, local currency corporate bonds only measured USD 0.9trn, or 26% of all EM bonds. The local currency segment of the EM corporate bond markets comprises USD 6.7trn of bonds issued by financials and USD 4.5trn of bonds issued by non-financial corporates.
The third important trend in EM fixed income is the gradual decline in the share of external debt within the EM debt markets. EM countries issue external debt when their domestic financial systems are still rudimentary. Once local markets become more advanced, countries generally choose to rely more on domestic financing in local currency. The EM external debt universe continues to grow every year in absolute terms and through new entrants and now measures USD 4.7trn. However, due to the faster rate of growth of local currency markets external debt’s share of total EM fixed income has halved from 36% in 2003 to 18% today. Within external debt, the sovereign bond universe totals USD 1.3trn, making it the smallest segment of EM fixed income. The corporate external debt market measures USD 3.4trn, which in turn breaks into USD 2.8trn of financial sector bonds and USD 0.7trn of non-financial sector bonds.
Regional distribution
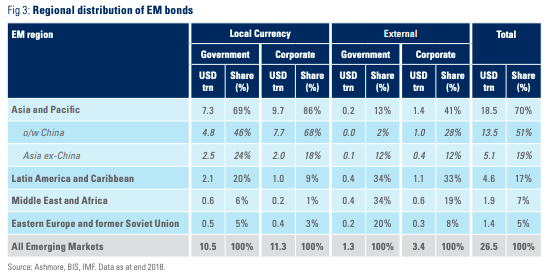
EM bonds are distributed very unevenly across regions. Asia has issued 70% of all EM bonds, including 69% of local currency government bonds and 86% of local currency corporate bonds (Figure 3). The region also accounts for 41% of external corporate bonds and 13% of external sovereign debt. Asia’s dominant role within local markets reflects the more advanced state of Asian financial markets and the region’s determined efforts to become self-financing. Latin America & Caribbean has issued 17% of outstanding EM bonds, Africa & the Middle East 7% of all bonds, and Eastern Europe & the former Soviet Union 5% of all bonds. Latin America & Caribbean and Middle East & Africa are the largest issuers of Dollar-denominated government bonds. Latin America & Caribbean and Asia jointly dominate the external corporate bond market.
The biggest issuers Viewed in isolation, the size of any bond market should bear much relation to its attractiveness. After all, from an economic perspective size only has meaning when compared to the country’s GDP, the ability of issuers to service their debt and the capacity of the economy to absorb the spending financed by the bonds. From an investment perspective, size is only meaningful to the extent that the bonds pay a decent yield relative to risks and relative to the risk-adjusted yields available on bonds in other markets. Still, there are two clear contexts in which size does matter. Firstly, index huggers and passive investors will buy anything that goes into an index, so the bigger the market the bigger the flow into the market in question. Secondly, larger markets tend, all else even, to offer more variety and may also be more liquid than smaller markets.
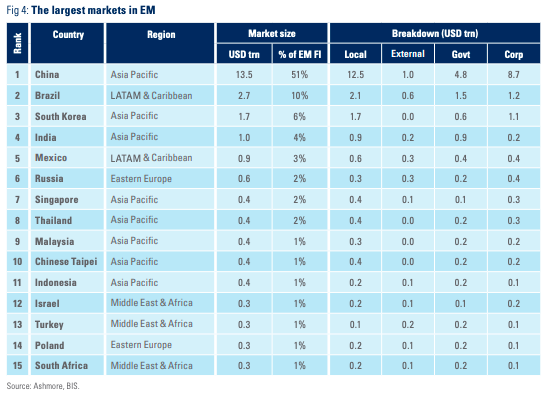
When it comes to size, China is special. Between Chinese government agencies and Chinese corporates, China’s bond market now accounts for 51% of all outstanding bonds in the whole of EM, or USD 13.5trn (Figure 4). This total breaks down into USD 12.5trn of local currency denominated securities and USD 1.0trn of external debt. The government has issued USD 4.8trn and corporates have issue USD 8.7trn.
The second largest market in EM is Brazil with USD 2.7trn out outstanding bonds. South Korea is the third largest (USD 1.7trn). India (USD 1.0trn) and Mexico (USD 0.9trn) are next. Eight of the fifteen largest EM bond markets are in Asia, while two are in Latin America. Eastern Europe & the former Soviet Union markets include Russia (USD 0.6trn) and Poland (USD 0.3trn). In the Middle East & Africa, Israel, Turkey and South Africa are the largest issuers. One of the common denominators for the biggest EM issuers is that their markets are dominated by local currency (average share of 77% of total fixed income).
Future growth
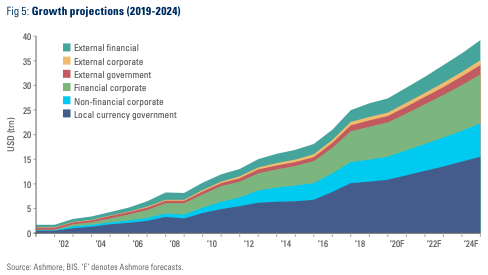
EM markets will continue to grow both in absolute terms and relative to developed markets, because EM remains severely under-financed. For example, EM government bond markets are only 35% of EM GDP on average compared to 63% in developed economies, while EM corporate bond markets are 44% of EM GDP compared to 70% of GDP in developed economies. Conservatively, we estimate that the global bond market will grow to USD 149trn by 2024, at which time the EM fixed income universe should have grown to USD 39trn, or 26% of the global bond market (Figure 5). Within this total, EM local currency bonds will account for at least USD 32.4trn.
These projections rest on the assumption that all markets will expand in line with the IMF’s projections for nominal GDP growth (in current USD terms). In reality, EM bond markets are likely to grow faster, partly because of convergence factors, meaning that financial sector development is usually faster at lower levels of per capita GDP, and partly since EM bond markets have lots of room to broaden as part of the development process (as virgin issuers join markets for the first time). Also, measured in Dollar terms, local markets may well grow materially faster in the coming years as the Dollar declines.
Index representation
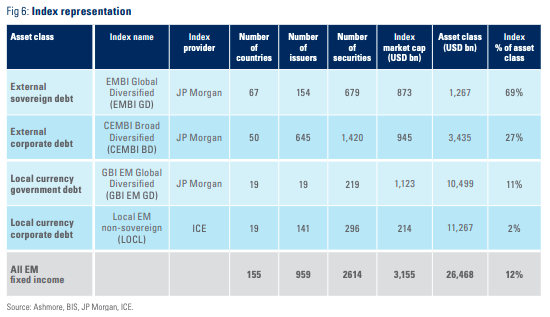
There has been some improvement in index representation for the asset class over the past year and more may be in the pipeline, but index provision remains poor in EM overall.2 As Figure 6 shows, 12% of EM fixed income is now represented in the most commonly used benchmark indices compared to 9% last year. This improvement in index coverage reflects greater investor interest in the asset class to which index providers have responded by including more countries and corporates. External debt is usually made up of Dollar-denominated bonds which are Euro-clearable and issued under New York Law. This makes them easy for banks to trade, so the number of markets included in the external debt benchmarks is far higher than the number of markets reflected in local bond indices. As at end-2018, there were 67 sovereigns in the EMBI GD, but JP Morgan has since added more countries, so that, as of June 2019, there are 73 countries in the EMBI GD.
The main challenge from an index perspective remains local bond markets in EM, which remain very poorly represented. Only 11% of the local currency government bonds and 2% of the local corporate bonds are included in the relevant benchmark indices. China perfectly illustrates the problem. Despite being the issuer of more than half of all EM bonds on the planet, and the single largest local bond market in EM, China is still not included in JP Morgan’s GBI EM GD. Moreover, Bloomberg already deems China’s bond markets sufficiently liquid to warrant inclusion in its Aggregate Index, an index comprising mainly developed market bonds. We remain hopeful that China will soon appear in the GBI EM GD. In general, the pace of index inclusion tends to closely track the popularity of the asset class, so index inclusion should, based on our views, improve going forward. Countries, which could potentially enter the GBI EM GD in the coming months and years include Nigeria, China, Serbia, Ukraine, Kazakhstan and Egypt.
Diversification
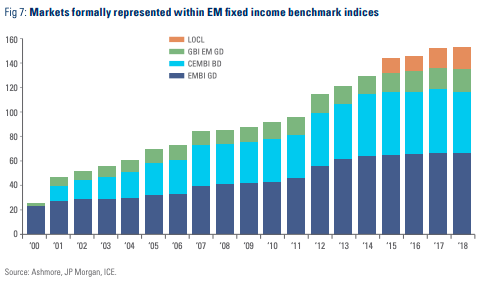
Despite poor index representation, the number of markets in the main benchmark indices continues to increase every year. One of the real attractions of the EM fixed income space is that it now offers an extremely high diversity of issuers. Specifically, 154 individual bond markets are now formally represented within the four main EM fixed income benchmarks compared to 153 last year, 147 in 2016 and just 26 at the turn of the century (Figure 7). When, sometime in the future, all EM countries have issued bonds in both domestic and external bond markets and all these bonds have made it into benchmark indices, EM will offer investors exposure to more than 600 individual markets.
Sources and methodology
The primary source of data on fixed income securities is the Bank of International Settlements (BIS). BIS obtains data from central banks, other public sources and commercial sources. BIS distinguishes between domestic and international markets based on where the securities are issued. The size of the debt market in any one country is therefore calculated as the sum of debt securities issued by residents at home (‘domestic debt securities’ in BIS terminology) and debt securities issued by non-residents within the country. A country’s bond market may be smaller than its liabilities if some of the bonds are issued in third countries, say, for tax reasons. This is particularly the case for Dollar-denominated corporate bonds in some countries. To remove any such distortions, we have allocated corporate external debt (financial and non-financial) in accordance with the weights in the JP Morgan CEMBI index, which already reassigns bonds back to the country of risk. All economic data is from IMF’s World Economic Outlook database, April 2018. All index data is from ICE and JP Morgan.
1 The global bond market measured USD 110.6trn at the end of 2017.
2 Indices are inadequate in EM because the index providers only include only the markets they trade, which in turn is an internal business decision, which may, or, as is usually the case, may not match the actual universe of investable bonds. Inadequate index coverage results in distortions in global asset allocation on a monumental scale, because most investors hug benchmark indices. Poor index coverage therefore funnels too much capital into too few countries and not enough capital into other countries. Global regulators are to blame for not recognising this market failure.
© 2019 Ashmore Investment Management Limited