Want to read more by Ashmore Group? Visit their Featured Firm page here
Welcome to the 9th annual review of the Emerging Markets (EM) fixed income asset class. Using new data from the Bank of International Settlements and other sources, we establish that the EM bond market has expanded by 12% in Dollar terms in the past twelve months to a size of USD 29.6trn, or 25% of the global fixed income universe as of the end of 2019.
Some 82% of EM bonds are denominated in local currency, unchanged from 2018. The remaining 18% of the asset class consists mainly of Dollar-denominated ‘external debt’, corporate and sovereign. While external debt is a much smaller market, it is more diversified than local debt in terms of index representation. Government bonds constitute 44% of all EM fixed income, down from 45% in 2018 as corporate bonds now make up 56% of the total EM bond market.
Asia dominates the EM fixed income market with 70% of all outstanding bonds, while China alone accounts for 52% of the entire EM bond universe. The EM bond markets are on track to reach USD 45trn by 2025, or 29% of global fixed income.
However, index representation remains inadequate with only 13% of outstanding bonds represented across all benchmark indices. Still, despite poor indices, it is entirely possible to obtain significant diversification within EM fixed income, because the main indices now cover more than 200 individual markets.
The EM fixed income universe reached a size of USD 29.6trn as of the end of 2019
The global bond market
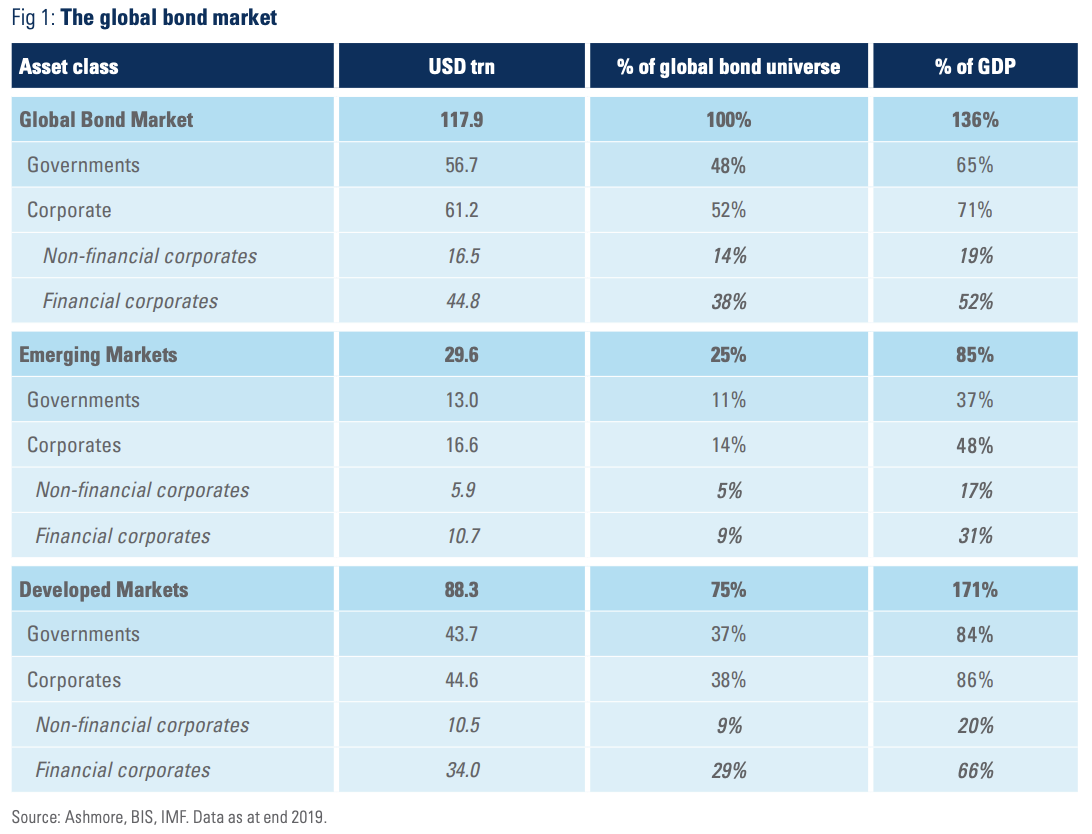
Based on data from the Bank of International Settlements, the global bond market expanded by USD 6.2trn in 2019 to reach USD 117.9trn, which is equivalent to 136% of global GDP, up from 131% of GDP as of the end of 2018 (Figure 1).1 The global bond market comprises government and corporate bonds, which respectively make up USD 56.7 and USD 61.2trn. Corporate bonds can be divided into USD 44.8trn of bonds issued by financial sector companies and USD 16.5trn of bonds issued by non-financial corporates.2
Developed economies have issued USD 88.3trn of bonds, or 75% of all the world’s bonds. In economic terms, the bond markets in developed countries measure 171% of developed market GDP. The EM bond market measures USD 29.6trn, or 25% of the global bond market. The market, which comprises both government and corporate bonds, is equivalent to 85% of EM GDP. The EM government bond market is USD 13.0trn (44% of the total), while the corporate bond market is USD 16.6trn (56% of the total). Financial sector corporates in EM have issued USD 10.7trn of total outstanding corporate debt with the balance of USD 5.9trn issued by non-financial corporates.
EM fixed income now makes up 25% of global bond markets
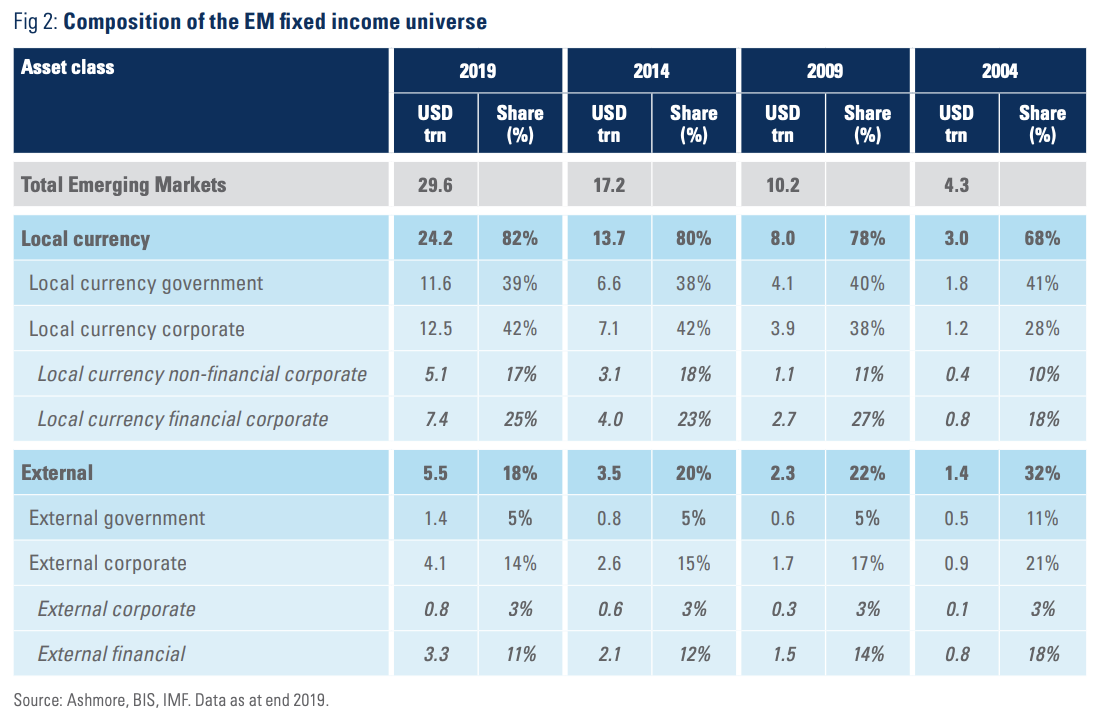
EM local currency bond markets now measure USD 24.2trn compared to USD 13.7trn in 2014, USD 8.0trn in 2009, and just USD 3.0trn in 2004
Dominant trends in the evolution of EM bond markets
The most important trend in EM fixed income is the steady growth of local currency bond markets. As of the end of 2019, the local currency bond markets in EM had grown to a size of USD 24.2trn compared to USD 13.7trn in 2014, USD 8.0trn in 2009, and just USD 3.0trn in 2004. Local bond markets make up 82% of the total EM bond market compared to 68% in 2004 (Figure 2). EM local markets tend to grow very steadily on the back of structural drivers, but they can give the impression of uneven growth year by year if measured in Dollar terms due to exchange rate movements. Local markets appear to grow faster in years with Dollar weakness and vice versa. If, as we expect, the Dollar weakens more precipitously in the coming years then the local currency bond market will appear to grow more quickly in Dollar terms than in local currency terms.
A corollary of the rise of local markets is the relative decline in EM’s Dollar-denominated bond markets, not in absolute terms, but as a share of the EM fixed income universe. Foreign currency issuance suits countries, which do not yet have large liquid domestic markets. As local markets become more advanced, countries generally turn to domestic financing options. Even so, the EM external debt universe grows every year and now measures USD 5.5trn, up from USD 4.9trn in 2018. The share of external debt in total EM fixed income has fallen from 32% in 2004 to 18% as of the end of 2019. Within the external debt universe, sovereigns have issued USD 1.4trn, while corporates have issued USD 4.1trn, which further breaks down into USD 3.3trn of financial corporate bonds and USD 0.8trn of non-financial corporate bonds.
The other big trend in EM fixed income markets is that corporate bond markets are growing more quickly than government bond markets, especially in local currency. Local currency corporate bond markets already make up the single largest segment of EM fixed income with USD 12.5trn in total outstanding, or 42% of the entire EM fixed income universe. In 2004, the local currency corporate bond universe only measured USD 1.2trn, or 28% of the total EM bond market. Financial sector corporates have issued USD 7.1trn in local markets, while other types of corporates account for the balance of USD 5.1trn.
There are USD 5.5trn of Dollar-denominated bonds in EM of which just USD 1.4trn have been issued by sovereigns
Asia accounts for 70% of all EM fixed income
Regional distribution
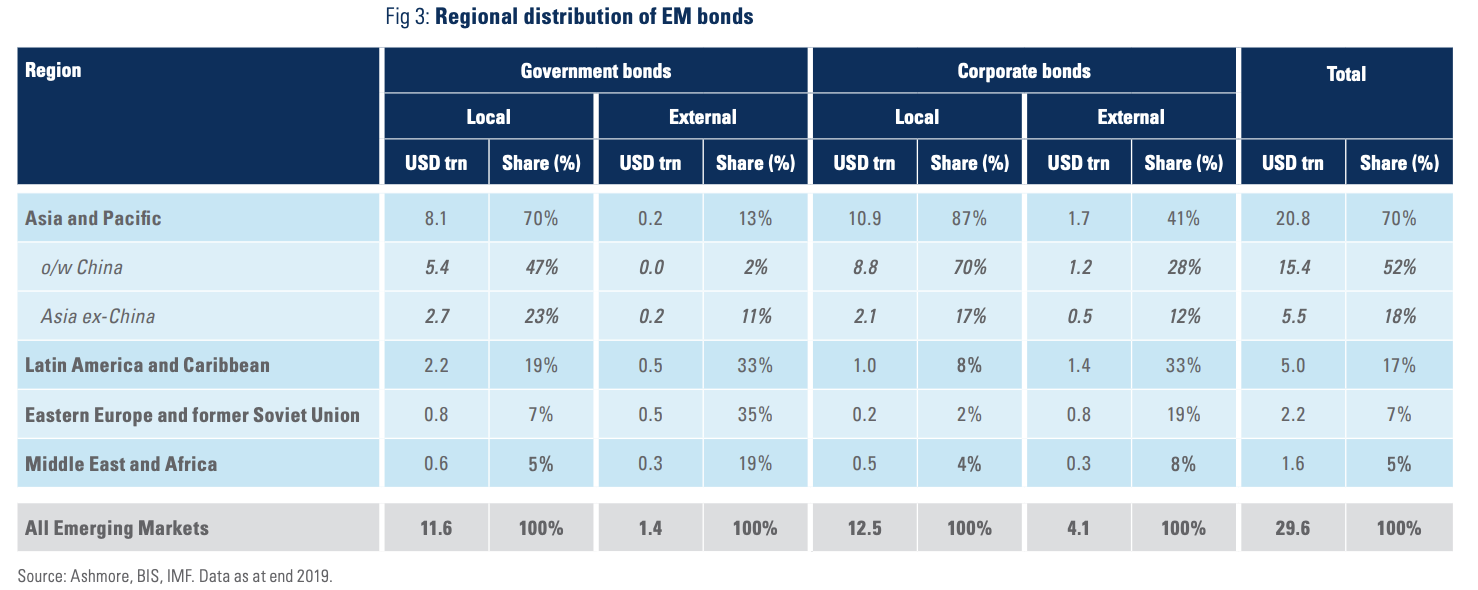
EM bonds are distributed unevenly across the various regions of EM. With USD 20.8trn of outstanding bonds, Asia accounts for 70% of all EM fixed income (Figure 3). Asian bonds also comprise 70% of all EM local currency government bonds, but only 13% of all EM external government debt, reflecting the advanced state of Asia’s local markets. Asia also accounts for 87% of all EM local currency corporate bonds plus some 41% of external corporate debt.
Latin America & Caribbean is the second-largest issuance region with 17% of outstanding EM bonds followed by Africa & the Middle East with 7% of all bonds, and Eastern Europe & the former Soviet Union 5% of EM bonds. External debt markets are relatively more important in Latin America & Caribbean and Africa & the Middle East than in Asia.
The biggest issuers
Larger bond markets tend to be more liquid than small ones, but otherwise absolute size ought not to matter a great deal. From an investment perspective, other than liquidity, the most important feature is the relationship between the riskiness of the market (what you can lose) and the yield you get (i.e. what you are paid to take the risk), relative to the same metrics in other markets.
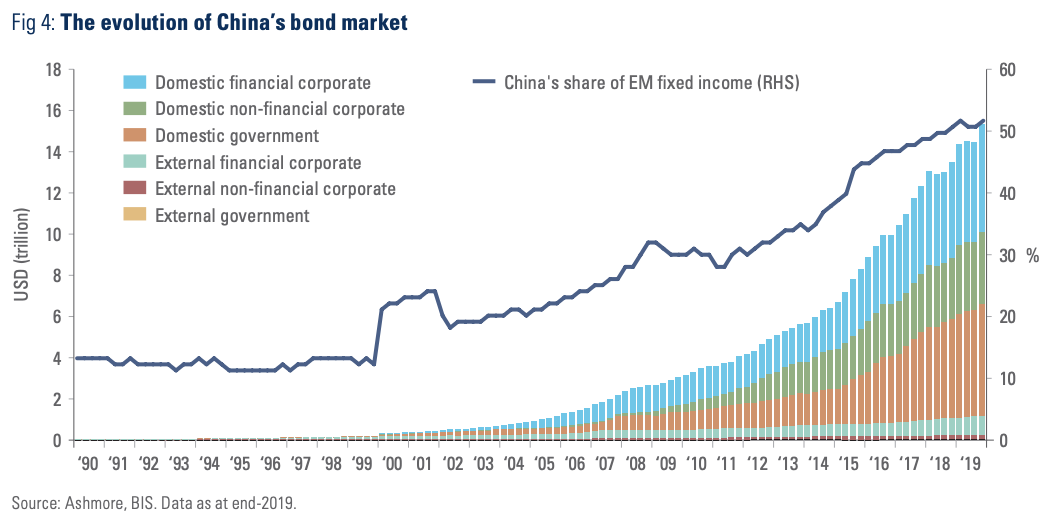
When it comes to size, China is something quite special. Between Chinese government agencies and private corporate issuance, the total Chinese bond market now measures USD 15.4trn. Growth has been spectacular. As Figure 4 shows, China’s share of the total EM fixed income universe has increased from 13% in 1990 to 52% as of the end of 2019 (equivalent to 13% of global fixed income). The vast majority of Chinese bonds are denominated in local currency and nearly twice as many Chinese bonds are issued by corporates than by the Chinese government (USD 9.9trn and USD 5.4trn, respectively).
Chinese entities have issued 52% of all EM bonds
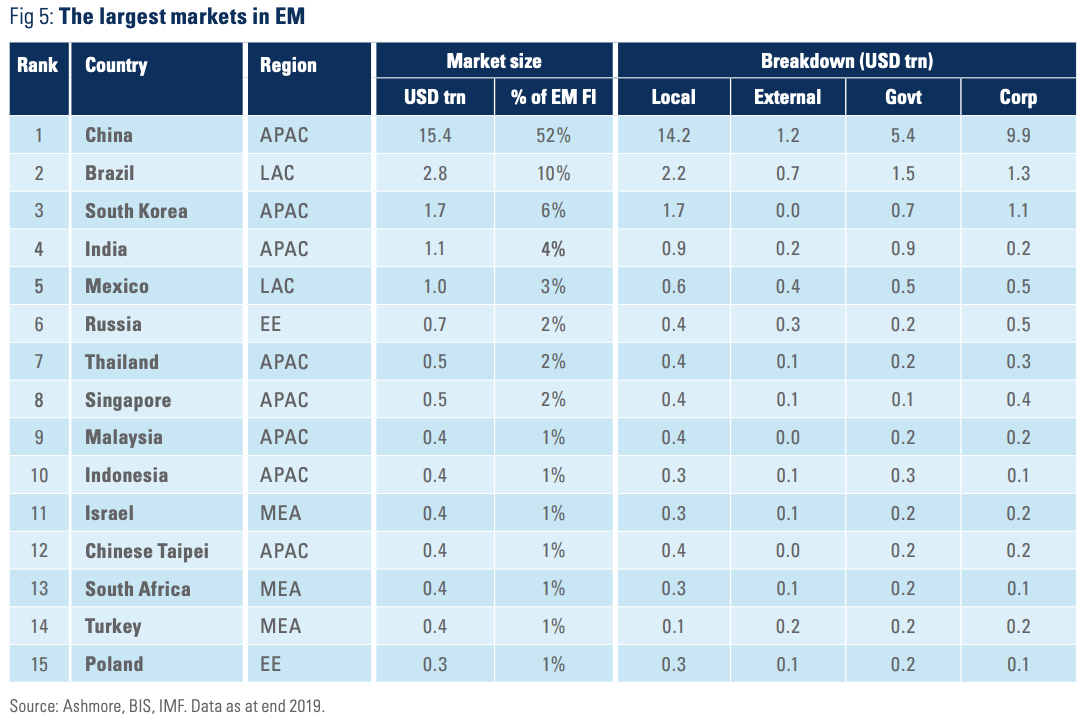
After China, the biggest EM bond markets are Brazil, South Korea, India, Mexico, and Russia
After China, EM’s second largest bond market is Brazil with USD 2.8trn in outstanding bonds and South Korea with USD 1.7trn in bonds (Figure 5). India and Mexico are next with USD 1.1trn and 1.0trn, respectively. Eight of the fifteen largest EM bond markets are Asian, while two are Latin American. The biggest markets in Eastern Europe & the former Soviet Union are Russia (USD 0.7trn) and Poland (USD 0.3trn). In the Middle East & Africa, Israel, South Africa, and Turkey are the largest issuers. With the exception of Turkey, where poor macroeconomic policies are steadily undermining the viability of local market, local currency bond markets tend to dominate the fixed income markets in the biggest EM issuers.
Future growth
EM countries remain severely under-financed. Bond and stock markets are jointly smaller than GDP in EM (ratio of 0.9), while in developed economies they are roughly 3.6 times larger than GDP. The extent of under-financing in EM means that supply is likely to be constrained by demand for many years. This may be bad for EM issuers, but it is positive for bond holders, since they get paid more yield than the risk they take. Besides, finance constrained EM issuers have less outstanding debt than their sustainable maximum.
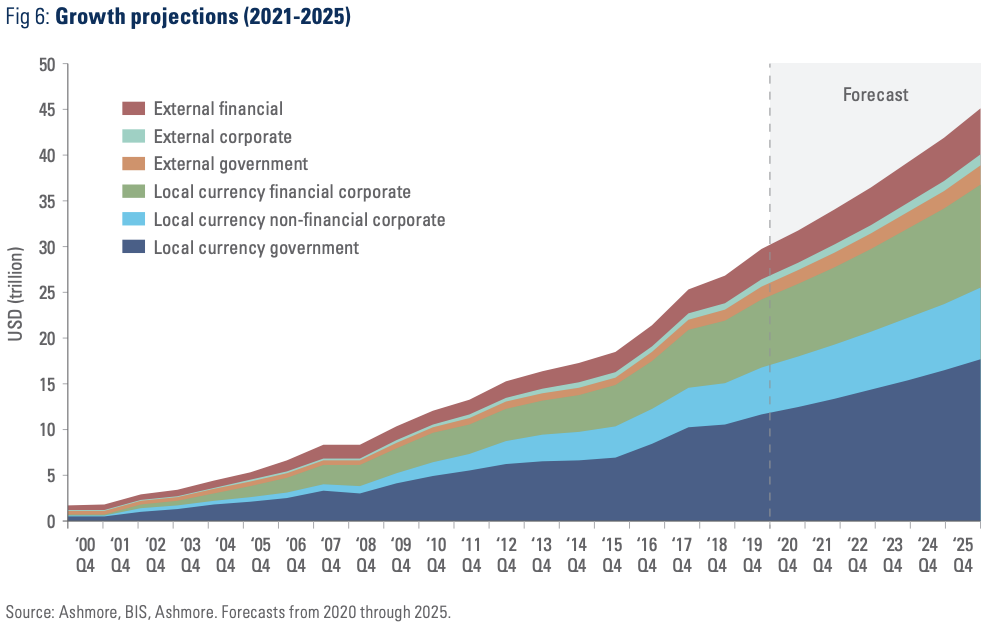
The under-financing of EM also means that EM bond markets are likely to continue to grow in a sustainable fashion for the foreseeable future. Although considerable uncertainty surrounds the global growth and fiscal outlook due to coronavirus and the end of the cyclical upswing in developed countries, we estimate that the global bond market should grow to at least USD 148trn by 2025 within which EM fixed income will be around USD 45trn, or 29% of the total. (Figure 6). The EM corporate bond universe will be at least USD 25.1trn and local currency bond markets at least USD 36.5trn, in our view.
EM countries remain severely underfinanced with financial markets comprising only 0.9x GDP compared to 3.6x in Developed Markets
Only 13% of EM fixed income is represented in the most commonly used benchmark indices
Index representation
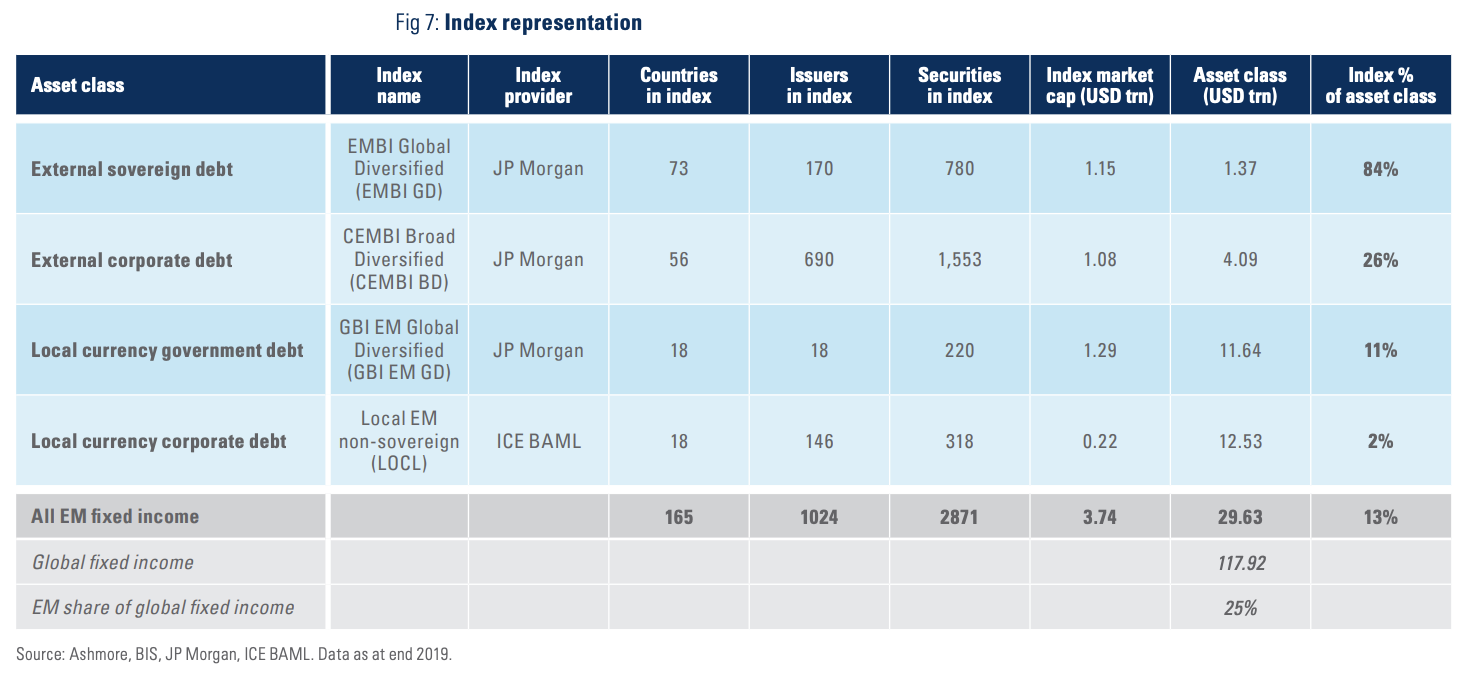
Index representation improves for the EM asset classes every year, but from a very low base. Overall, index representation remains poor.3 As Figure 7 shows, only 13% of EM fixed income is represented in the most commonly used benchmark indices. As of end-2019, there were 73 sovereigns in the main external sovereign debt index (EMBI GD) compared to 67 at the same time the previous year. At the time of writing, this number has increased further to 74 countries.
On the other hand, at the end of 2019 there were only 18 countries in the main local currency government bond index, the GBI-EM GD, and only 11% of the EM local currency government bond universe was represented in the index. The situation is even worse for local currency corporates of which only 2% are in the index (LOCL). China has been included in the GBI-EM GD, which is a major positive, since Chinese bonds offer genuine diversification benefits, especially during risk aversion episodes.4 Looking ahead, there is speculation that other countries, including Nigeria, Serbia, Ukraine, Kazakhstan, India, and Egypt could join the GBI-EM GD at some point.
In general, however, external debt is far better represented in indices than local currency debt (84% versus 11%, respectively). The reason for this enormous discrepancy is mundane: external debt is made up of mainly Dollar-denominated, Euroclearable bonds issued under New York Law, which are easier for investment banks to trade. By contrast, a local presence is required to become a good local bond market maker and many investment banks simply do not prioritise opening offices in EM countries. Hence, local currency bond indices typically only include countries, where the index provider has local market-making operations. This is an important reason for investing actively in EM; by strictly following indices investors are effectively basing their asset allocation on where a given investment bank chooses to open an office.
Diversification
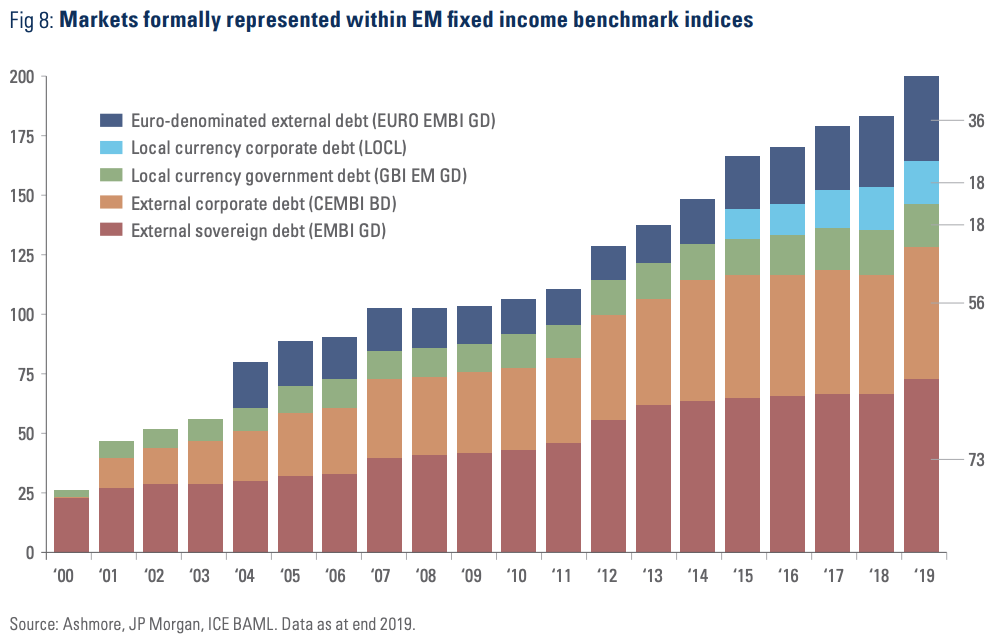
Despite poor index representation, the number of markets represented in the main EM fixed income benchmark indices nevertheless continues to increase each year, which ensures that the EM fixed income asset class is far more diversified than anything on offer in developed countries. As of the end of 2019, there were 201 individual bond markets formally represented within the four main EM fixed income benchmarks plus the EURO EMBI GD, the Euro-denominated version of EMBI GD. Figure 8 illustrates the stunning increase in the number of tradable, index-represented fixed income markets in EM since the turn of the century.5
There are now more than 200 individual markets formally represented in EM fixed income benchmark indices
Sources and methodology
The Bank of International Settlements (BIS) is the primary source of data on fixed income securities. BIS obtains data from central banks, other public sources, and commercial sources. BIS distinguishes between domestic and international markets based on where the securities are issued.
The size of the debt market in any one country is the sum of debt securities issued by residents at home (‘domestic debt securities’ in BIS terminology) and debt securities issued by non-residents within the country. A country’s bond market may be smaller than its liabilities if some of the bonds are issued in third countries, say, for tax reasons. This is particularly the case for Dollar-denominated corporate bonds in some post codes. To ensure that corporate external debt is assigned to the underlying issuer at risk and not to tax havens, we adjusted the BIS’s bond allocations in accordance with the weights in the JP Morgan CEMBI index, which already reassigns bonds back to the country of risk. All economic data is from the IMF’s World Economic Outlook database, October 2019. All index data is from ICE BAML and JP Morgan.

No part of this article may be reproduced in any form, or referred to in any other publication, without the written permission of Ashmore Investment Management Limited © 2020.
Important information: This document is issued by Ashmore Investment Management Limited (‘Ashmore’) which is authorised and regulated by the UK Financial Conduct Authority and which is also, registered under the U.S. Investment Advisors Act. The information and any opinions contained in this document have been compiled in good faith, but no representation or warranty, express or implied, is made as to their accuracy, completeness or correctness. Save to the extent (if any) that exclusion of liability is prohibited by any applicable law or regulation, Ashmore and its respective officers, employees, representatives and agents expressly advise that they shall not be liable in any respect whatsoever for any loss or damage, whether direct, indirect, consequential or otherwise however arising (whether in negligence or otherwise) out of or in connection with the contents of or any omissions from this document. This document does not constitute an offer to sell, purchase, subscribe for or otherwise invest in units or shares of any Fund referred to in this document. The value of any investment in any such Fund may fall as well as rise and investors may not get back the amount originally invested. Past performance is not a reliable indicator of future results. All prospective investors must obtain a copy of the final Scheme Particulars or (if applicable) other offering document relating to the relevant Fund prior to making any decision to invest in any such Fund. This document does not constitute and may not be relied upon as constituting any form of investment advice and prospective investors are advised to ensure that they obtain appropriate independent professional advice before making any investment in any such Fund. Funds are distributed in the United States by Ashmore Investment Management (US) Corporation, a registered broker-dealer and member of FINRA and SIPC.