Where Have All The Workers Gone?
Membership required
Membership is now required to use this feature. To learn more:
View Membership BenefitsIn our last issue we suggested that the "Inflation Genie" was out of the bottle. Since then inflation has been rising at almost double the pace forecast by the FED (as well as Wall St. and the and the Biden Administration). At the same time, job creation has slowed to about half the pace they were forecasting. Could it be that the American economy has already achieved full employment? If so, why is the Biden Administration still pushing for more stimulus and the Fed still expanding the money supply at a 15% annual pace? The Fed remains focused on the pre-pandemic employment high water mark as the key indicator of economic slack. Today 7.5 million less people have jobs than they did in January 2020. Since then 1.7 million baby boomers have opted for EARLY retirement. That alone reduces the shortfall to 5.8 million while an additional 3.5 million Americans turned 65 last year. Hundreds of thousands died or are suffering long term Covid effects while millions remain paranoid about infection risk. Just look at all the people that you see driving alone or walking outdoors still wearing masks. Immigration has failed to offset the shortfall. The number of LEGAL immigrants declined by almost one million last year. This before we even consider the extra $300 in weekly unemployment benefits. Some continue to collect more than they made working. That relatively unproductive group will eventually need to work, but others are simply collecting before they drop out of the work force. Companies are reporting large numbers of remote employees who are quitting rather than returning to the office. The combination of remote work and low mortgage rates created a mass migration to the suburbs. The majority of those migrants were millenials with young families. Faced with the high cost of childcare and commuting, those low mortgage rates enabled many former two income families to get by on one income. A huge percentage of the 3.6 million collecting benefits are either older baby boomers or young parents. Some will take jobs when schools reopen and the benefits run out, but many have no plans to return. Job openings are at record levels but workers simply aren't available. Those who do want the jobs simply aren't qualified. If you have tried to buy, rent, or order anything, you know this to be true. If you are lucky, you have a long wait for a competent, overworked employee. Alternatively you get an untrained rookie with the IQ of a rock. Even the wages of those incompetents are soaring. Wages are rising at over a 7% annual pace, even though most of new hires are a the bottom of the wage tier. Increased low income hiring reduces the "average" wage even as wages rise across the board. Those wage hikes are rapidly adding to the inflationary effect of supply shortages. Inflation is rapidly emerging as the biggest economic threat, but the Fed and the Administration continue to fight an unemployment war that has already been won. America is at full employment.
PRODUCTIVITY & GROWTH
Economic growth is affected by millions of factors, but in the end they can be summed up with just two numbers. The number of people working and how much the average worker produces. In the final months of last year businesses faced with worker shortages and supply chain disruptions were unable to meet soaring consumer demand. The incentive to get each worker to produce more was huge. At least in this respect this cycle proved typical. Productivity always soars in the early months of a recovery. This cycle is however unique in several respects. Unlike most recoveries when business slowly adds workers, people returned to work at a frantic pace when Covid restrictions were eased in the new year. Increased productivity and a rapidly expanding work force enabled the US economy to grow 1.6% (6.4% annualized) in the first quarter of 2021. Since then the pace of hiring has slowed. Productivity gains will also slow as businesses bring back their least productive workers. Over the past decade the productivity has only risen about 1% per year while growth in the work force has increased by a similar amount. Productivity should improve in the next few years. Companies faced with both strong demand as well as soaring labor and material costs will increase investment. Low interest rates and big cash positions make those decisions easy. Business investment in plant and equipment that deploys new technology is the the best indicator of future worker productivity. Surveys indicate that companies are planning a 15-25% increase in the pace of new investment in new technology during the the next 5 years. Those investments boost output while mitigating the rise in consumer prices. A portion of that increased productivity flows to the worker in the form of higher wages. That said, improved technology offsets other cost increases as one employee is able to produce what two or more employees formerly produced. Unfortunately, the productivity of the displaced workers falls. Years of experience and training suddenly become a lot less valuable. Historically net productivity gains tend to be roughly proportional to the percentage increase in investment. Excluding the huge swing since the shutdown productivity was growing about 1% per year for the previous decade. If companies stick to the announced investment plans worker productivity is likely to rise 1.15% to 1.25%. Even annual productivity gains of 1.5% fall far short of the reduction in work force growth from 1% annually to zero as 10,000 baby boomers turn 65 every month. As is typical when economies recover, both hiring and productivity have risen faster this year. Although real growth has slowed since the first quarter it is still likely to approach 4% in 2021 as the global recovery increases US exports. The lack of workforce expansion will return growth to it's sub 2% trend next year.
INFLATION & GROWTH
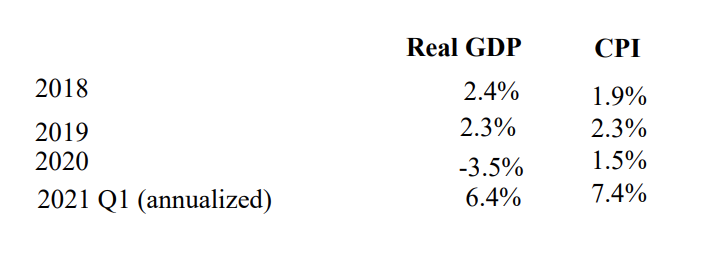
A few years back I suggested that the Feds effort to boost inflation would succeed beyond their wildest dreams. In normal cycles there is a long lag of 12-36 months between the time the Fed expands money growth and consumer prices rise more than they otherwise would. The lags are relatively shorter when the monetary expansion is financing government deficits than when it is fueled by loan growth at banks. The immediate economic boost from big deficits in early 2018 fueled rising inflation late in 2019. It takes ever larger deficits to overcome the drag on growth exerted by rising prices. Last years shutdown slowed the price hikes, but prices still rose. This year inflation is once again accelerating faster than the growth in output as it has for the last few years. You may have seen the headline that economic growth rose to 6.4% in the first quarter. You probably haven't heard that consumer prices rose 7.4% in the same time period. The press reported that consumer prices were up 2.6% at the end of March. That 2.6% number represented price changes over an entire year, whereas the 6.4% number was arrived at by multiplying the 1.6% quarterly gain times four. When you calculate CPI the same way prices rose 7.4%. Since then growth is slower even as consumer prices are rising faster.
INFLATION ( continued) Between March and May "transitory" shortages of almost everything pushed consumer prices up at a 9% annual rate. This a mirror image of the "transitory" price reductions during the shutdown in Spring 2020. The shortages will diminish as export oriented economies reopen, companies slowly ramp up production, and price hikes slow spending. The pace of price hikes will slow, but inflation will remain elevated. The 3.1% rate of price increases since the end of 2019 provides clear evidence of the accelerating price trend net of both "transitory" distortions. That rate is about 65% percent faster than the sub 2% inflation of the prior decade. The seeds of that inflationary trend were planted in 2017 with tariffs, reduced immigration and massive structural deficits financed by the FED monetary expansion. Last year's 25% expansion of M2 is only starting to impact the numbers. Consumer spending remains strong, but not as strong as the lines at stores and restaurants would lead you to believe. It just takes a lot longer to spend the money when stores and restaurants have occupancy restrictions and much of what you want is eithersold out or priced high enough to make you think twice. The recent deceleration in retail sales growth hasn't alleviated the shortage of employees necessary to manufacture, deliver, stock, serve and/ or sell the stuff. Full employment is putting huge upward pressure on labor costs. Numerous public companies have announced that rising labor costs are forcing them to raise prices. Those price hikes reduce purchasing power emboldening workers to seek further pay hikes in an inflationary cycle. It is no wonder that inflation expectations are rising. Residential rents are probably an even more important driver of both actual inflation and consumer expectations. Housing absorbs the lions share of consumer income. Appropriately rent represents almost a third of the consumer price index and is closer to 40% of core CPI. Rents have been suppressed for over a year by eviction moratoriums. Now rents are starting to rise even though moratoriums remain in place. Rents were further depressed by the migration from urban apartments to suburban home ownership. Postponed rent hikes caused a "transitory" reduction in CPI. Home prices aren't directly considered when calculating inflation, but they still matter. Rents follow home prices and building costs by about a year. When those moratoriums are lifted in September, rent hikes will accelerate. Most landlords will be reluctant to risk a sudden rash of vacancies with double digit rent hikes. Rents will still be catching up well into 2023. Nothing says inflation like rising rents. Medical costs are also poised to rise rapidly. Patients are returning to hospitals and doctor offices for procedures that were postponed during the pandemic. Hospitals still have almost $200 billion in Covid relief funds that have yet to be spent. Rising medical costs may be under represented in the CPI but still contribute to inflation. Medical costs are a much bigger part of the PCE deflator. Unlike the CPI, which targets current medical prices, the deflator relies on Medicare reimbursement rates. Those reimbursements don't change in lockstep with price hikes and can lag actual price hikes by months or even years. Idiosyncrasies like these are why the various indices report different monthly inflation rates. In any given month one index will be more representative of shifting consumer preferences than the others. Over very long periods the various indices tend to track. This year's inflation will impact both cost of living adjustments and the contracts that drive next year's inflation rate. Businesses burned by this years shortages will be willing to accept higher prices for deliveries next year. Over 50% of American households are scheduled to get a big pay raise in January. All government workers and Social Security recipients get an adjustment based on CPI through October. Unless inflation retreats significantly over the summer, that increase is likely to be around 4%. Consumer prices will continue to rise at a pace closer to 4% than 2% through 2022. We may have to start defining "transitory' in terms of years rather than months. The recent 9% annualized rise in consumer prices will slow in coming months but remain elevated. In March I suggested the cumulative expansion of money supply over the past few years would push CPI above 4%. That forecast may prove optimistic.
IT'S TIME FOR THE FED TO DECLARE VICTOR
The stated mission of the the Federal Reserve is to achieve full employment with low inflation. Inflation remained slightly below 2% for most of the past decade, but unemployment was substantially elevated in a number of those years. A few years back the Fed abandoned its efforts to preemptively contain inflation. Priority shifted to job creation. The economy is at or near full employment and prices are rising rapidly. It's time to declare victory. Recent FED actions suggest they may have already done that while officially denying any policy change. Traditionally the Fed provides stimulus by flooding the banking system with excess reserves. Those excess reserves encourage lending. Increased lending always stimulates growth and/or inflation. That process broke down in wake of the the financial crisis as loan losses and increased regulation restricted lending. Loan growth remains anemic, despite a banking system awash in excess reserves. Default fears in the wake of last year's shutdown and the subsequent ability of corporations to raise money in the bond market at low cost aggravated the lending drought. Deficit spending replaced bank lending as the the primary driver of growth. This accelerated dramatically last year. The Fed has facilitated the deficits by purchasing half of all outstanding Treasury debt with money it created out of thin air. It expanded that process with $80 billion in monthly TBond purchases. They also financed the housing boom with monthly purchases of $40 billion in mortgage backed securities. These purchases have kept long term rates artificially low. Those deficits fueled unprecedented double digit growth in personal incomes and spending last year despite an economic contraction of 3.5%. Similar to the lending debacle, the historically tight link between jobs and spending was broken. 30% of US personal income came from government handouts. GDP is quickly recovering, but 7.5 million fewer Americans are reporting to work. Although employment and growth soared (GDP up 1.6%-6.4% annualized) in Q1, real GDP was still slightly below the previous peak. Inventories were depleted and imports soared but still fell short of the 23% year over year rise in retail sales. As inventories disappeared prices rose. Since then, inflation has accelerated. CPI increased at an annual pace of 7.7% through May up from 7.4% in Q1. Consumer spending remains strong but those price hikes and shortages are slowing sales and growth. According to IHS Markits widely watched estimate, growth in April and May decelerated about 40% from the pace in Q1. They estimate annualized growth for the first 5 months has dropped to a 5.3% rate (vs 6.4% in Q1). When you adjust for inflation, consumer spending has declined. Six weeks ago Chairman Powell and other board members were still assuring us that the Fed was not "even thinking about thinking about" tapering those purchases. Recently a couple of board members have hinted that they might want to reconsider that decision. Former Fed Chairman (now Treasury Secretary) Yellen recently hinted that higher rates may be on the way. Are they waking up and starting to smell the inflation? Whether or not you believe the FEDs inflation concerns are growing, the need for bond purchases has diminished. Tax receipts are soaring and most of the stimulus money has already been handed out. Bidens $4+ Trillion dollar spending package now appears to be DOA. Spending in Q1 means 2021 deficits will be at or near 2020s record levels, but in the last couple of months the deficit is shrinking. The Treasury doesn't need to sell so many bonds. At $80 billion per month, Fed purchases exceed the current cash needs of the Treasury by billions. A month ago investors universally believed bigger deficits and higher rates were inevitable. That anticipation fueled big short positions in TBonds that pushed rates up. The Biden administration's failure to garner the votes for the spending package changed all that. After the checks went out in late March spending fell dramatically. Consumer spending followed suit and growth slowed. Investors continue to believe that the Fed is unconcerned with inflation they consider "transitory" but concern over slowing growth will keep inflation expectations and rates low. That shift in perception squeezed those short positions in bonds reducing 10 year TBond yields over 1/4% from recent highs. The shrinking deficit is clearly transitory. Tax receipts will decelerate as growth slows and spending will will jump after year end as the cost of living hikes kick in. rising inflation expectations. Simultaneously they wage a stealth attack on excessive money growth that is driving prices higher. Consider the following efforts to contain expectations in light of the ancient French proverb "nothing is confirmed until officially denied".. 4
The Fed (continued)
The Fed abandoned its preemptive efforts to contain inflation a few years ago on the theory that price hikes are driven primarily by inflation expectations. Until recently inflation expectations seemed centered around the FEDs 2% target. Inflation is now soaring in response to excess monetary creation. Expectations are rapidly catching up with the recent price hikes. Powell and company continue to assure us that inflation is "transitory" and rate hikes aren't coming any time soon. In the words of the ancient French proverb "nothing is confirmed until officially denied". Investors appear placated. but consumers clearly have their doubts. The best estimate of consumer expectations is a survey done by the University of Michigan. According to that survey consumer expectations are rising about twice as fast as investor expectations as measured by the TIPS spread. The TIPS "spread" compares conventional TBonds with Treasury Inflation Protected Securities (TIPS). That spread is considered the best measure of investor expectations. Professional investors watch the spread to gauge the expectations of other investors. As the worlds biggest TBond buyer, the FED can manipulate that spread. Reducing TIPS purchases (as they have recently done) will narrow the spread falsely implying that investor inflation expectations have retreated. Artificially reducing the TIPS spread seems to be working. Investors continue to price virtually all asset categories as if inflation "transitory". Years of Fed monetary expansion have caused bank deposits to soar, while loan demand remains weak. That mismatch has kept interest rates way below the rate of inflation. Recently, banks awash in cash from the cumulative effect of FED money printing have begun telling big corporate depositors " we don't want your money". Despite denials, the Fed is very aware of this surplus and its' long term ,inflationary consequences. They have quietly been draining a lot of that excess liquidity with daily a Reverse Repurchase ("reverses") program. "Reverses" drain cash by "selling" bonds to the banks and while agreeing to quickly "repurchase" them. In the current environment this provides numerous short term benefits. In the last month that program has risen to record levels approaching $500 billion dollars. This reduces excess liquidity without clearing indicating a transition to higher rates in the way that a reduction in the monthly bond purchases. Banks get rid of excess cash. The bonds sold to the banks through "reverses" can be then lent to the short sellers mitigating the severity of the "short squeeze. All the while the Fed maintains the illusion of ever expanding liquidity while actually reducing money supply growth. M2 money growth has slowed from last years hyper-inflationary 25% rate to below 15% in April. Increasing the "reverses" has certainly slowed money growth further but we don't get the May data for a few more weeks. The Fed has stared tightening, but banks have so much excess cash that rates are not rising YET! It is crucial to remember that monetary expansions and contractions impact economic growth quickly, while the impact on consumer prices is spread over a few years. The FED is ill equipped to reduce inflation without raising rates enough to trigger a recession.
CONCLUSIONS
For the last few years we have argued that expanding deficits financed by the Fed would inevitably lead to significantly higher inflation. This years rebound produced high single digit annualized growth in real GDP, inflation and employment. Gains in employment and output are typical of recoveries from recessions, sharply higher inflation is not. Almost everyone (including myself and the Fed), predicted that prices would be lot higher than a year ago during the shutdown. In addition to the "transitory" statistical rise in consumer prices, the longer term inflation pressures caused by excess money creation that I forecast have appeared a lot sooner than even I expected. The US has run out of workers while shortages of goods and materials are reported worldwide. Over time those shortages will disappear as price increases trigger both reduced buying and increased production. It will however take huge wage increases or a lot more immigration to alleviate the worker shortage. Employees are quitting at a record pace while layoffs are at an all time low. It all adds up to rising costs for business and higher prices for consumers. Those price hikes are aggravating the impact of shortages on growth. Shortages are slowing the rate of growth, not causing it to contract. Production is rising not falling. The three month decline in existing home sales during the last three months can only be explained by the negative effect of rising prices. How else can you explain slowing sales in the peak selling season, while mortgage rates rates remain near record lows and wages are rising? Shortages are slowly abating but growth is slowing as rising prices reduce purchasing power. Don't expect these trends to change any time soon. Few stock and bond investors seem to share my concerns. For them the only consideration is whether the FED is poised to hike rates. They seem confident that slowing growth will prevent rate hikes and "transitory" inflation will quickly disappear. In the very short term rates are unlikely to rise. The economy remains flooded with sufficient cash to support both rising inflation and record stock prices. Contrary to the prevailing view of "transitory" inflation, excess liquidity is fueling a rising inflation trend. Recent actions to drain liquidity stealthily indicate the FED is starting to consider ongoing inflation to be a real threat. Although the Fed hopes to avoid it, growth will slow further and rates will rise as the excess liquidity is absorbed by FED withdrawals and rising prices. As the combination of slowing growth and rising inflation becomes widely recognized the bubbles in the stock and bond markets will deflate. Long before inflation drops back below 2% the economy will sink into recession. The FED will try to avert that outcome by keeping interest rates below the rate of inflation. As long as that negative interest rate environment exists in a slowing economy investments like precious metals, real estate and TIPS will outperform. Consumer prices are likely to rise around 4% this year way above most forecasts. Growth will slow below 2% late in the year, reducing 2021 real GDP gains below 4%.
Sincerely,
Clyde Kendzierski
FINANCIAL SOLUTIONS GROUP LLC
FSG provides portfolio management investment advisory services to individuals, trusts, retirement plans, companies and institutions.
FSG manages client funds according to proprietary strategies developed by Clyde Kendzierski, Chief Investment Officer to manage his own retirement funds.
Please call (562) 430-2223 to learn more about how FSG can serve you.
Many Stock Brokers, Financial Planners, and Accountants are also registered as Investment Advisors. Our programs are often misperceived as competitors to their business. FSG maintains relationships with other advisors and are pleased to include additional qualified advisors in our programs to expand their business and enhance their clients’ long-term returns.
Unless otherwise indicated, investment opinions expressed in this newsletter are based on the analysis of Clyde Kendzierski, Managing Director and Chief Investment Officer of Financial Solutions Group LLC, an investment adviser registered with the California Department of Business Oversight. The opinions expressed in this newsletter may change without notice due to volatile market conditions. This commentary may contain forward-looking statements and FSG offers no guarantees as to the accuracy of these statements. The information and statistical data contained herein have been obtained from sources believed to be reliable but in no way are guaranteed by FSG as to accuracy or completeness. FSG does not offer any guarantee or warranty of any kind with regard to the information contained herein. FSG and the author believe the information in this commentary to be accurate and reliable, however, inaccuracies may occur.
Investors should consider the charges, risks, expenses, and their personal investment objectives before investing. Please see FSG’s ADV Part 2A containing this and other information. Read it carefully before you invest.
Past performance is a poor indicator of specific future returns. Such comparisons may be useful in your evaluation of how FSG performs in different market environments. Investors have the ability to achieve results similar to benchmark indices by investing in an index fund or Index-tracking ETF, typically with lower fees. Past performance of any security is not a guarantee of future performance. There is no guarantee that any investment strategy will work under all market conditions. There is no guarantee that the investments mentioned in this commentary will be in each client's portfolio.
This material is intended only for clients and prospective clients of FSG. It has been prepared solely for informational purposes and is not an offer to buy or sell or a solicitation of any offer to buy or sell any security or other financial instrument, or to participate in any trading strategy. This material does not provide individually tailored investment advice. It has been prepared without regard to the individual financial circumstances and objectives of persons who receive it. The strategies and/or investments discussed in this material may not be suitable for all investors. No mention of any security or strategy should be taken as personalized investment advice or a specific buy or sell recommendation. Please contact FSG to discuss your specific financial situation and suitability. S&P 500 Index is an unmanaged, market value-weighted index of 500 stocks generally representative of the broad stock market.
Any performance results reported herein were achieved in an actual account managed by FSG. This account serves as a model portfolio for FSG’s Diversified Sector Program. This account belongs to Clyde Kendzierski, Managing Director and is not charged advisory fees. Results reflect the net return in this account after expenses including commissions, fund management fees, and redemptions charges, if any, and reflect the reinvestment of dividends and other earnings. Performance returns are presented against the S&P 500 to show material economic and market conditions present during the period of time that FSG’s performance is presented and is not meant to serve as a comparative index. The S&P 500® is an unmanaged capitalization-weighted index of the prices of 500 large-cap common stocks actively traded in the United States. These results have not been audited. However, some results have been independently calculated and verified by an unaffiliated accountant. Where applicable, documentation is available by request.
Most clients utilize our Diversified Sector Program for at least a portion of their portfolio. Individual client strategy blend is determined by client’s age, risk tolerance, goals, and other assets as well as other factors. Increased risk offers the potential, but not the guarantee of higher returns. Investments aligned with this strategy offer the potential for loss. Actual client returns will reflect the deduction of advisory fees as described herein and in FSG’s Form ADV Part 2A. No two accounts will necessarily achieve the exact same returns, as there are factors that are unique to each account. However, whenever possible, every effort is made to transact in client accounts simultaneously with those in the model portfolio, at the same price with the same fees (if any). Reasons that actual returns in individual client accounts may differ from others or the model include: addition or withdrawal of client funds - This is especially true for new accounts during the first ninety days after an account is opened. Portfolios are not adjusted instantaneously to correspond with the model. Investments are phased in or out, as opportunities occur during subsequent weeks in an attempt to optimize the benefit to the client. The occasional or periodic withdrawal or addition of funds by the client will distort the allocation within the account between asset classes resulting in performance results that vary from the model accounts
• Taxable Status of Account: Whether funds are held in a taxable or non-taxable account will affect performance. The Diversified Sector Program was created originally for tax-exempt or tax-deferred accounts. However, a version of the same strategy is employed for taxable accounts. The model account for this strategy is an IRA account. Historically, few distinctions with regard to positions were made between taxable and non-taxable accounts. Currently, some investment decisions are made with regard to the taxable status of the account. • Waiver and timing of all or some advisory fees - The actual timing of the deduction of advisory fees in a client account may differ from the timing in the model account. This may create a disparity between the asset allocation and position allocation of the client account versus the model account. • Different fee schedules based on asset size - FSG model returns are calculated according to the highest fees charged. Some actual fee schedules may be lower. • Technical trading errors - Trade errors are corrected according to the guiding principle that the client always be made whole. • Different commission rates - This fee is primarily generated in FSG accounts when trading in ETFs and is charged directly to the client by the brokerage firm. FSG does not participate in these commissions. • Performance of securities transferred into accounts by clients and brokerage commissions incurred from the sale of these securities - Some "legacy assets" may remain in the account indefinitely if the fees associated with their sale do not justify their sale or client instruction prohibits their sale. • Restrictions on holdings in accounts - Restrictions on holdings will prohibit the matching of performance. Whether the restrictions are imposed by the client directly or via the nature of the account, FSG’s inability to align the client’s account with the model account will result in a performance dispersion. Additionally, holdings requested by clients to be maintained in their account(s) will cause the performance of the account(s) to vary from the model account used. • Some restrictions on mutual fund transactions may be imposed by the mutual fund companies. These restrictions are the result of prohibitions regarding short term sales (usually a buy and sell in the same fund within 30 days and typically triggered by the addition or withdrawal of funds in the client account). FSG attempts to avoid these restrictions when possible. • Account size - The proportional effect on performance of fees and expenses accounts of varying size will be lesser or greater than the effect in the model account.
In most cases, clients should achieve returns similar to the model portfolio (after adjustment for fees) in accounts over $250,000 that have been established for over 90 days with no additions or withdrawals of funds during the period being measured.
This material is intended only for clients and prospective clients of the FSG. It has been prepared solely for informational purposes and is not an offer to buy or sell or a solicitation of any offer to buy or sell any security or other financial instrument, or to participate in any trading strategy.
This particular material does not provide individually tailored investment advice. It has been prepared without regard to the individual financial circumstances and objectives of persons who receive it. The strategies and/or investments discussed in this material may not be suitable for all investors. No mention of any security or strategy should be taken as personalized investment advice or a specific buy or sell recommendation. Please contact FSG to discuss your specific financial situation and suitability.
It is always the intention of FSG to minimize any negative effect on clients. Our success in that effort, however, is subject to unanticipated market conditions. Consequently, past performance does not guarantee future returns.
THE 70% SOLUTION REPRODUCTIONS: Email forwarding and/or complete reproductions are authorized (must include complete attributions and disclosures). All partial quotes from The 70% Solution must include the source of your quote and reference to Financial Solutions Group LLC (FSG), the author’s name, With the exception of complete reproductions and email forwards, please write to [email protected] to inform FSG of the time and location of the reproduction. Copyright © 2013, Financial Solutions Group LLC. ALL RIGHTS RESERVED. FSG is not liable for any actions taken in reliance on information contained herein.
Membership required
Membership is now required to use this feature. To learn more:
View Membership BenefitsSponsored Content
Upcoming Virtual Events View All


