Train Wrecks in Slow Motion
Membership required
Membership is now required to use this feature. To learn more:
View Membership BenefitsTrain Wrecks in Slow Motion
I sent the following notes to clients in our managed account programs last October. “Inflation remains the number one domestic political issue…Consumer prices will rise closer to 6% than 2% {the consensus forecast} in 2022” … Current tight labor markets and overnight interest rates below inflation make recession unlikely this year… A 2023 recession is inevitable” ...in addition… “The Fed will continue to raise rates until we see a big jump in joblessness” … but “Those rate hikes are mostly priced into stocks…[so] The primary threat to stock prices has shifted from rising interest rates to falling profits.” Those lower profits are just beginning to be reported in the interim, the extreme pessimism last October set the stage for a bear market rally.
“A major bear market rally has most likely begun. The rally could easily result in gains of 20% taking the S&P 500 back up to around 4250” The 70% Solution – October 2022
Those same client notes also suggested “Unlike the market, I do not believe the funds rate is anywhere near a peak”…The interest rates that drive growth (mortgages and junk bond yields) have shut down housing and the issuance of initial public offerings”.
When the dust settled consumer prices rose 6.1% in 2022 but long-term rates had temporarily peaked (as I had suggested last summer). Lower mortgage rates combined with a shortage of existing homes for sale to boost new home sales. The economic boost from homebuilding and unacceptable inflation kept Fed rate hikes on track. Stocks and bonds fell until bank failures triggered a bailout in March. The Fed and the Federal Home Loan bank flooded hundreds of smaller banks with deposits stalling a severe credit crunch. Most interest rates fell triggering a short covering rally in stocks. The rally lifted the S&P 500 about 900 points above the October 3550 lows (the S&P rose to 4450 vs. the 4250 I considered possible).
Earnings calculated according to Generally Accepted Accounting Practices are what corporations pay taxes on and shareholders “share”. GAAP profits for Q1 2023 are coming in about 16% below their 2022 peaks (around $160 per S&P share). The recent market recovery to this years highs puts the current price/earnings ratio about 50% above long-term historical averages. (Note: The earnings you read in financial headlines are estimates of “forward operating profits”. Those estimates exclude so called “one time” losses (even though shareholders “share” those losses and seem to recur year after year for the S&P 500 as a whole).
Inflation and Interest Rates
“Annual inflation will continue to fall through June as a result of the sharp reduction of inflation in the last half of 2022. The annual rise in the CPI may even fall below 4% in June. That is likely to reverse as the year progresses." The 70% Solution – December 2022
As I expected reported annual inflation has fallen steadily this year. Consumer prices were only 4% higher in May than a year earlier. When the June numbers are reported in a few weeks it will likely be below 4%. My inflation forecast of was based on a statistical anomaly, not a crystal ball. Unusually high inflation in the first half of 2022 was displaced by unusually low inflation in the last half of the year. As the high early 2022 numbers dropped out of the annual calculation CPI fell (despite the fact that inflation in the first half of 2023 was higher than the last half of 2022). That anomaly will reverse in August when the July data is released. Year over year inflation is likely to trend higher for the remainder of 2023 supporting further credit tightening. Tighter bank lending standards and higher capital requirements may accomplish that with few additional Fed hikes. Either way, the excess liquidity that fueled the recent stock market rally will evaporate over the next few months.
There is no evidence that the upward pressure on consumer prices will abate as quickly. Early cycle inflation of food, energy and import prices that have largely been reversed are being replaced by late cycle inflation in wages and things like insurance rates. Excluding cyclical swings, inflation is driven by worker productivity and competition. US worker productivity gains have been anemic for decades, but the inflationary effects were offset by soaring world trade.
Artificial Intelligence (AI) will boost future productivity of many workers, but the aggregate impact on inflation is less. In the past, forecasts of soaring productivity from innovations like 3D printing, self-driving cars, blockchain accounting and remote work fell far short of the hype. Innovations can allow one worker to do the work of 2, 10 or even 100 skilled workers. Productivity of the handful of workers deploying the new technology soars. The productivity of thousands of experienced workers that are laid off plummet. Output rises but the gain per
average worker invariably falls far short of expectations. It is not clear whether the sea of money flooding into AI will prove profitable. Past bubbles have taught us that innovations often produce bigger profits for firms who adopt the technologies than for the early creative leaders.
Few of today’s investors experienced the inflation/recession roller coaster of the 70s and 80s. They cling to the fantasy that an end of Fed rate hikes will mark the beginning of a new bull market. In the next year or so inflation is likely to persist in a 3% - 5% range. Unlike the past few decades slowing global trade is now adding to inflationary headwinds. Inflation will only drop below 3% AFTER the next recession. The likely outcome is a multiyear period of rolling (shallow) recessions and stagflation. Now that short term rates are above inflation, the
pace hikes are poised to slow. Rates are not however coming back down anytime soon.
In March bank failures created a rush for safety. TBonds rallied briefly recovering 25% of last year’s record losses. Since then, bond prices have retrenched, cutting those modest gains by more than half. 10 year TBond yields are back above 3.75% and 30 year fixed mortgages are again approaching 7% with no evidence that they have peaked. Until 10 year TBond yields rise above 4% as they did at year end, bonds are unlikely to outperform T-Bills. Even at 4%, it’s hard to make the case for TBonds vs TBills until after the recession starts.
The growing consensus at year end that rate hikes had peaked led me to believe the stock rally I forecast in October was about to end. Stocks resumed their fall in late January, only bottoming when bailouts were announced. Bailout cash pushed rates down igniting a short covering rally in stocks. As the rally gathered steam, FOMO (fear of missing out) buying took stocks to 2023 highs. The press declared a
new bull market but only about 60% of the peak to trough losses in 2022 were recovered. The 20%+ gains in the index were attributable to only a handful of stocks. The average of the other 490+ stocks in the S&P index remain in a bear market. Big rallies are typical in big bear markets. Between 1929 and 1932 (when the Dow fell 73%) the market enjoyed four short lived 20%+ rallies.
Neither the dismal profit trend nor current interest rates are reflected in the reflated stock bubble. Unlike a handful of AI hyped stocks, numerous profitable smaller companies are trading at prices that represent acceptable long-term value for investors, but further losses could precede any gains. Like the rallies in the Great Depression recent do not represent the end of the “Mother of All Bear Markets”.
“Bear markets end with widespread capitulation while a chorus of the Stock Trader’s prayer (God, if you get me out of this mess, I swear I will never buy another stock) spreads though out the land”. The 70% Solution - December 2021
Banking Crisis - Defused not Resolved
Lessons from Prior Crises
The Great Depression
Following the bank panic of 1907, the Federal Reserve was created to prevent future bank failures from growing into systemwide panics. Soaring world trade kept consumer prices in check during the 1920s despite easy credit that fueled asset bubbles in the US and Europe (with the exception of Weimer, Germany). Late in that decade central banks attempted to reign in asset bubbles. As growth slowed, deficits rose. Governments addressed the fiscal shortfall by raising tariffs. World trade collapsed. An overleveraged global economy sank into depression. Profits collapsed and layoffs soared. Banks failed when jobless workers attempted to withdraw deposits. As Jimmy Stewart explained in the film classic “It’s a Wonderful Life”, banks don’t keep enough cash on hand to quickly repay depositors.
Long term fixed rate loans were rare in those days. Banks plagued by withdrawals couldn’t or wouldn’t refinance loans that came due. Foreclosures soared and businesses failed. Banks had lent heavily to finance stock purchases with margin loans. When stocks declined, margin calls went out. Stocks plunged. The Dow lost 73% of its value in the next few years. Like the handful of companies powering this years rally, the Dow comprised the largest and most successful companies a century ago.
Like battle plans, new regulations address recent challenges. It has been said that “battle plans collapse when the first shot is fired”. Regulations are similar. The Feds 1907 regulations were inadequate for the liquidity crisis of the 1930s. Bank liquidations pushed asset prices lower. Borrower defaults and bank failures soared in a vicious downward spiral. Depositors lost their savings. In hopes of preventing a recurrence, Congress at the behest of the Roosevelt Administration enacted new regulations.
1. The maximum rate that banks could pay customers on deposit were capped to prevent failing banks from sucking deposits out of sound banks with high rates.
2. The Glass-Stegall act separated investment banking (financing stocks and bonds) from commercial banking (loans to businesses and consumers) to prevent margin defaults from spilling over into business lending. Deposit caps and Glass Stegall were repealed in the 1970s and 1980s
3. The FDIC was established to protect small savers from being wiped out by bank failures. Large depositors were deliberately unprotected, to prevent risky banks from expanding rapidly. Financial crisis bailouts protected large depositors increasing potential bank failures.
4. Government agencies like FNMA, FHLMC, and FHA were established to create a market for long term fixed rate mortgages. Homeowners that qualified for these loans would no longer need to refinance every three to five years. Agency lending standards were watered down, leading to their failure in the financial crisis.
5. In an effort to prevent banks from being forced to sell loans or other assets prematurely, regulators created the “Held to Maturity” rule. It allowed banks to value assets at cost even when market values plunged. The Dodd Frank Act recategorized some assets “available for sale”
The Great Inflation
Regulations created in a deflationary environment failed in the inflationary spiral following the Vietnam War.
Consumer prices soared in the wake of monetized of Vietnam era deficits and the Arab oil embargo. Inflation compounded as successive administrations and the Fed failed to address the issue aggressively. Only after Jimmy Carter woke up and replaced his original appointee with Paul Volcker did inflation peak. It took years to get inflation under control. Rising deposit costs wiped out earnings of banking institutions holding fixed rate mortgages. The held to maturity rule allowed those institutions to pretend that plunging asset values didn’t exist. The result was a slow-moving train wreck that rendered the entire Savings and Loan industry insolvent. Commercial banks initially fared better. They faced similar losses on fixed rate assets, but many of their assets were business, auto and credit card loans adjusted more rapidly. Unlike Savings and Loans most bank failures were triggered by customers who were unable to pay higher rates.
The FDIC suffered massive losses repaying small depositors. Ultimately it required a taxpayer funded bailout. For decades the economy suffered rolling recessions and stagflation while stock prices fluctuated wildly but went nowhere until 1982. At that point the major averages were below levels they first reached in 1966. Regulatory focus shifted to the risk to banks from rising interest rates.
“Those who fail to learn from history are doomed to repeat it”
Sir Winston Churchill
The Great Disinflation
Between the late 1970s and the financial crisis, regulators ” encouraged” banks to structure assets so that when deposit costs increased, loan income would also go up. My primary job at the time was to manage that risk for a major California bank. As you might suspect there aren’t a lot of customers looking to make large uninsured 10 to 20 year deposits at low fixed rates. Without those deposits, fixed rate mortgages posed rate risks to banks. Banks began packaging any fixed rate mortgages they wrote into mortgage-backed bonds. Those bonds were sold to investors. Bank investment portfolios were refilled adjustable-rate mortgages. The risk of rising rates was shifted from banks to homebuyers and bond holders.
Growing world trade and Volcker’s success in corralling inflation radically reduced the risks the regulations were design to address. Homeowners with adjustable rate mortgages saw their payment drop as interest rates trended down rather than up. Homeowners with fixed rates refinanced at lower rates. Falling rates combined with strong demographics to push to up home prices. Banks losses from increasingly rare” mortgage defaults were generally recovered quickly. Mortgages came to be viewed as risk free.
Competition for these “risk free” loans squeezed lending margins. In an effort to restore profits, banks lowered lending standards. Homebuyers with subprime credit and little or no equity were willing to pay higher rates. Banks courted them aggressively unable to grasp the concept that transferring interest rate risk to borrowers would increase defaults. (For me this was déjà vu. Decades earlier I was shunned at board meetings for suggesting the bank was foolish for aggressively courting high risk borrowers with cheap adjustable-rate loans. Years after I moved on, those loans defaulted and the bank had to be taken over by a larger one). Regulators caved to the pressure to ignored default risk in an era when mortgage losses were rare. The housing bubble inflated as lenders became ever more aggressive. At the peak, anyone who could steam a mirror and sign an application could get a mortgage, even for amounts that exceeded the value
of the property.
By 2005, mortgages constituted over half of US bank assets (up from around 30% historically). Even worse, the bubble was global. When rising inflation forced up interest rates in 2007, defaults soared and home prices plunged. Banks that were “too big to fail” had to be bailed out. The regulations enacted decades earlier that pushed banks into adjustable-rate loans were at the heart of the problem. What kind of morons enacted regulations that implicitly assumed homebuyers could handle interest rate risks that had eluded seasoned bankers? Borrowers with little equity couldn’t make the bigger payments or qualify to roll over the debt into new loans. They began handing over keys to the houses.
Non-performing loans cannot be classified as “held to maturity”. Banks forced to recognize billions in losses on loans made based on housing bubble prices failed. The parallels to the Great Depression were eerie. Panicked central bankers raced to bailout failing banks with abundant liquidity as we entered the 2008 Financial Crisis.
The 2008 Financial Crisis
Bailing out the Banks - AGAIN
Virtually the entire banking system was insolvent if assets were marked to current market values. The system only survived on bailout funds. Regulators refocused on borrower defaults and away from rates that were again plunging after trending lower for decades. Regulators prohibited banks from keeping large portfolios of home mortgages. Home loans (fixed or adjustable) were immediately sold to FNMA or FHLMC. The Fed then provided banks with billions in deposits at no cost that they could reinvest with at the Fed at ¼% guaranteeing banks an ongoing source of risk-free profits. These transactions qualified as capital so banks could continue to fund existing assets. The availability of free money from the Fed allowed banks to similarly reduce rates on customer deposits to zero. Zero deposit rates pushed
depositors into riskier investments like stocks and bonds. As banks were restored to profitability they were allowed to buy “risk free” mortgage bonds issued by the same agencies that had been bailed out by taxpayers. Strong demand for those bonds from banks, the Fed and investors pushed long term rates down. Fixed rates on mortgages fell in lock step. Homeowners locked in those low fixed rates in droves.
Banks could buy those bonds but banks had come to be viewed as risky investments. They couldn’t fund risk-free bond portfolios profitably without taking interest rate risk that had been prohibited prior to the financial crisis. Decades of falling rates had however lulled regulators and investors into thinking low inflation and rates would persist forever. As banks returned to profitability, reduced regulator concerns were reinforced by the 2017 tax law that ended “stress tests” for all but the largest banks, that had kept banks from funding fixed rate assets with short term deposits.
Funding “risk free” 2%-3% mortgage bonds with zero cost deposits was profitable (as long as rates didn’t rise). Risk free government backed bonds are counted as “regulatory capital”. Small and medium size banks loaded up on the bonds and expanded rapidly. Profits and bank capital ratios soared until inflation suddenly reappeared. When the Fed addressed inflation with rate hikes the stage was set for bank failures.
“Those who fail to learn from history are doomed to repeat it”
Sir Winston Churchill
Bank Failures in 2023
The Fed tries to control inflation without damaging the economy, but tight credit and rising rates always cause something to break. If nothing breaks, inflation will continue to rise. Housing and auto sales normally break first. They are the most interest sensitive sectors of the economy. Here’s how the cycle goes. Rate hikes trigger housing and auto recessions that lead to layoffs. The recession then spreads until other companies are squeezed between consumers inability to pay higher prices and costs that are sticky. Eventually widespread unemployment and excess inventories produce sector by sector discounting. That discounting slows the price hikes. Unlike previous cycles, banks with long term fixed rated assets (rather than the housing and auto sectors) have become the most interest rate sensitive part of the
economy for a number of reasons.
1. Retiring baby boomers and reduced immigration pushed unemployment to fifty year lows.
2. Consumer debt payments are at a record low relative to incomes. Pandemic handouts as well as reduced spending reduced credit card debt while increasing household savings. Finally, homeowners rolled a lot of debt into home mortgages and locked at rates below 3%.
3. Supply chain issues reduced auto production creating a backlog of auto demand.
Home resales plunged as owners refused to give up cheap mortgages, while the scarcity of adjustable mortgages and a strong job market also minimized foreclosures. Sales of new homes and autos remain strong while existing home prices have only dropped slightly. Unlike laid off workers, banks can delay recognition of their losses by manipulating the “held to maturity” rule.
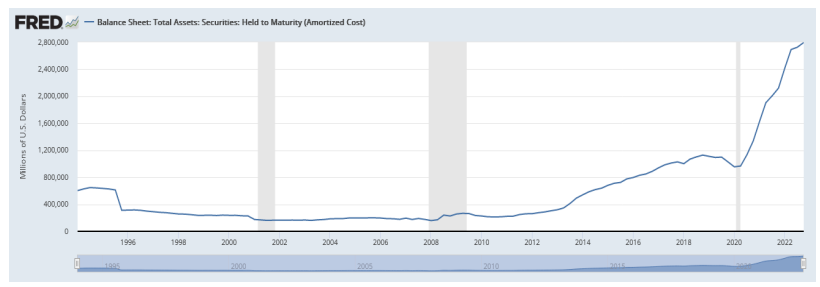
In the decade following the financial crisis, banks classified most bonds as “available for sale”. As rates fell those assets appreciated, boosting earnings and capital ratios that allowed further expansion. When rates rose rapidly last year, bond values plunged. When bonds fell below their original cost, banks reclassified assets as “held to maturity” as shown in the chart below. “Held to Maturity” assets are valued at original cost even when their actual liquidation value is a lot less that the deposits that depend on them for repayment. When President Biden, Fed Chairman Powell or Treasury Secretary Yellen tell you banks are “well capitalized” they are talking about “regulatory”
capital”. Marking assets to market value tells a different story. At the worst point this year, total US banking assets were worth less than what banks owed depositors. Recent calculations indicate banks ended last year in worse shape than they were going into the financial crisis. Silicone Valley Bank (SVB) had a strong capital ratio of 16% based on “held to maturity” but less than a 5% capital ratio if assets were “marked to market”.
“The worst bond market decline in history has decimated the value of bond portfolios that banks rely on for capital. These losses aren’t reported until the bank expects to have to sell the bonds”. The 70% Solution – December 2022
The capital deficiency was exposed when SVB and other banks were unable to replace deposits that customers withdrew. This pressured banks to recategorize securities so they were marked to market. Holding on for recovery is not an option when deposits can’t be replaced. The purchase of remaining assets by JP Morgan Chase at fire sale prices eradicating the remaining 5% capital and more. Losses were absorbed by the FDIC.
Over 2200 banks were identified as insolvent in the 1st quarter. Withdrawals soared. The Federal Home Loan Bank (FHLB) borrowed $250 Billion dollars in the second week of March alone to provide these banks with deposits, postponing failures. FDIC payments to uninsured depositors reassured depositors at other weak banks. Withdrawals slowed to manageable levels. The immediate crisis ended, but the underlying problems remain. Banks receiving those deposits will have to pay the FHLB over 5% (which is more then they earn on the bonds they own). Those banks still profit from customers who accept little or no interest on their deposits, but monthly losses are compounding. The problems for these banks run far deeper. Remote work and labor shortages have emptied office buildings. Those vacancies will result in defaults on mortgages held by these same regional banks. Corporate leases typically last a year or more. Offices may be empty but companies continue to pay rent for now. Replacement tenants are few and far between. (For more detailed data on the looming commercial real estate crisis, I have included a report from my longtime collaborator Charles Rother of Sector Logic). The crisis was been replaced with a slow-moving train wreck.
The bailout postponed bank failures, fueled the current stock rally and postponed the recession. In the unlikely event recession is avoided, soaring deficits and slowing global trade guarantee that inflation will resurge.
Sincerely,
Clyde Kendzierski
Financial Solutions Group LLC
FINANCIAL SOLUTIONS GROUP LLC
FSG provides portfolio management investment advisory services to individuals, trusts, retirement plans, companies and
institutions.
FSG manages client funds according to proprietary strategies developed by Clyde Kendzierski, Chief Investment Officer to
manage his own retirement funds.
Please call (562) 430-2223 to learn more about how FSG can serve you.
Many Stock Brokers, Financial Planners, and Accountants are also registered as Investment Advisors.
Our programs are often misperceived as competitors to their business.
FSG maintains relationships with other advisors and are pleased to include additional qualified advisors in our programs to
expand their business and enhance their clients’ long-term returns.
Unless otherwise indicated, investment opinions expressed in this newsletter are based on the analysis of Clyde
Kendzierski, Managing Director and Chief Investment Officer of Financial Solutions Group LLC, an investment adviser
registered with the California Department of Business Oversight. The opinions expressed in this newsletter may change
without notice due to volatile market conditions. This commentary may contain forward-looking statements and FSG offers
no guarantees as to the accuracy of these statements. The information and statistical data contained herein have been
obtained from sources believed to be reliable but in no way are guaranteed by FSG as to accuracy or
completeness. FSG does not offer any guarantee or warranty of any kind with regard to the information contained herein.
FSG and the author believe the information in this commentary to be accurate and reliable, however, inaccuracies may
occur.
Investors should consider the charges, risks, expenses, and their personal investment objectives before investing. Please see FSG’s ADV Part 2A containing this and other information. Read it carefully before you invest. Past performance is a poor indicator of specific future returns. It, however, may be useful in your evaluation of how FSG performs in different market environments. Investors have the ability to achieve results similar to benchmark indices by investing in an index fund or Index-tracking ETF, typically with lower fees. Past performance of any security is not a guarantee of future performance. There is no guarantee that any investment strategy will work under all market conditions.
There is no guarantee that the investments mentioned in this commentary will be in each client's portfolio. This material is intended only for clients and prospective clients of FSG. It has been prepared solely for informational purposes and is not an offer to buy or sell or a solicitation of any offer to buy or sell any security or other financial instrument, or to participate in any trading strategy.
This material is intended only for clients and prospective clients of the FSG. It has been prepared solely for informational purposes and is not an This circumstances material and does not objectives provide of persons individually who receive tailored it. The investment strategies advice. 7 and/ or It has investments been prepared discussed in without this regard material to may not be suitable for all investors. No mention of any security or strategy should be taken as personalized investment advice or a specific buy or sell recommendation. Please contact FSG to discuss your specific financial situation and suitability.
S&P 500 Index is an unmanaged, market value-weighted index of 500 stocks generally representative of the broad stock market. Performance results reported herein were achieved in an actual account managed by FSG. This account serves as a model portfolio for FSG’s Diversified Sector Program. This account belongs to Clyde Kendzierski, Managing Director and is not charged advisory fees. Results reflect the net return in this account after expenses including commissions, fund management fees, and redemptions charges, if any, and reflect the reinvestment of dividends and other earnings.
Performance returns are presented against the S&P 500 to show material economic and market conditions present during the period of time that FSG’s performance is presented and is not meant to serve as a comparative index. The S&P 500® is an unmanaged capitalization-weighted index of the prices of 500 large-cap common stocks actively traded in the United States. These results have not been audited. However, some results have been independently calculated and verified by an unaffiliated accountant. Where applicable, documentation is available by request.
Most clients utilize our Diversified Sector Program for at least a portion of their portfolio. Individual client strategy blend is determined by client’s age, risk tolerance, goals, and other assets as well as other factors. Increased risk offers the potential, but not the guarantee of higher returns. Investments aligned with this strategy offer the potential for loss. Actual client returns will reflect the deduction of advisory fees as described herein and in FSG’s Form ADV Part 2A. No two accounts will necessarily achieve the exact same returns, as there are factors that are unique to each account. However, whenever possible, every effort is made to transact in client accounts simultaneously with those in the model portfolio, at the same price with the same fees (if any). Reasons that actual returns in individual client accounts may differ from others or the model include:
Addition or withdrawal of client funds - This is especially true for new accounts during the first ninety days after an account is opened. Portfolios are not adjusted instantaneously to correspond with the model. Investments are phased in or out, as opportunities occur during subsequent weeks in an attempt to optimize the benefit to the client. The occasional or periodic withdrawal or addition of funds by the client will distort the allocation within the account between asset classes resulting in performance results that vary from the model accounts.
• Taxable Status of Account Whether funds are held in a taxable or non-taxable account will affect performance. The Diversified Sector Program was created originally for tax-exempt or tax-deferred accounts. However, a version of the same strategy is employed for taxable accounts. The model account for this strategy is an IRA account. Few distinctions with regard to positions are made between taxable and non-taxable accounts.
• Waiver and timing of all or some advisory fees - The actual timing of the deduction of advisory fees in a client account may differ from the timing in the model account. This may create a disparity between the asset allocation and position allocation of the client account versus the model account.
• Different fee schedules based on asset size - FSG model returns are calculated according to the highest fees charged. Some actual fee schedules may be lower.
• Technical trading errors - Trade errors are corrected according to the guiding principle that the client always be made whole.
• Different commission rates - This fee is primarily generated in FSG accounts when trading in ETFs and is charged directly to the client by the brokerage firm. FSG does not participate in these commissions.
• Performance of securities transferred into accounts by clients and brokerage commissions incurred from the sale of these securities - Some "legacy assets" may remain in the account indefinitely if the fees associated with their sale do not justify their saleor client instruction prohibits their sale.
• Restrictions on holdings in accounts - Restrictions on holdings will prohibit the matching of performance. Whether the restrictions are imposed by the client directly or via the nature of the account, FSG’s inability to align the client’s account with the model account will result in a performance dispersion. Additionally, holdings requested by clients to be maintained in their account(s) will cause the performance of the account(s) to vary from the model account used.
Some restrictions on mutual fund transactions may be imposed by the mutual fund companies. These restrictions are the result of prohibitions regarding short term sales (usually a buy and sell in the same fund within 30 days and typically triggered by the addition or withdrawal of funds in the client account). FSG attempts to avoid these restrictions when possible.
Account size - The proportional effect on performance of fees and expenses accounts of varying size will be lesser or greater than the effect in the model account.
In most cases, clients should achieve returns similar to the model portfolio (after adjustment for fees) in accounts over $250,000 that have been established for over 90 days with no additions or withdrawals of funds during the period being measured.
This material is intended only for clients and prospective clients of the FSG. It has been prepared solely for informational purposes and is not an offer to buy or sell or a solicitation of any offer to buy or sell any security or other financial instrument, or to participate in any trading strategy.
This material does not provide individually tailored investment advice. It has been prepared without regard to the individual financial circumstances and objectives of persons who receive it. The strategies and/or investments discussed in this material may not be suitable for all investors. No mention of any security or strategy should be taken as personalized investment advice or a specific buy or sell recommendation. Please contact FSG to discuss your specific financial situation and suitability.
It is always the intention of FSG to minimize any negative effect on clients. Our success in that effort is subject to unanticipated market conditions. Consequently, past performance does not guarantee future returns THE 70% SOLUTION REPRODUCTIONS: Email forwarding and/or complete reproductions are authorized (must include complete attributions and disclosures). All partial quotes from The 70% Solution must include the source of your quote and reference to Financial Solutions Group LLC (FSG), the author’s name, and the following web address: www.financial-solutions-group.com. With the exception of complete reproductions and email forwards, please write to [email protected] to inform FSG of the time and location of the reproduction.
Copyright © 2013, Financial Solutions Group LLC. ALL RIGHTS RESERVED. FSG is not liable for any actions taken in reliance on information contained herein.
A message from Advisor Perspectives and VettaFi: To learn more on this and other topics, check out our white papers.
Membership required
Membership is now required to use this feature. To learn more:
View Membership Benefits