Additional content provided by Brian Booe, Analyst, Research.
With a week as jam-packed with economic data, earnings, and events as last week, it’s no surprise it ended with a bout of volatility. Stocks broadly treaded water for most of the week as market participants digested the latest big tech earnings, the July Federal Open Market Committee (FOMC) decision, a flurry of economic data, and another U.S. tariff salvo — before major equity averages ultimately slumped in response to a weaker-than-expected payrolls print paired with the largest revision to prior months in five years. The payrolls surprise sparked what is arguably a necessary breather for an overbought U.S. equity market to grind higher, while also fueling a notable short-term Treasury rally as Federal Reserve (Fed) rate cut bets jumped.
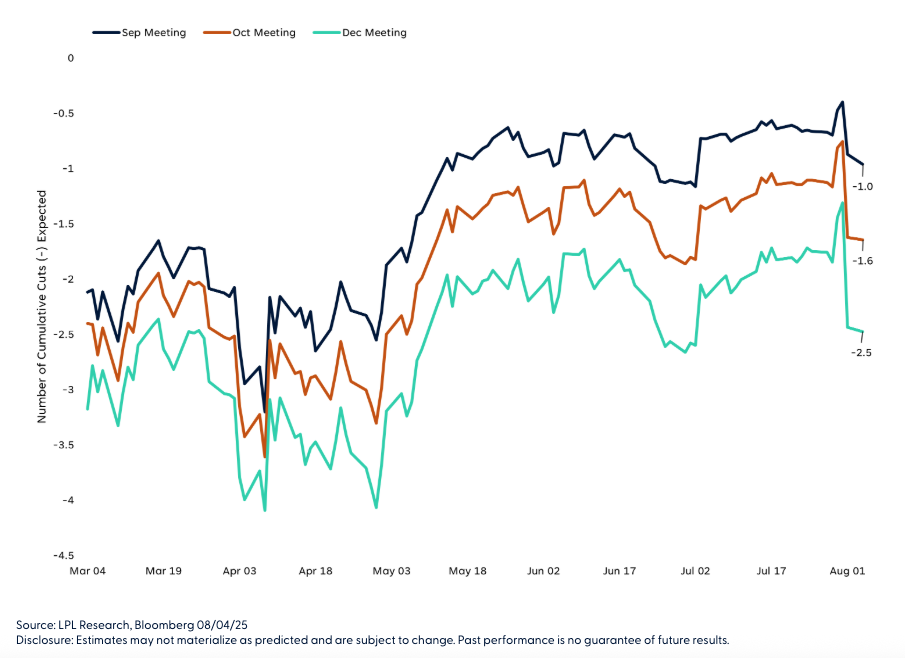
Fed funds futures had just a 65% chance of a September rate cut priced in to start the week, tumbling as low as a 39% chance on Thursday as investors digested Fed Chair Powell’s FOMC meeting press conference, hinting that rates may remain elevated. However, Friday’s slate of economic data undermined the Fed’s ‘wait-and-see’ approach and revealed some cracks in the labor market, inspiring traders to fully price in two Fed rate cuts before investors sing Auld Lang Syne on New Year’s Eve.
Fed Funds Futures Price in Two 2025 Rate Cuts Again

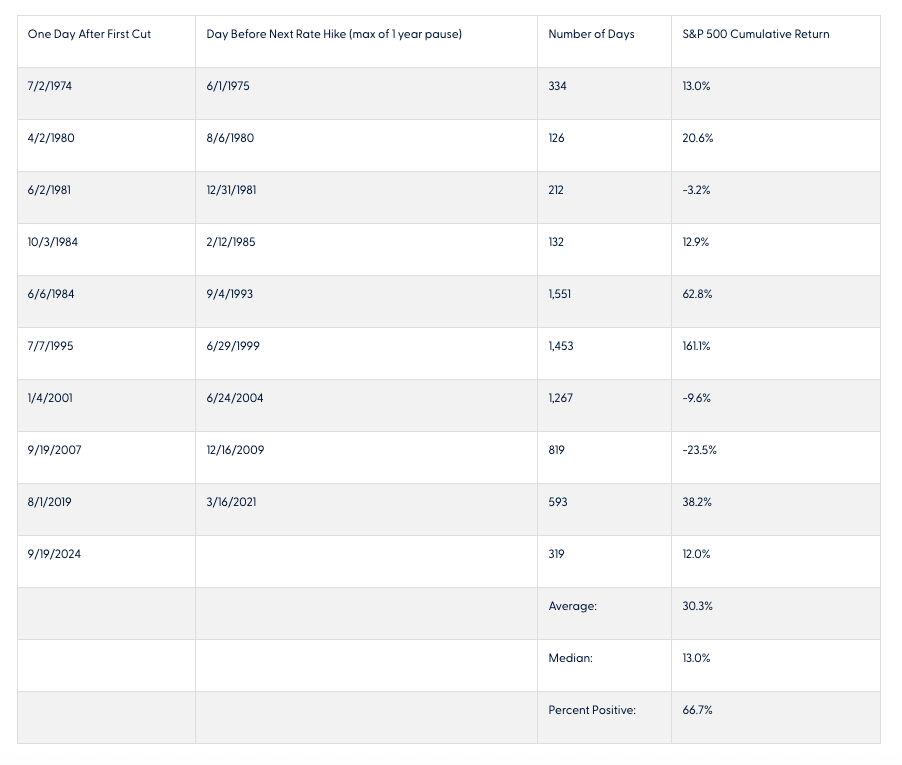
We would be remiss not to mention that data arriving over the seven weeks between now and the September 17 FOMC session could shift the tide again. However, with the spike in expectations of the Fed resuming its rate cutting cycle next month, we ask: how do equities perform over the course of a Fed easing cycle? Based on performance during the last nine major easing cycles dating back to the 1970s (defined as the initial period of Fed rate cuts in the easing cycle through the next hike, or a pause in monetary policy changes no longer than one year), the S&P 500 has broadly generated positive returns. The equity benchmark moved higher during easing cycles two-thirds of the time (67%), adding an average of 30.3% over the course of easing cycles and the subsequent one-year pause, with a median return of 13.1%. The study did yield two outliers: one being the rate cutting cycle ahead of the dot com bubble in the late 1990s, which marked not only the second-longest cycle in our study but also a blistering 161% rally. The second outlier and weakest set of returns came during the brunt of the great financial crisis, as central bankers scrambled to rejuvenate the American economy and kickstart a banking system in turmoil — in which the S&P 500 shed 23.5%. Excluding the two outliers, the equity benchmark returned 19.3% over Fed rate cutting cycles.
S&P 500 Cumulative Performance During Policy Easing Cycles
What's Next?
Just 319 days into the current cycle, well below the average of 721 days per easing cycle for our study, the S&P 500 is up 12.0% with additional cuts likely on the way. Using history and prior Fed cutting cycles as a guide, some upside potential may remain for the second half of 2025. Further, the latest big tech earnings reports continued to deliver robust artificial intelligence (AI) spending plans. In addition to signaling the secular AI growth theme remains intact, these spending plans are a big potential driver of earnings growth and future productivity gains. But of course, past performance does not guarantee future results, and a new tariff regime not seen since the 1930s could slow earnings growth and fuel volatility.
The delayed effects of trade policy are likely to weigh on the economy in the second half, leading to weaker labor market demand (as noted in our 2025 Midyear Outlook). Recent market complacency toward trade policy and an economic narrative dependent upon strong economic data has caught our attention in recent weeks as a potential point of weakness. With only a handful of major trade deals left to be inked (namely China and Mexico), a floor for the effective tariff rate at 15% is likely set. The effects will be temporary, but some upward pressure on inflation and a drag on profit margins have yet to be felt and will be this market’s biggest test over the seasonally weak period for the stock market over August and September. Friday’s slate of data and tariff announcements may have partially helped reset market expectations, but a lot of optimism lingers, and tariff risks should not be ignored in the near term.
Conclusion
Bottom line, investors may be well served by bracing for occasional bouts of volatility given how much optimism is currently reflected in equity prices. LPL’s Strategic and Tactical Asset Allocation Committee (STAAC) maintains its tactical neutral stance on equities. The STAAC advises against increasing portfolio risk beyond benchmark targets currently and continues to monitor tariff negotiations, economic data, earnings, the bond market, and various technical indicators to identify a potentially more attractive entry point to add equities on weakness. The Committee’s regional preferences across the U.S, developed international, and emerging markets (EM) are aligned with benchmarks. The Committee still favors growth over value, large caps over small caps, and the communication services and financials sectors.
A message from Advisor Perspectives and VettaFi: To learn more about this and other topics, check out some of our webcasts.
Important Disclosures
This material is for general information only and is not intended to provide specific advice or recommendations for any individual. There is no assurance that the views or strategies discussed are suitable for all investors. To determine which investment(s) may be appropriate for you, please consult your financial professional prior to investing.
Investing involves risks including possible loss of principal. No investment strategy or risk management technique can guarantee return or eliminate risk.
Indexes are unmanaged and cannot be invested into directly. Index performance is not indicative of the performance of any investment and does not reflect fees, expenses, or sales charges. All performance referenced is historical and is no guarantee of future results.
This material was prepared by LPL Financial, LLC. All information is believed to be from reliable sources; however LPL Financial makes no representation as to its completeness or accuracy.
Unless otherwise stated LPL Financial and the third party persons and firms mentioned are not affiliates of each other and make no representation with respect to each other. Any company names noted herein are for educational purposes only and not an indication of trading intent or a solicitation of their products or services.
Asset Class Disclosures –
International investing involves special risks such as currency fluctuation and political instability and may not be suitable for all investors. These risks are often heightened for investments in emerging markets.
Bonds are subject to market and interest rate risk if sold prior to maturity.
Municipal bonds are subject and market and interest rate risk and potentially capital gains tax if sold prior to maturity. Interest income may be subject to the alternative minimum tax. Municipal bonds are federally tax-free but other state and local taxes may apply.
Preferred stock dividends are paid at the discretion of the issuing company. Preferred stocks are subject to interest rate and credit risk. They may be subject to a call features.
Alternative investments may not be suitable for all investors and involve special risks such as leveraging the investment, potential adverse market forces, regulatory changes and potentially illiquidity. The strategies employed in the management of alternative investments may accelerate the velocity of potential losses.
Mortgage backed securities are subject to credit, default, prepayment, extension, market and interest rate risk.
High yield/junk bonds (grade BB or below) are below investment grade securities, and are subject to higher interest rate, credit, and liquidity risks than those graded BBB and above. They generally should be part of a diversified portfolio for sophisticated investors.
Precious metal investing involves greater fluctuation and potential for losses.
The fast price swings of commodities will result in significant volatility in an investor's holdings.
This research material has been prepared by LPL Financial LLC.
Not Insured by FDIC/NCUA or Any Other Government Agency | Not Bank/Credit Union Deposits or Obligations | Not Bank/Credit Union Guaranteed | May Lose Value
For Public Use – Tracking: #778995
Read more commentaries by LPL Financial