The S&P 500 clawed back from nearly a 5% deficit in November to finish the month with a modest 0.1% gain. The rebound was fueled by strong earnings, renewed optimism around artificial intelligence (AI), hopes for a Russia-Ukraine ceasefire, and a significant repricing of Federal Reserve (Fed) rate-cut expectations. Consumer strength also came into focus as Black Friday officially kicked off the holiday spending cycle that continued into this week with Cyber Monday sales. The National Retail Federation reported that a record 202.9 million consumers went shopping during this period. In-store shopping was up 3% compared to last year, while online shopping jumped 9%. Even AI played a role, with Visa reporting that nearly half of U.S. shoppers used an AI tool in some capacity for holiday shopping.
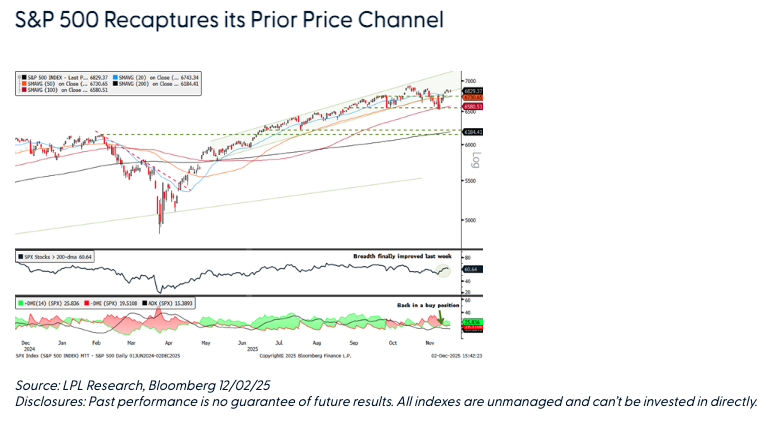
The recovery into month-end repaired a lot of recent technical damage. Broad-based buying pressure last week lifted the S&P 500 back above its 50-day moving average (dma) and into its prior price channel. Market breadth and momentum measures also improved. The percentage of S&P 500 stocks trading above their 200-dma rose to 60%. While this reading is relatively low for a market trading near record-high territory, it marked an important step in the right direction after flirting with a concerningly low 50% level in mid-November. The Percent Price Oscillator (PPO) — an indicator based on the relationship between two moving averages — also switched back into a buy position, implying an upward bias to price action.
While last week’s rally was impressive, the rebound stopped short of taking out resistance from the November highs at the 6,851–6,870 range. For now, this leaves the S&P 500 with a concerning trend of lower highs and lower lows since October. Another missing piece of the recovery puzzle has been retail investors, who have not shown up to buy the latest dip. According to VandaXasset data, the retail cohort — who have steadily supported stocks since April — have been de-risking U.S. equity positions since October.

Defense Takes the Field
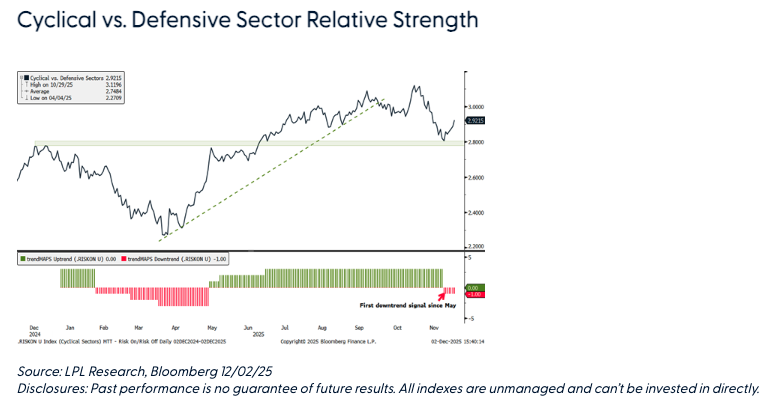
Rotation is often called the “lifeblood of a bull market,” and this cycle has largely featured big-tech leadership followed by broader moves into other cyclical sectors. Recently, however, the rotation away from tech has shifted toward defensive areas, marking the first notable sign of risk aversion since the April rebound. The ratio of cyclical to defensive sectors has broken its prior uptrend, and our trend model now classifies cyclical leadership as potentially entering a downtrend for the first time since May. While this could simply be a pullback from elevated levels, the shift warrants close attention — particularly if the ratio chart falls below key support established at the 2024 highs.
Seasonal Tailwinds Return
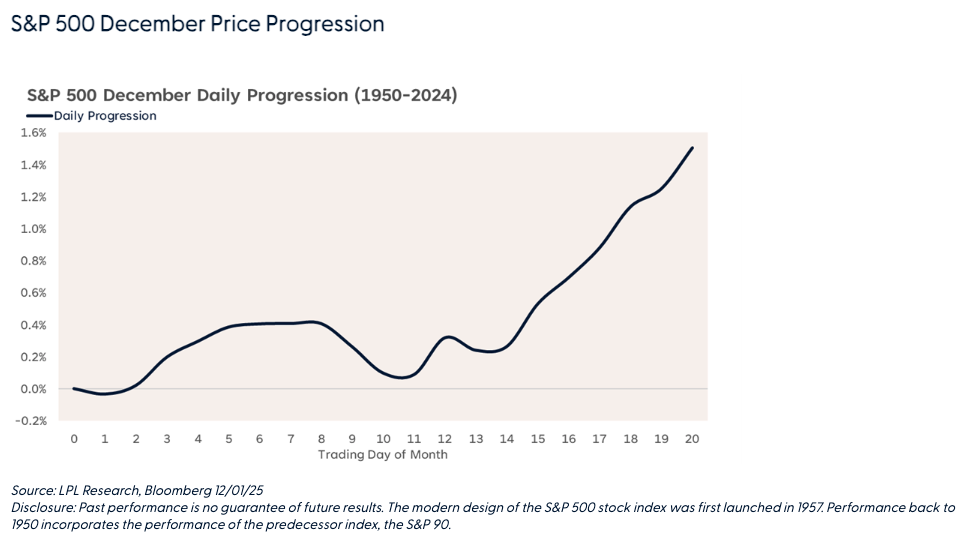
Seasonal trends suggest the late-November momentum could carry forward this month. Since 1950, the S&P 500 has averaged a 1.4% gain in December and finished higher 73% of the time — the strongest positivity rate of any month. When December is positive, the average gain is 2.9%, compared to an average loss of 2.6% in negative years.
However, as the “S&P 500 December Price Progression” chart below highlights, equity market strength typically emerges in the second half of the month. Historically, the index tends to hover around the flatline during the first half of December, with upward momentum building around the 11th trading day, though past performance is no guarantee of future results.
Conclusion
Stocks have mounted a strong rebound since late November, underpinned by solid fundamentals and a favorable macro environment. Much of the technical damage from the recent pullback has been repaired, with notable improvements in market breadth and momentum indicators. That said, it’s still too early to declare an all-clear. Emerging leadership trends and the absence of retail investor participation raise questions about the sustainability of this recovery. While our long-term outlook for the bull market remains intact, we still see potential downside risks in the near term.
Adam Turnquist oversees the management and development of technical research at LPL Financial. His investment career spans over 15 years.
A message from Advisor Perspectives and VettaFi: Discover something new! Click here to register for our upcoming webcasts.
Important Disclosures
This material is for general information only and is not intended to provide specific advice or recommendations for any individual. There is no assurance that the views or strategies discussed are suitable for all investors. To determine which investment(s) may be appropriate for you, please consult your financial professional prior to investing.
Investing involves risks including possible loss of principal. No investment strategy or risk management technique can guarantee return or eliminate risk.
Indexes are unmanaged and cannot be invested into directly. Index performance is not indicative of the performance of any investment and does not reflect fees, expenses, or sales charges. All performance referenced is historical and is no guarantee of future results.
This material was prepared by LPL Financial, LLC. All information is believed to be from reliable sources; however LPL Financial makes no representation as to its completeness or accuracy.
Unless otherwise stated LPL Financial and the third party persons and firms mentioned are not affiliates of each other and make no representation with respect to each other. Any company names noted herein are for educational purposes only and not an indication of trading intent or a solicitation of their products or services.
Asset Class Disclosures –
International investing involves special risks such as currency fluctuation and political instability and may not be suitable for all investors. These risks are often heightened for investments in emerging markets.
Bonds are subject to market and interest rate risk if sold prior to maturity.
Municipal bonds are subject and market and interest rate risk and potentially capital gains tax if sold prior to maturity. Interest income may be subject to the alternative minimum tax. Municipal bonds are federally tax-free but other state and local taxes may apply.
Preferred stock dividends are paid at the discretion of the issuing company. Preferred stocks are subject to interest rate and credit risk. They may be subject to a call features.
Alternative investments may not be suitable for all investors and involve special risks such as leveraging the investment, potential adverse market forces, regulatory changes and potentially illiquidity. The strategies employed in the management of alternative investments may accelerate the velocity of potential losses.
Mortgage backed securities are subject to credit, default, prepayment, extension, market and interest rate risk.
High yield/junk bonds (grade BB or below) are below investment grade securities, and are subject to higher interest rate, credit, and liquidity risks than those graded BBB and above. They generally should be part of a diversified portfolio for sophisticated investors.
Precious metal investing involves greater fluctuation and potential for losses.
The fast price swings of commodities will result in significant volatility in an investor's holdings.
This research material has been prepared by LPL Financial LLC.
Not Insured by FDIC/NCUA or Any Other Government Agency | Not Bank/Credit Union Deposits or Obligations | Not Bank/Credit Union Guaranteed | May Lose Value
For Public Use – Tracking: #832388
Read more commentaries by LPL Financial